

Semiquantitative Parameters in PSMA-Targeted PET Imaging with 18F-DCFPyL: Variability in Normal-Organ Uptake
- PMID: 27932557
- PMCID: PMC5450367
- DOI: 10.2967/jnumed.116.179739
Semiquantitative Parameters in PSMA-Targeted PET Imaging with 18F-DCFPyL: Variability in Normal-Organ Uptake
Abstract
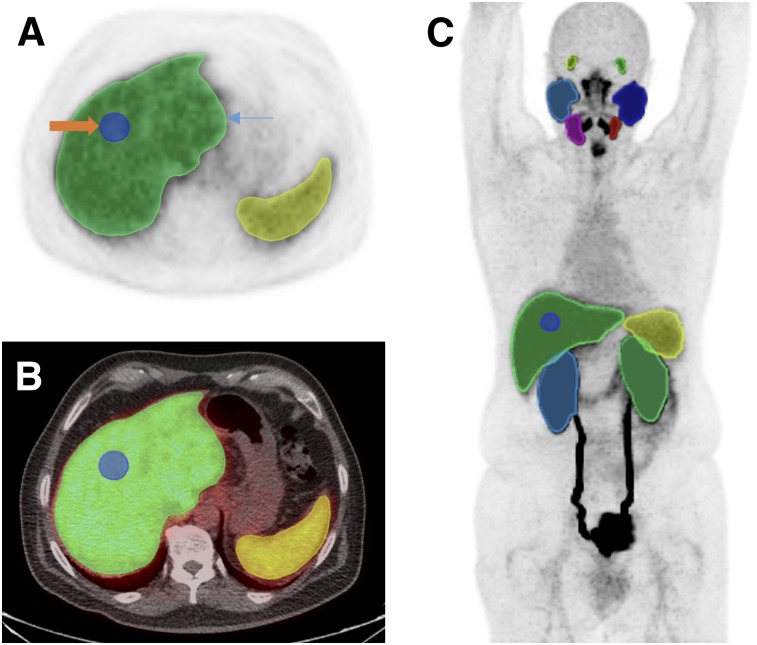
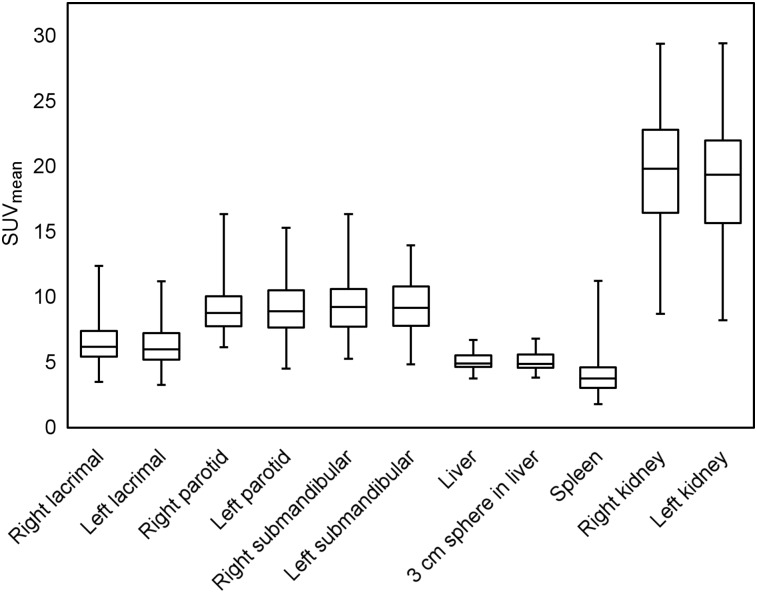
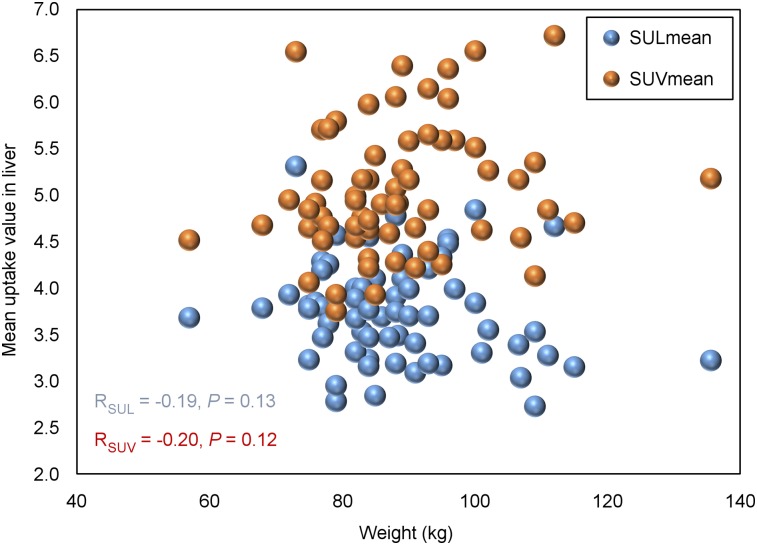
18F-DCFPyL is a small-molecule inhibitor of the prostate-specific membrane antigen that has shown promise for evaluation of primary and metastatic prostate cancer using PET. Measuring the variability in normal-organ uptake of 18F-DCFPyL is necessary to understand its biodistribution, aid image interpretation, judge the reliability of scan quantification, and provide a basis for therapeutic monitoring. Methods: Sixty-five consecutive 18F-DCFPyL PET/CT scans from 64 patients with a history of prostate cancer were analyzed. Volumes of interest were defined for the lacrimal glands, major salivary glands, liver, spleen, and both kidneys. The mean SUV normalized to body mass or to lean body mass (SUL) was calculated for each volume of interest. The average SUV across all scans, the SD, and the coefficient of variation (COV) for each organ were calculated. The same parameters were also derived for a 3-cm sphere drawn in the center of the right lobe of the liver. Results: The average SUVmean for all selected organs measured was 6.6 ± 1.8 for the right lacrimal gland, 6.4 ± 1.8 for the left lacrimal gland, 9.1 ± 2.0 for the right parotid gland, 9.0 ± 2.1 for the left parotid gland, 9.6 ± 2.3 for the right submandibular gland, 9.4 ± 2.2 for the left submandibular gland, 5.0 ± 0.7 for the whole liver, 5.1 ± 0.7 for a 3-cm sphere in the liver, 4.0 ± 1.5 for the spleen, 20.1 ± 4.6 for the right kidney, and 19.4 ± 4.5 for the left kidney. SULmean was lower overall, although demonstrating similar trends. The COV of SUVmean and SULmean was lower in the liver (13.8% and 14.5%, respectively) than in any other organ and was less than the comparable COV for 18F-FDG PET. The COV of SUVmean and SULmean in the 3-cm sphere in the liver was also low and similar to the variability in the whole liver (14.2% and 14.7%, respectively). Conclusion:18F-DCFPyL uptake in normal liver demonstrates less variability than in other 18F-DCFPyL-avid organs, and its variability is less than the reported variability of 18F-FDG in liver. Variability was slightly less for SUVmean than for SULmean, suggesting that SUVmean may be the preferable parameter for quantification of images obtained with 18F-DCFPyL.
Keywords: SUV; molecular imaging; positron emission tomography; prostate cancer; prostate-specific membrane antigen.
© 2017 by the Society of Nuclear Medicine and Molecular Imaging.
Figures
References
-
- Perner S, Hofer MD, Kim R, et al. Prostate-specific membrane antigen expression as a predictor of prostate cancer progression. Hum Pathol. 2007;38:696–701. - PubMed
-
- Haberkorn U, Eder M, Kopka K, et al. New strategies in prostate cancer: prostate-specific membrane antigen (PSMA) ligands for diagnosis and therapy. Clin Cancer Res. 2016;22:9–15. - PubMed
-
- Silver DA, Pellicer I, Fair WR, et al. Prostate-specific membrane antigen expression in normal and malignant human tissues. Clin Cancer Res. 1997;3:81–85. - PubMed
-
- Afshar-Oromieh A, Malcher A, Eder M, et al. PET imaging with a [68Ga]gallium-labelled PSMA ligand for the diagnosis of prostate cancer: biodistribution in humans and first evaluation of tumour lesions. Eur J Nucl Med Mol Imaging. 2013;40:486–495. - PubMed
-
- Eiber M, Maurer T, Souvatzoglou M, et al. Evaluation of hybrid 68Ga-PSMA ligand PET/CT in 248 patients with biochemical recurrence after radical prostatectomy. J Nucl Med. 2015;56:668–674. - PubMed
Publication types
MeSH terms
Substances
Grants and funding
LinkOut - more resources
Full Text Sources
Other Literature Sources
Medical
Miscellaneous