. 2017 Jun;133(6):955-966.
doi: 10.1007/s00401-016-1652-z. Epub 2016 Dec 8.

Genome-wide, high-content siRNA screening identifies the Alzheimer's genetic risk factor FERMT2 as a major modulator of APP metabolism

Affiliations

Genome-wide, high-content siRNA screening identifies the Alzheimer's genetic risk factor FERMT2 as a major modulator of APP metabolism

Julien Chapuis et al. Acta Neuropathol. 2017 Jun.

Abstract

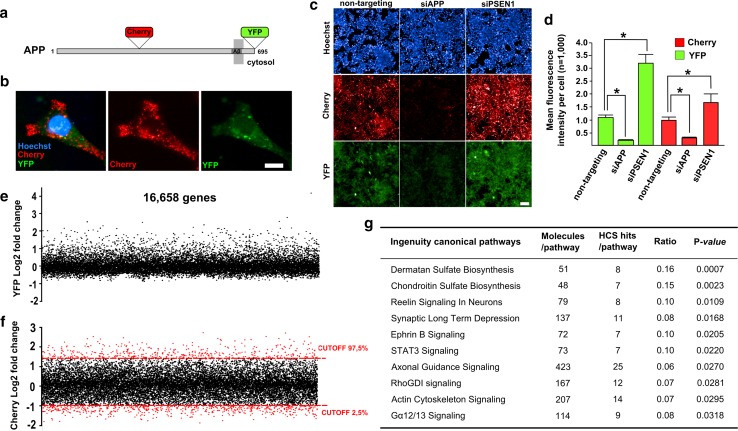
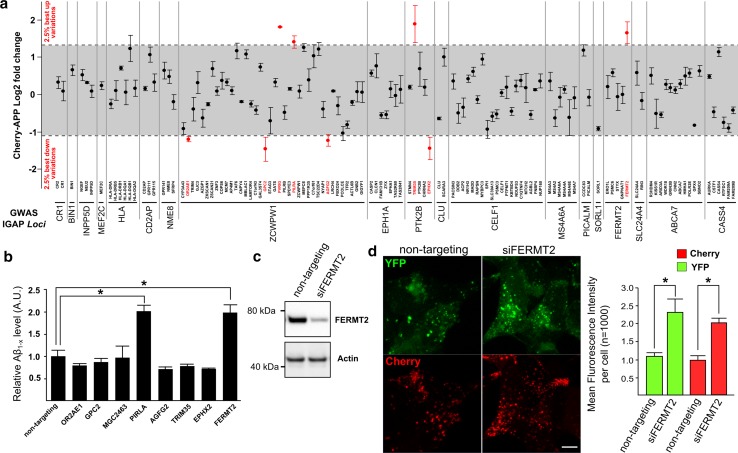
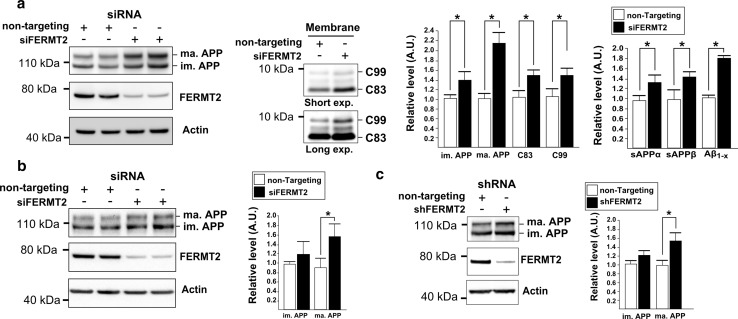
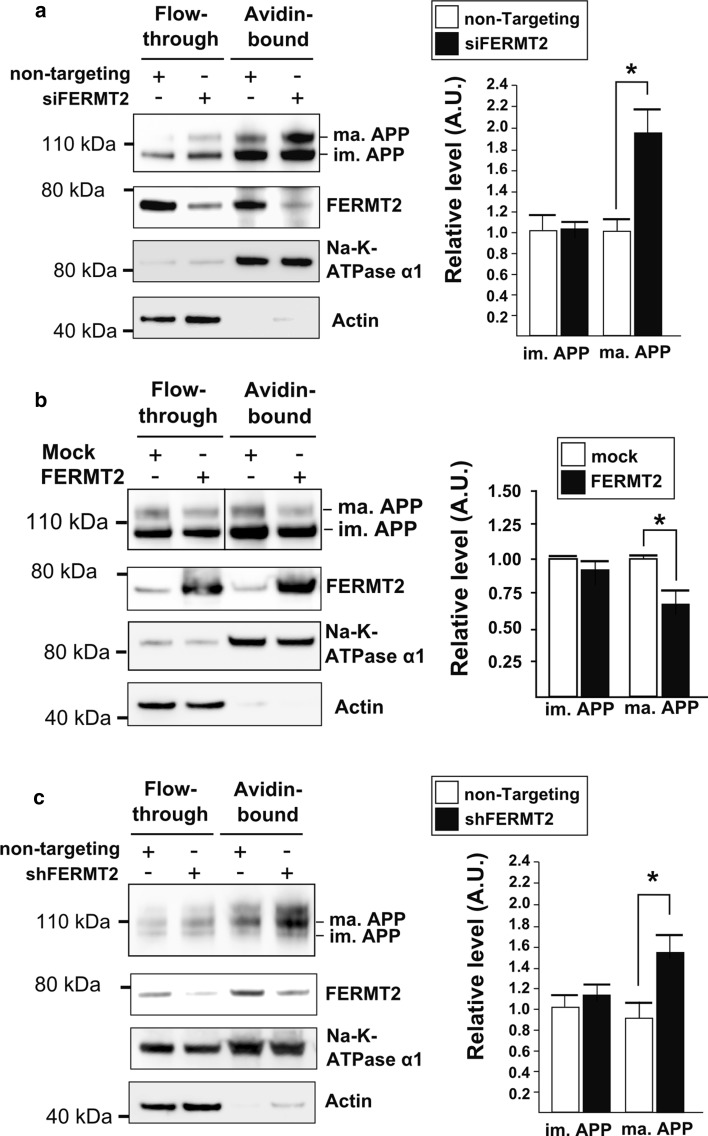
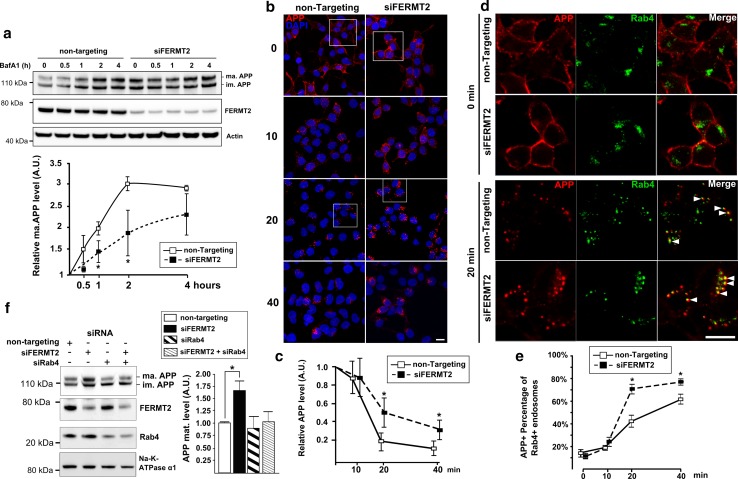
Genome-wide association studies (GWASs) have identified 19 susceptibility loci for Alzheimer's disease (AD). However, understanding how these genes are involved in the pathophysiology of AD is one of the main challenges of the "post-GWAS" era. At least 123 genes are located within the 19 susceptibility loci; hence, a conventional approach (studying the genes one by one) would not be time- and cost-effective. We therefore developed a genome-wide, high-content siRNA screening approach and used it to assess the functional impact of gene under-expression on APP metabolism. We found that 832 genes modulated APP metabolism. Eight of these genes were located within AD susceptibility loci. Only FERMT2 (a β3-integrin co-activator) was also significantly associated with a variation in cerebrospinal fluid Aβ peptide levels in 2886 AD cases. Lastly, we showed that the under-expression of FERMT2 increases Aβ peptide production by raising levels of mature APP at the cell surface and facilitating its recycling. Taken as a whole, our data suggest that FERMT2 modulates the AD risk by regulating APP metabolism and Aβ peptide production.


Conflict of interest statement

TM was a PhD student paid by SANOFI through a CIFRE contract.

Figures

Fig. 1
Fig. 1
Genome-wide high-content siRNA screening identifies modulators of APP metabolism. a Schematic representation of APP, showing the point in the sequence at which the fluorescent proteins (cherry and YFP) were inserted. b Representative fluorescence microscopy images, showing HEK293 cells transfected with double-tagged APP (cherry-APP-YFP) and stained with Hoechst reagent. Scale bar 10 µm. c Representative fluorescence microscopy images showing the impact of siRNA transfection (non-targeting, siAPP or siPSEN1) on the mCherry and YFP intensities. Scale bar 100 µm. d Quantification of the relative mean fluorescence intensity of mCherry and YFP signals per cell after siRNA transfection. Histograms indicate the mean ± SD values. *p < 0.05, non-parametric test. e Mean fluorescence intensity variations (log2 fold-change) of the YFP signal obtained after genome-wide siRNA screening in triplicate. f Mean fluorescence intensity variations (log2 fold-change) of the mCherry signal obtained after genome-wide siRNA screening in triplicate. The mCherry signal was used to determine the 5% hits exhibiting the strongest variations (in red; 2.5% showing an upregulation and 2.5% showing a downregulation). g The best 10 canonical-pathways identified after pathway enrichment analysis using IPA
Fig. 2
Fig. 2
Cross-correlations between HCS and GWAS data. a Mean variations in mCherry fluorescence intensity after the silencing of genes associated with the AD risk in the IGAP’s meta-analysis. Eight genes (in red) were included in the best 5% variations, based on the HCS data. b Impact of the silencing of the 8 hits on the Aβ1-X secretion level in the medium of the HEK293-mCherry-APP-YFP cell line. Histograms indicate mean ± SD. *p < 0.05, non-parametric test. c Validation of FERMT2 silencing after transfection with the siRNA-FERMT2 SMARTpool used in HCS. d Representative fluorescence microscopy images and quantification showing the impact of FERMT2 silencing on mCherry and YFP intensity based on HCS data. Scale bar 10 µm
Fig. 3
Fig. 3
Characterization of the impact of FERMT2 on APP metabolism. a Impact of FERMT2 silencing on APP metabolism in the HEK293-APP695WT cell line. Cells transiently transfected with siFERMT2 or non-targeting siRNA were analyzed by WB using anti-APP C-terminal, anti-FERMT2 or anti-actin antibodies. sAPPα, sAPPβ and Aβ1-X secreted into conditioned medium were assayed using an AlphaLISA. ma. APP, mature APP; im. APP, immature APP. Densitometric analyses and WB quantifications from three independent experiments are shown. Histograms indicate the mean ± SD. a.u., arbitrary units. *p < 0.05, non-parametric test. b Impact of FERMT2 silencing on the mature APP levels in HEK293 cells endogenously expressing APP. c Quantification of mature and immature APP levels after lentiviral transduction with shRNA against FERMT2 in a primary neuronal culture endogenously expressing APP
Fig. 4
Fig. 4
FERMT2 expression controls the cell surface level of mature APP. a Cell-surface-biotinylated proteins from HEK293-APP695WT cells transiently transfected with siFERMT2 or non-targeting siRNA. Cell extracts were precipitated with immobilized avidin and analyzed by WB using antibodies against APP, FERMT2, actin (an intracellular marker), and Na–K-ATPase α1 (a cell surface marker). ma. APP, mature APP; im. APP, immature APP. Densitometric analyses and WB quantifications from three independent experiments are shown. Histograms indicate the mean ± SD. a.u., arbitrary units. *p < 0.05, non-parametric test. b Cell-surface-biotinylated proteins from HEK293-APP695WT cells transiently transfected with FERMT2 cDNA or empty vector (Mock). c Cell-surface-biotinylated proteins from primary neuronal culture after lentiviral transduction with shRNA against FERMT2 or non-targeting shRNA
Fig. 5
Fig. 5
FERMT2 silencing inhibits APP degradation and promotes APP recycling at the plasma membrane. a HEK293-APP695WT cells transiently transfected with siFERMT2 or non-targeting siRNA were treated with bafilomycin A1 (BafA1, 50 nM) for the indicated times. Cell extracts were then analyzed by WB. Densitometric analyses and mature APP levels for three independent experiments are shown. Graphs indicate the mean ± SD. *p < 0.05, non-parametric test. b The time course of APP endocytosis and degradation was indirectly visualized by internalization of 6E10 antibody. Cells were incubated with 6E10 antibody at 4 °C for 1 h. The temperature was then shifted to 37 °C, and cells were processed for immunofluorescence at the indicated times. Scale bar 10 µm. c Relative fluorescence intensity from 6E10 staining, showing the time course of APP degradation. d A zoom-in (the square in b) for the indicated times (0 and 20 min at 37 °C). Co-staining with anti-Rab4 antibody was used to visualize the APP within Rab4-positive endosomes involving in recycling. e Co-localization of 6E10 staining with Rab4 staining, as a guide to the APP level within recycling endosomes at the indicated times. f Cells transiently transfected with anti-FERMT2 in the presence or absence of siRab4. Extracts were analyzed by WB using anti-APP C-terminal, anti-FERMT2, anti-Rab4 or anti-actin antibodies

Similar articles

Cited by

  • Genetic meta-analysis of diagnosed Alzheimer's disease identifies new risk loci and implicates Aβ, tau, immunity and lipid processing.
    Kunkle BW, Grenier-Boley B, Sims R, Bis JC, Damotte V, Naj AC, Boland A, Vronskaya M, van der Lee SJ, Amlie-Wolf A, Bellenguez C, Frizatti A, Chouraki V, Martin ER, Sleegers K, Badarinarayan N, Jakobsdottir J, Hamilton-Nelson KL, Moreno-Grau S, Olaso R, Raybould R, Chen Y, Kuzma AB, Hiltunen M, Morgan T, Ahmad S, Vardarajan BN, Epelbaum J, Hoffmann P, Boada M, Beecham GW, Garnier JG, Harold D, Fitzpatrick AL, Valladares O, Moutet ML, Gerrish A, Smith AV, Qu L, Bacq D, Denning N, Jian X, Zhao Y, Del Zompo M, Fox NC, Choi SH, Mateo I, Hughes JT, Adams HH, Malamon J, Sanchez-Garcia F, Patel Y, Brody JA, Dombroski BA, Naranjo MCD, Daniilidou M, Eiriksdottir G, Mukherjee S, Wallon D, Uphill J, Aspelund T, Cantwell LB, Garzia F, Galimberti D, Hofer E, Butkiewicz M, Fin B, Scarpini E, Sarnowski C, Bush WS, Meslage S, Kornhuber J, White CC, Song Y, Barber RC, Engelborghs S, Sordon S, Voijnovic D, Adams PM, Vandenberghe R, Mayhaus M, Cupples LA, Albert MS, De Deyn PP, Gu W, Himali JJ, Beekly D, Squassina A, Hartmann AM, Orellana A, Blacker D, Rodriguez-Rodriguez E, Lovestone S, Garcia ME, Doody RS, Munoz-Fernadez C, Sussams R, Lin H, Fairchild TJ, Benito YA, Holmes C, Karamujić-Čomić H, Fr… See abstract for full author list ➔ Kunkle BW, et al. Nat Genet. 2019 Mar;51(3):414-430. doi: 10.1038/s41588-019-0358-2. Epub 2019 Feb 28. Nat Genet. 2019. PMID: 30820047 Free PMC article.
  • Integrating amyloid and tau imaging with proteomics and genomics in Alzheimer's disease.
    Vilkaite G, Vogel J, Mattsson-Carlgren N. Vilkaite G, et al. Cell Rep Med. 2024 Sep 17;5(9):101735. doi: 10.1016/j.xcrm.2024.101735. Cell Rep Med. 2024. PMID: 39293391 Free PMC article. Review.
  • Regulation of the hippocampal translatome by Apoer2-ICD release.
    Wasser CR, Werthmann GC, Hall EM, Kuhbandner K, Wong CH, Durakoglugil MS, Herz J. Wasser CR, et al. Mol Neurodegener. 2023 Sep 19;18(1):62. doi: 10.1186/s13024-023-00652-1. Mol Neurodegener. 2023. PMID: 37726747 Free PMC article.
  • Pyk2 overexpression in postsynaptic neurons blocks amyloid β1-42-induced synaptotoxicity in microfluidic co-cultures.
    Kilinc D, Vreulx AC, Mendes T, Flaig A, Marques-Coelho D, Verschoore M, Demiautte F, Amouyel P; Neuro-CEB Brain Bank; Eysert F, Dourlen P, Chapuis J, Costa MR, Malmanche N, Checler F, Lambert JC. Kilinc D, et al. Brain Commun. 2020 Aug 28;2(2):fcaa139. doi: 10.1093/braincomms/fcaa139. eCollection 2020. Brain Commun. 2020. PMID: 33718872 Free PMC article.
  • Sex-dependent autosomal effects on clinical progression of Alzheimer's disease.
    Fan CC, Banks SJ, Thompson WK, Chen CH, McEvoy LK, Tan CH, Kukull W, Bennett DA, Farrer LA, Mayeux R, Schellenberg GD, Andreassen OA, Desikan R, Dale AM. Fan CC, et al. Brain. 2020 Jul 1;143(7):2272-2280. doi: 10.1093/brain/awaa164. Brain. 2020. PMID: 32591829 Free PMC article.

References

    1. Baranger K, Marchalant Y, Bonnet AE, Crouzin N, Carrete A, Paumier J-M, et al. MT5-MMP is a new pro-amyloidogenic proteinase that promotes amyloid pathology and cognitive decline in a transgenic mouse model of Alzheimer’s disease. Cell Mol Life Sci. 2016;73:217–236. doi: 10.1007/s00018-015-1992-1. - DOI - PMC - PubMed
    1. Bray M-A, Carpenter A, Imaging Platform BI of M and H (2013) Advanced assay development guidelines for image-based high content screening and analysis. Eli Lilly & Company and the National Center for Advancing Translational Sciences - PubMed
    1. Camargo LM, Zhang XD, Loerch P, Caceres RM, Marine SD, Uva P, et al. Pathway-based analysis of genome-wide siRNA screens reveals the regulatory landscape of App processing. PLoS One. 2015;10:e0115369. doi: 10.1371/journal.pone.0115369. - DOI - PMC - PubMed
    1. Caswell PT, Vadrevu S, Norman JC. Integrins: masters and slaves of endocytic transport. Nat Rev Mol Cell Biol. 2009;10:843–853. doi: 10.1038/nrm2799. - DOI - PubMed
    1. Chapuis J, Vingtdeux V, Campagne F, Davies P, Marambaud P. Growth arrest-specific 1 binds to and controls the maturation and processing of the amyloid-beta precursor protein. Hum Mol Genet. 2011;20:2026–2036. doi: 10.1093/hmg/ddr085. - DOI - PMC - PubMed

Publication types

MeSH terms

LinkOut - more resources