. 2016 Nov 16;138(45):14931-14940.
doi: 10.1021/jacs.6b07584. Epub 2016 Nov 8.

Development of Correlative Cryo-soft X-ray Tomography and Stochastic Reconstruction Microscopy. A Study of Cholesterol Crystal Early Formation in Cells

Affiliations

Development of Correlative Cryo-soft X-ray Tomography and Stochastic Reconstruction Microscopy. A Study of Cholesterol Crystal Early Formation in Cells

Neta Varsano et al. J Am Chem Soc. .

Abstract

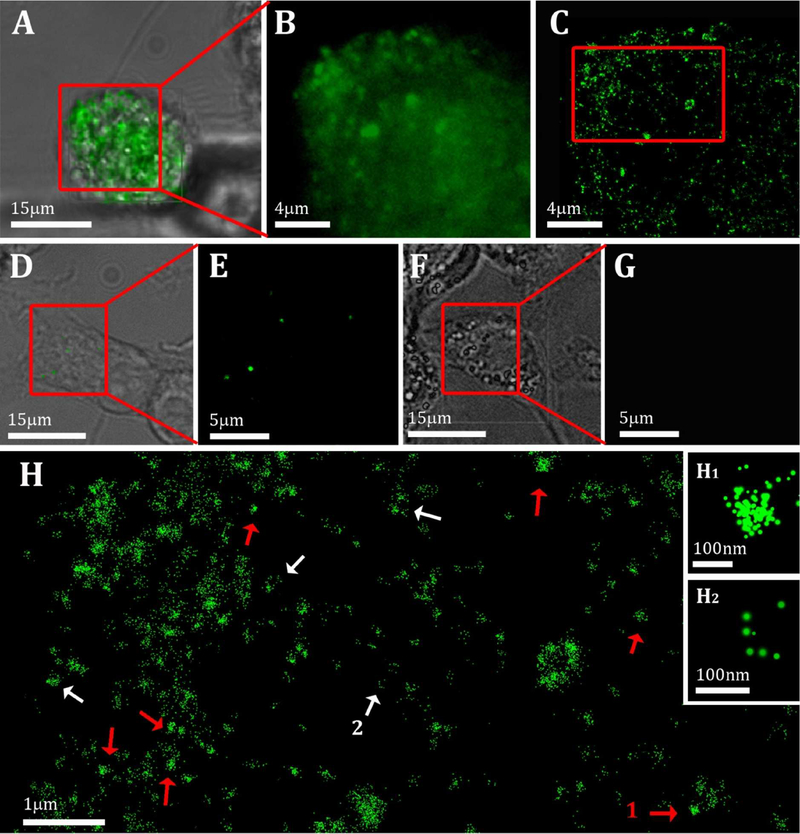
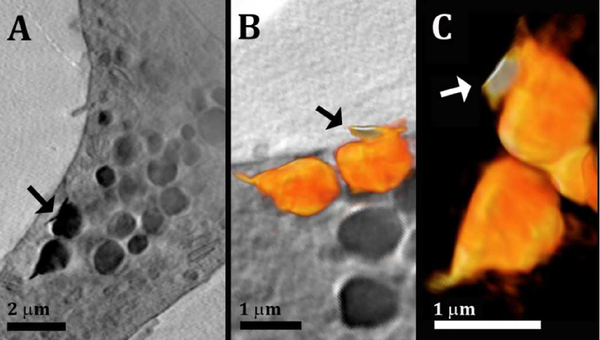
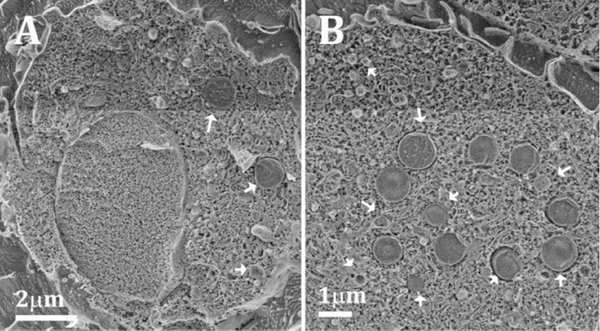
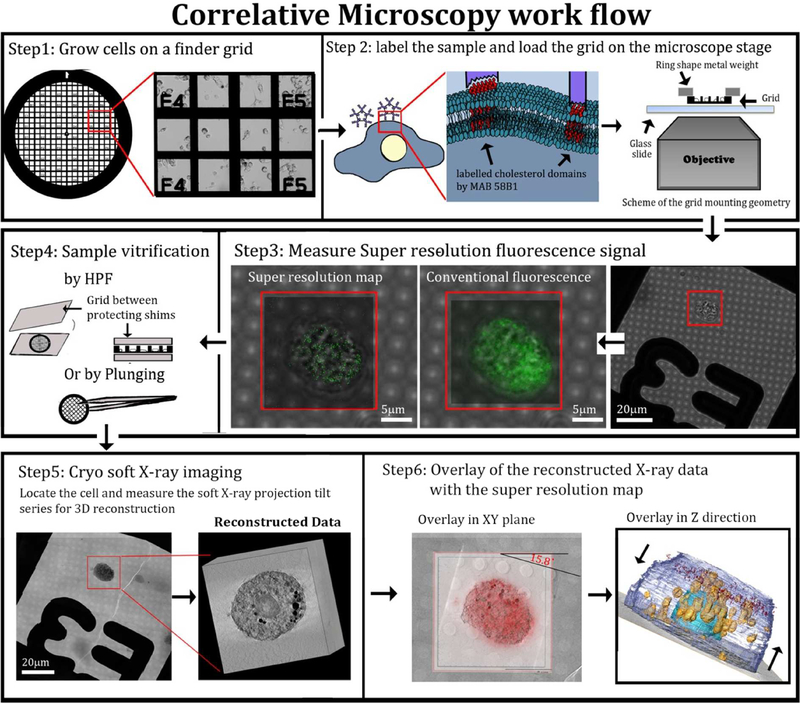
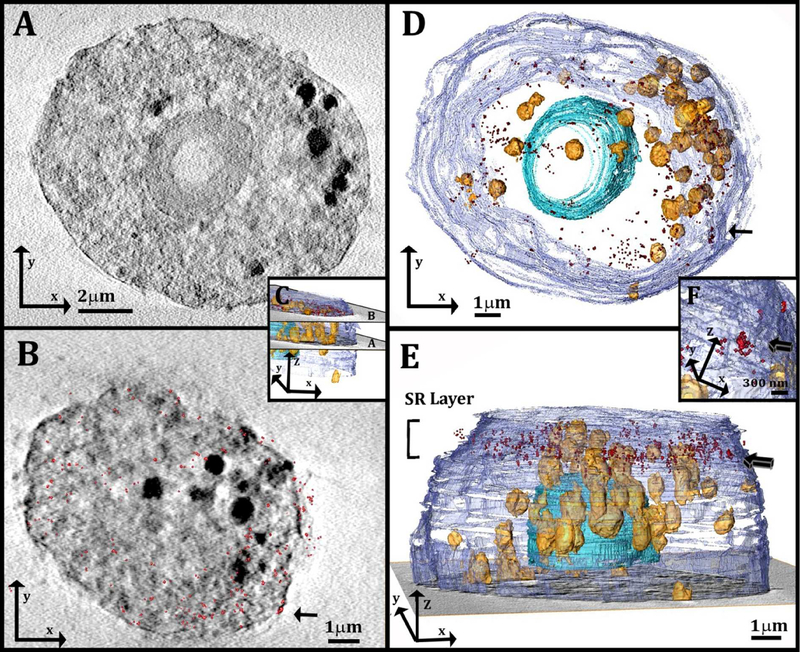
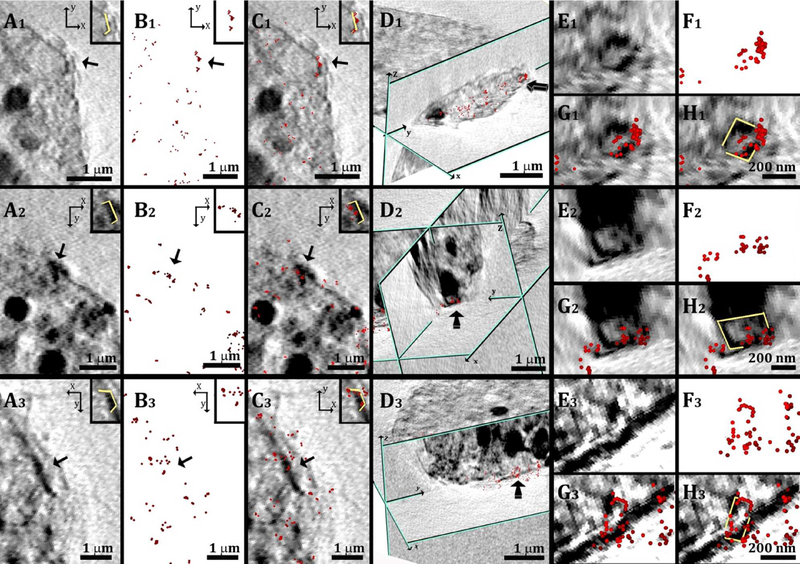
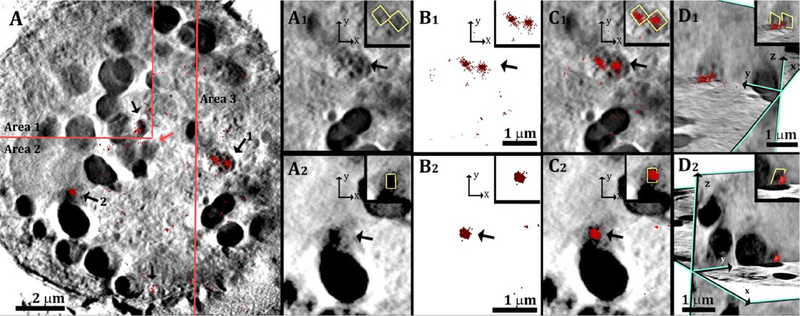
We have developed a high resolution correlative method involving cryo-soft X-ray tomography (cryo-SXT) and stochastic optical reconstruction microscopy (STORM), which provides information in three dimensions on large cellular volumes at 70 nm resolution. Cryo-SXT morphologically identified and localized aggregations of carbon-rich materials. STORM identified specific markers on the desired epitopes, enabling colocalization between the identified objects, in this case cholesterol crystals, and the cellular environment. The samples were studied under ambient and cryogenic conditions without dehydration or heavy metal staining. The early events of cholesterol crystal development were investigated in relation to atherosclerosis, using as model macrophage cell cultures enriched with LDL particles. Atherosclerotic plaques build up in arteries in a slow process involving cholesterol crystal accumulation. Cholesterol crystal deposition is a crucial stage in the pathological cascade. Our results show that cholesterol crystals can be identified and imaged at a very early stage on the cell plasma membrane and in intracellular locations. This technique can in principle be applied to other biological samples where specific molecular identification is required in conjunction with high resolution 3D-imaging.


Conflict of interest statement

The authors declare no competing financial interest.

Figures

Figure 1:
Figure 1:
(A, D, F): Bright field images of cells after 48 h incubation with (A, F) or without (D) 50 μg/ml acLDL, overlaid with the conventional fluorescence data. Cells were fixed and incubated with (A-E) or without (F, G) 3 μg/ml 58B1 antibody that specifically recognizes 2D and 3D cholesterol crystals (Green) (B, E, G,): A magnified area of the fluorescence data from (A), (D) and (F), respectively. (C): Localization map of the resolved super-resolution image of (B). (H): Magnified area from (C) (red rectangle). Small (~100 nm) densely labelled aggregates (red arrows) and features labeled mainly on the edges (white arrows,) are detected. This labeling may be an indication for the presence of 3D crystals in the cell area. Inset H1 and H2 show magnifications of the putative crystals indicated by 1 and 2 in H. The point size is presented in localization precision, i.e. a label with smaller diameter corresponds to a higher precision in the localization of the signal.
Figure 2:
Figure 2:
(A): Slice through a 3D reconstruction of soft X-ray tomogram of a macrophage cell after incubation with acLDL. (A): High contrast sharp feature (arrow) attached to lipid-rich objects inside the cell. (B, C): Volume rendering (orange color-map) of organelles found in the volume of the cell presented in (A). The volume rendering in (B) is overlaid on a slice of the reconstructed data. The sharp feature attached (arrow) has slightly higher contrast than the lipid objects, seen from the orange color gradient: Bright white= high contrast (higher X-ray absorbance) and dark orange = lower contrast (less X-ray absorbance).
Figure 3:
Figure 3:
(A, B): Cryo SEM micrographs of high pressure frozen and freeze fractured macrophage cells after 48 h incubation with 50 μg/ml acLDL. The samples were etched for 5–20 min at −105°C in order to expose the outer surface features and enhance the contrast between the cytoplasm and the unetched lipid objects. The cells are filled with objects (indicated by arrows) that have the typical texture of lipid-rich particles, most probably lysosomes and/or lipid droplets.
Figure 4:
Figure 4:
Correlative microscopy flow-chart. Step1: Cells were grown on gold finder grids with fiducial markers that allow navigation to desired locations on the grid. The cells were incubated for 48 h with acLDL. Step2: Cells were fixed (4 % PFA, 0.1% GTA, see methods) and incubated with primary and secondary antibodies. Step 3: super-resolution fluorescence signal was resolved by STORM. Step4: Grids were high pressure frozen. Step5: X-ray tomograms were taken of the same cells that were analyzed by STORM. Data were reconstructed (field of view 15 μm3). Step6: Overlay of the data was done manually using the grid mesh as fiducial markers for the xy plane. For the z plane, each of the X-ray and fluorescence volume stacks was divided into layers of 80 nm and overlaid (see experimental section).
Figure 5:
Figure 5:
(A, B): Slices through the 3D reconstruction of a soft X-ray tomogram of a cell after incubation with acLDL. The localization map of the resolved super-resolution image (red spots, 180 nm in depth) is superimposed on the corresponding X-ray data slice in (B). (C): 3D reconstruction of the cell in A, B, showing the location of the slices in (A) and (B): The slice in (A) comes from the middle part of the cell and the slice in (B) comes from the upper part of the cell, where STORM was performed. (D, E): 3D reconstruction of the same cell from a top view (D) and a side view (E). The localization map of the corresponding resolved super-resolution image (red spots) is 1μm in thickness and is located on the upper part of the cell, above the nucleus. Arrow indicates cluster of STORM signals that is magnified in (F). (F): High magnification of a well-defined cluster of the STORM signal (arrow). The cluster was detected on the plasma membrane envelope, and is presented also in (B) and (D) from different orientations (arrows). Segmentation based on contrast was used for the 3D reconstruction. The different features are described using arbitrary colors: plasma membrane (purple) lipid objects (yellow-orange) and cell nucleus (blue).
Figure 6:
Figure 6:
(A1, A2, A3): Parts of slices through the 3D reconstruction of a cell tomogram, taken after incubation with AcLDL; top views (xy plane). High contrast sharp features (arrows) appear on the cell plasma membrane. (B1, B2, B3): Localization map of the corresponding resolved super-resolution image (red spots). (C1, C2, C3): Superimposition of the X-ray data in A1 A2 A3 with the super-resolution fluorescence data in B1, B2, B3. The inset in each reconstructed picture shows the high contrast feature marked in yellow for clearer visualization. (D1, D2, D3): side orientation of the superimposed data presented in (C1, C2, C3) combined with a perpendicular slice (zy plane, profiled in green); in D2 a slice in the zx plane was also introduced. The arrows point to the same labeled features presented in the corresponding top view. (E1, E2, E3): Magnified areas of the labelled features presented in the corresponding views in (D1, D2, D3). (F1, F2, F3): Corresponding super resolution fluorescence data. (G1, G2, G3): Superimposition of the X-ray data in E1, E2, E3 with the super-resolution fluorescence data in F1, F2, F3. (H1, H2, H3): the profiles of the high contrast features in (G1, G2, G3) are marked in yellow for easier visualization. This was done manually, based on the contrast.
Figure 7:
Figure 7:
(A) Slices through the 3D reconstruction of a soft X-ray tomogram of a cell after incubation with acLDL. The cell slice is a mosaic composed of area 1, area 2 and area 3 that were taken at different z inside the cell, to match the locations of the labelled features (arrows). The localization map of the resolved super-resolution image (red spots 360 nm in depth) is superimposed on the corresponding X-ray data slice. (A1, A2): Magnified areas of two features labelled 1, 2, respectively, inside the cell from a top view (xy plane). (B1, B2): Corresponding super resolution fluorescence data. (C1, C2): Superimposition of the X-ray data in A1, A2 with the super-resolution fluorescence data in B1, B2. (D1,D2): Side orientations of the superimposed data presented in C1, C2, combined with perpendicular slices in the zy plane. The inset in each reconstructed picture show the high contrast feature marked in yellow for clearer visualization. This was done manually, based on the contrast the feature. The inset in D2 is enlarged by 30%.

References

    1. Insull W Jr; Bartsch GJ Clin. Invest 1966, 45, 513. - PMC - PubMed
    1. Kruth HS Am J Pathol 1984, 114, 201. - PMC - PubMed
    1. Katz S; Shipley GG; Small DJ Clin. Invest 1976, 58, 200. - PMC - PubMed
    1. Kruth HS Curr. Mol. Med 2001, 1, 633. - PubMed
    1. Tabas I; Rosoff W; Boykow GJ Biol. Chem 1988, 263, 1266. - PubMed

Publication types