. 2016 Dec;26(12):1627-1638.
doi: 10.1101/gr.209759.116. Epub 2016 Oct 19.

High-throughput allele-specific expression across 250 environmental conditions

Affiliations

High-throughput allele-specific expression across 250 environmental conditions

Gregory A Moyerbrailean et al. Genome Res. 2016 Dec.

Abstract

Gene-by-environment (GxE) interactions determine common disease risk factors and biomedically relevant complex traits. However, quantifying how the environment modulates genetic effects on human quantitative phenotypes presents unique challenges. Environmental covariates are complex and difficult to measure and control at the organismal level, as found in GWAS and epidemiological studies. An alternative approach focuses on the cellular environment using in vitro treatments as a proxy for the organismal environment. These cellular environments simplify the organism-level environmental exposures to provide a tractable influence on subcellular phenotypes, such as gene expression. Expression quantitative trait loci (eQTL) mapping studies identified GxE interactions in response to drug treatment and pathogen exposure. However, eQTL mapping approaches are infeasible for large-scale analysis of multiple cellular environments. Recently, allele-specific expression (ASE) analysis emerged as a powerful tool to identify GxE interactions in gene expression patterns by exploiting naturally occurring environmental exposures. Here we characterized genetic effects on the transcriptional response to 50 treatments in five cell types. We discovered 1455 genes with ASE (FDR < 10%) and 215 genes with GxE interactions. We demonstrated a major role for GxE interactions in complex traits. Genes with a transcriptional response to environmental perturbations showed sevenfold higher odds of being found in GWAS. Additionally, 105 genes that indicated GxE interactions (49%) were identified by GWAS as associated with complex traits. Examples include GIPR-caffeine interaction and obesity and include LAMP3-selenium interaction and Parkinson disease. Our results demonstrate that comprehensive catalogs of GxE interactions are indispensable to thoroughly annotate genes and bridge epidemiological and genome-wide association studies.


Figures

Figure 1.
Figure 1.
Overview of gene expression response. (A) Schematic of experimental design and rationale. Our approach uses specific treatment conditions as tightly controlled proxy for the organism environment and measures molecular phenotypes, such as gene expression, to infer genetic and molecular mechanisms for complex traits. (B) Heatmap of differential gene expression. Shown for each cell type (columns) and treatment (rows) combination are the number of differentially expressed genes (10% FDR and |log2FC| > 0.25). The shade of red indicates the number of differentially expressed genes from an initial screening step (see Supplemental Texts 5 and 8.1). Cellular environments with a strong response were further sequenced to a higher depth (>58 M reads, 113 M on average), and the number of differentially expressed genes is indicated by the text. Environments marked with an asterisk were chosen to confirm that treatments with a small response from the shallow sequencing data similarly have a small response when deep sequenced. Colors next to treatment names represent treatments chosen for deep sequencing. Gray indicates treatments that were not deep sequenced. (C) Global coexpression network inferred using weighted gene correlation network analysis (WGCNA) on 14,535 genes. Each dot represents a gene. Each module is assigned a color based on the treatment with the highest eigengene t-value. Note that colors representing treatments are consistently used across all the figures.
Figure 2.
Figure 2.
Heatmap of allele-specific expression (ASE). For each individual (row) and treatment (column) we list the number of SNPs displaying ASE (as determined in QuASAR [quantitative allele-specific analysis of reads] at 10% FDR). The shade of red represents the fraction of ASE SNPs to the number of heterozygous SNPs tested (% ASE SNPs) in a given sample and condition. The dotted line on the density plot indicates the average % ASE SNPs across all individual samples and conditions.
Figure 3.
Figure 3.
Gene–environment interactions. (A,B) Two types of gene–environment interactions: conditional ASE (A) and induced ASE (B). Treatment conditions are in red and control conditions in blue, with the shade (dark/light) representing the allele (reference/alternate). In this example of cASE, there is an imbalance of expression between the two alleles in the treatment condition, while the control shows balanced expression. iASE is defined by an imbalance of expression between the two alleles in the treatment condition and by expression below detectable levels (dotted line) in the control condition. (C) Plot of all iASE SNPs detected. Each iASE SNP is represented as two points (representing treatment and control expression) connected by a line (representing the fold-change between conditions). SNPs are plotted based on the expression (TPM [tags per million]) of each allele, with the higher expressed allele in the treatment on the y-axis and the lower allele on the x-axis. Points are colored by treatment (controls are black and gray), and the dotted lines represent constant expression levels 0.1, 1, and 10. For ease of display, expression of SNPs <0.01 have been set to 0.01. (D) Scatter plot of the Z-scores in the paired treatment and control samples for all SNPs tested for cASE. Colored points indicate those displaying cASE: Red is SNPs identified by meta-analysis of subgroup heterogeneity (MeSH) as having cASE in the treatment, blue is SNPs identified by MeSH as having cASE in the control, and green is SNPs identified by ΔAST (differential allele-specific test) that were not identified by MeSH. (E) QQ-plot of P-values for cASE identified with the ΔAST method for treatment versus control (green line) and Control 1 versus Control 2 (gray line). (F) Venn diagrams showing the number of cASE SNPs identified by two methods: MeSH and ΔAST at different empirically estimated FDR thresholds.
Figure 4.
Figure 4.
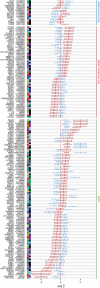
Forest plot of all cASE SNPs. Each row shows the ASE β^ for paired treatment (red) and control (blue) conditions. Defined as in Figure 2, colored squares indicate the treatment (left) and cell type (right) in which cASE was identified, along with the gene name and SNP rsID.
Figure 5.
Figure 5.
Features of cASE SNPs. (A,B) Scatter plot comparing the absolute difference in ASE β^ between treatment and control (y-axis) and the average log2 (expression; A) or log2 (fold change; B) between treatment and control samples for cASE SNPs. The green line indicates the trendline from a linear model fit on the points. (C,D) Percentage of cASE SNPs identified in each treatment category (C) or treatment (D). For each group, plotted is the percentage of cASE SNPs identified, relative to the number of SNPs tested for that group. The dotted black line represents the average percentage of cASE SNPs across all groups. Groups with an asterisk are significantly enriched or depleted (binomial P-value <0.05) relative to the average. The colors in C represent the relative proportion of cASE SNPs for each treatment in a treatment category.
Figure 6.
Figure 6.
Integration with GWAS. (A) Hypothetical model detailing the use of GxE interactions to characterize putative molecular mechanisms for risk or protective environmental factors for complex traits. In the treatment environment, a regulatory region is either active or inactive depending on the haplotype, therefore resulting in different levels of gene expression. In the control environment, the regulatory region is inactive regardless of haplotype. Risk and protective haplotypes are identified in GWAS. (B) Enrichment analysis of GWAS genes. Reported genes from the GWAS catalog (version 1.0.1) were compared to different gene sets analyzed in this study: (1) genes that were not differentially expressed in any condition, (2) genes that were differentially expressed in any condition, (3) genes previously associated with an eQTL in GTEx (eGenes) (The GTEx Consortium 2015), (4) genes containing ASE in any condition, and (5) genes containing either iASE or cASE. The percentage of genes in these data sets that were found in the GWAS catalog is indicated by a darker shade. Genes that can be perturbed by our environments are highlighted in purple and indicate a GxE mechanism for the GWAS association. Odds ratios and enrichment P-values were calculated using a Fisher's exact test and are shown on the right for each pair of gene categories contrasted. (C) Genome-wide efficient mixed model association (GEMMA) per SNP heritability estimates relative to the genomic average for cASE (SNPs in genic regions with cASE or iASE), ASE (SNPs in genic regions with ASE), other genic (SNPs in genic regions), and intergenic (SNPs <100 kb from any gene). Only significant enrichment values are reported, with a darker tone of purple indicating a higher enrichment odds ratio relative to the genome average. (D) Forest plots of four cASE SNPs in genes associated with a GWAS trait. For each SNP, shown is the ASE β^ for each treatment in which the SNP was tested. The 95% CI bars are colored for each treatment as in Figure 2.

References

    1. The 1000 Genomes Project Consortium 2015. A global reference for human genetic variation. Nature 526: 68–74. - PMC - PubMed
    1. Barreiro LB, Tailleux L, Pai AA, Gicquel B, Marioni JC, Gilad Y. 2012. Deciphering the genetic architecture of variation in the immune response to Mycobacterium tuberculosis infection. Proc Natl Acad Sci 109: 1204–1209. - PMC - PubMed
    1. Benjamini Y, Hochberg Y. 1995. Controlling the false discovery rate: a practical and powerful approach to multiple testing. J R Stat Soc 57: 289–300.
    1. Berndt SI, Gustafsson S, Mägi R, Ganna A, Wheeler E, Feitosa MF, Justice AE, Monda KL, Croteau-Chonka DC, Day FR, et al. 2013. Genome-wide meta-analysis identifies 11 new loci for anthropometric traits and provides insights into genetic architecture. Nat Genet 45: 501–512. - PMC - PubMed
    1. Buil A, Brown AA, Lappalainen T, Viñuela A, Davies MN, Zheng H-F, Richards JB, Glass D, Small KS, Durbin R, et al. 2014. Gene-gene and gene-environment interactions detected by transcriptome sequence analysis in twins. Nat Genet 47: 88–91. - PMC - PubMed

Publication types

MeSH terms