. 2016 Dec 9:6:38031.
doi: 10.1038/srep38031.

Functional and structural characterization of a novel putative cysteine protease cell wall-modifying multi-domain enzyme selected from a microbial metagenome

Affiliations

Functional and structural characterization of a novel putative cysteine protease cell wall-modifying multi-domain enzyme selected from a microbial metagenome

Muhammad Faheem et al. Sci Rep. .

Abstract

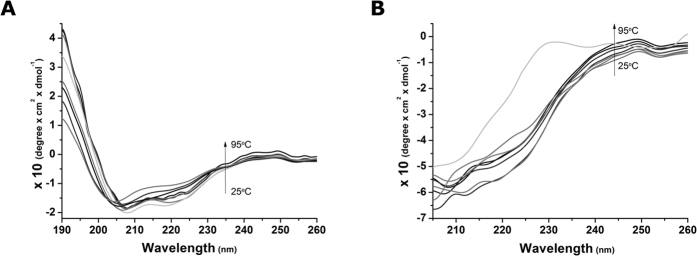
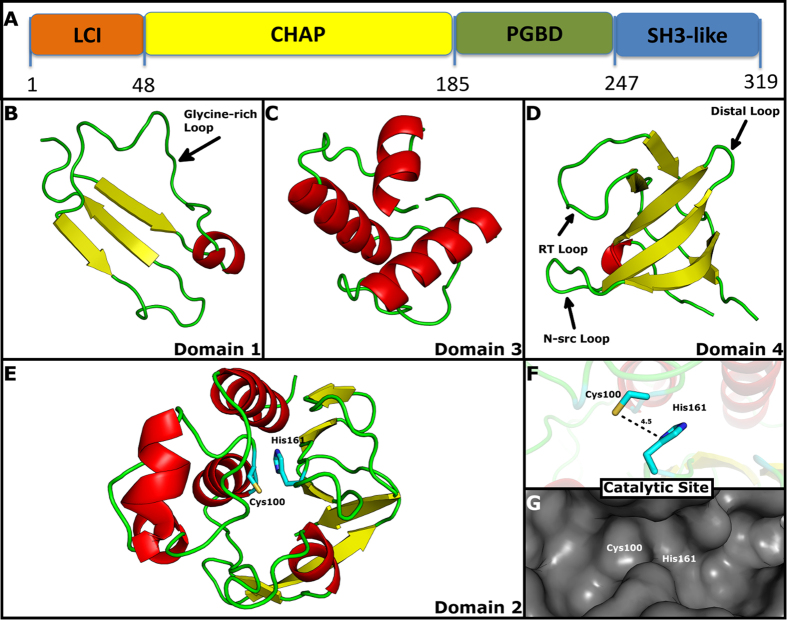
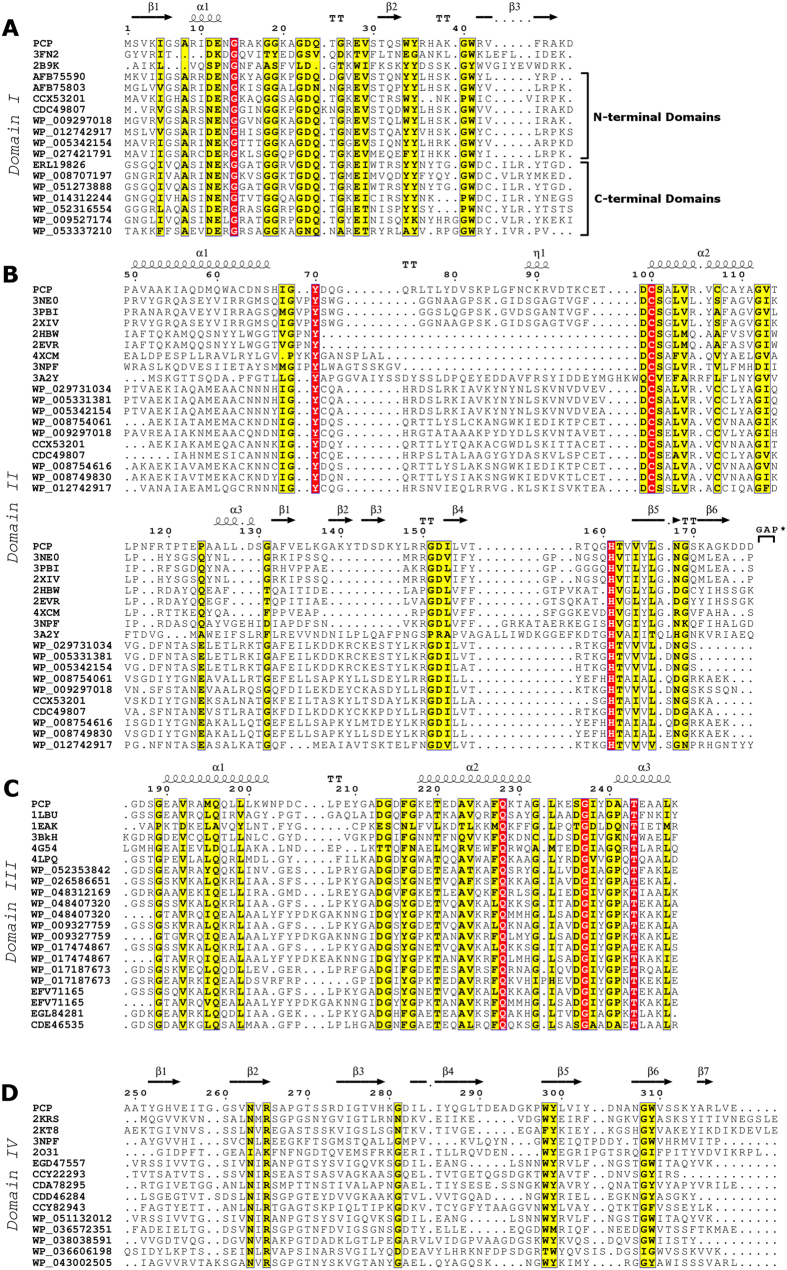
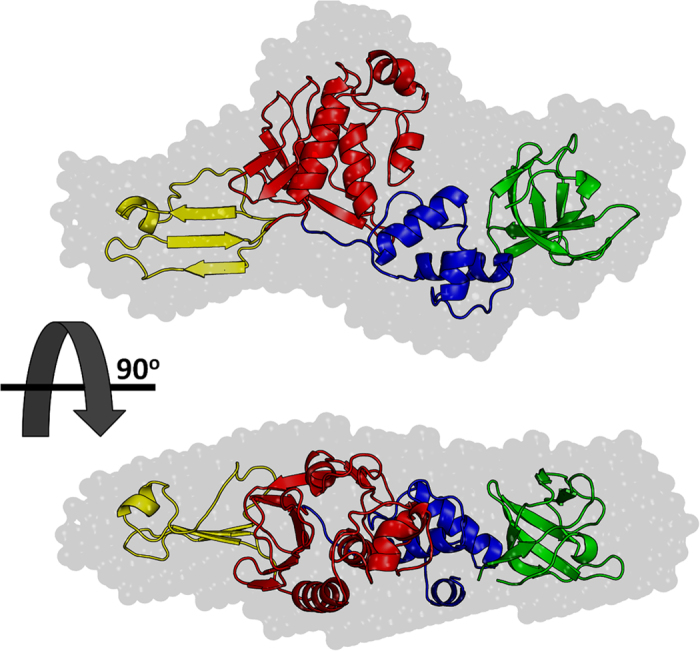
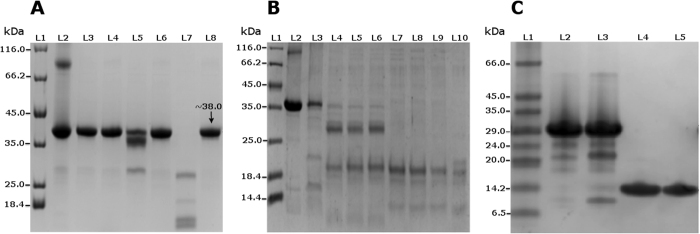
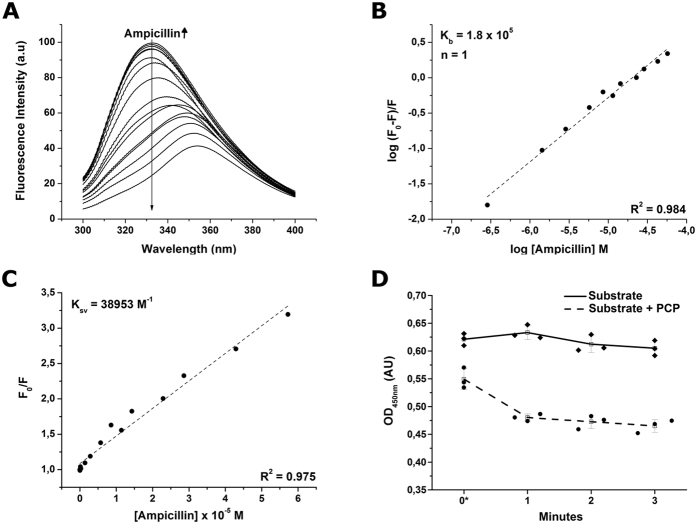
A current metagenomics focus is to interpret and transform collected genomic data into biological information. By combining structural, functional and genomic data we have assessed a novel bacterial protein selected from a carbohydrate-related activity screen in a microbial metagenomic library from Capra hircus (domestic goat) gut. This uncharacterized protein was predicted as a bacterial cell wall-modifying enzyme (CWME) and shown to contain four domains: an N-terminal, a cysteine protease, a peptidoglycan-binding and an SH3 bacterial domain. We successfully cloned, expressed and purified this putative cysteine protease (PCP), which presented autoproteolytic activity and inhibition by protease inhibitors. We observed cell wall hydrolytic activity and ampicillin binding capacity, a characteristic of most bacterial CWME. Fluorimetric binding analysis yielded a Kb of 1.8 × 10⁵ M-1 for ampicillin. Small-angle X-ray scattering (SAXS) showed a maximum particle dimension of 95 Å with a real-space Rg of 28.35 Å. The elongated molecular envelope corroborates the dynamic light scattering (DLS) estimated size. Furthermore, homology modeling and SAXS allowed the construction of a model that explains the stability and secondary structural changes observed by circular dichroism (CD). In short, we report a novel cell wall-modifying autoproteolytic PCP with insight into its biochemical, biophysical and structural features.


Figures

Figure 1
Figure 1. Circular dichroism spectra of PCP in TRIS-HCl with and without DTT as a function of temperature.
(A) CD spectra obtained for the same sample at 8 temperatures ranging from 25 to 95 °C, in 10 °C steps, as represented by each curve. A characteristic α-helical profile is depicted, with minimums in 208 and 222 nm. (B) The same conditions were analyzed in the presence of 2 mM DTT. PCP secondary structure content was significantly altered by addition of DTT and even more so after subsequent heating.
Figure 2
Figure 2. Cartoon representations of homology models of individual PCP domains.
Alpha helices are colored in red and beta strands in yellow. (A) Domain 1 (residues 1-48), N-terminal domain is depicted in orange; Domain 2 (residues 49-185), the catalytic CHAP domain, in yellow; Domain 3 (residues 186-247), the peptidoglycan binding domain, in green; and Domain 4 (residues 248-319), the SH3 domain, in blue. (B) The N-terminal Domain 1 presenting an LCI fold. The arrow points to the glycine-rich loop observed in this fold. (C) Domain 3 presenting three alpha helices organized in a conserved PGBD fold. (D) The C-terminal Domain 4 presenting an SH3 conserved fold with its functional loops emphasized. (E) Domain 2 presenting the conserved structural features of a catalytic CHAP domain with a six-strand beta sheet (located to the right) packed against a group of alpha helices (located to the left). The catalytic residues, Cys100 and His161, are also shown. (F) Close-up on the catalytic site residues of Domain 2 and their respective distances. (G) Surface of the Domain 2 catalytic pocket showing the substrate cleft and catalytic residues’ positions.
Figure 3
Figure 3. Sequence analysis of PCP domains. Secondary structures and residue numbering correspond to the PCP homology model and sequence, respectively.
(A) Domain 1 sequence alignment to homologous sequences and PDB structures*. Homologous sequences found at the C-terminus or N-terminus of catalytic domains are grouped and identified in the insert. (B) Domain 2 sequence alignment to homologous sequences and PDB structures*. Conserved catalytic Cys100 and His161 residues are highlighted in red. At the end of this domain there are 8 residues missing referred to as GAP: 178PVTDALKR185. (C) Domain 3 sequence alignment to homologous sequences and PDB structures*. Conserved PBD signature sequence repeat can be seen at position Asp213-Thr230 and Asp236-Thr243 (in PCP residue 236 is a Ser). (D) Domain 4 sequence alignment to homologous sequences and PDB structures*. *All PDB structures are identified by their four-character accession codes (ex. 3FN2, 3NE0, 1LBU, 2KRS etc). This figure was produced using the ESPript online server (http://espript.ibcp.fr).
Figure 4
Figure 4. SAXS envelope fitted with the complete homology model of PCP.
The images are rotated with respect to each other by 90 degrees on the longer axis. Individual homology models of each domain were manually fitted into SAXS envelope using the PyMOL software and then modeled together to produce a complete homology model of PCP. The complete model was analyzed with the SAXS envelope using the software SCATTER.
Figure 5
Figure 5. 12% SDS PAGE showing recombinant PCP protein autoproteolytic assays.
Figure 5 (A) Lane 1: Protein maker. Lane 2: Purified denatured protein at 95 °C as native control. Lane 3: Protein incubated at −21 °C showing no autoproteolysis. Lane 4: Protein incubated at −21 °C with protease inhibitors cocktail. Lane 5: Protein incubated at 4 °C showing partial autoproteolysis. Lane 6: Protein incubated at 4 °C with protease inhibitors cocktail with no autoproteolysis. Lane 7: Protein incubated at 25 °C showing complete autoproteolysis. Lane 8: Protein incubated at 25 °C with protease inhibitors cocktail showing that the autoproteolysis was inhibited. (B) Lane 1: Protein Marker. Lane 2: Purified denatured protein at 95 °C. Lane 3: through Lane 10: Purified protein incubated at 25 °C in different buffered pHs: 4.1, 4.8, 5.6, 6.1, 6.8, 7.2, 7.9 and 8.5, respectively. An increase in the autoproteolytic activity of PCP can be correlated with the increase in pH. (C) Lane 1: Protein marker; Lane 2: Purified construct of domains 1 through 3 (D13) incubated at 4 °C showing autoproteolytic activity; Lane 3: Purified D13 incubated at 25 °C and displaying autoproteolytic activity; Lane 4: Purified construct of domains 3 and 4 (D34) incubated at 4 °C and displaying no autoproteolysis; Lane 5: Purified D34 incubated at 25 °C and displaying no autoproteolysis.
Figure 6
Figure 6. Fluorescence quenching spectroscopy of PCP in complex with ampicillin and results of a cell wall hydrolase assay.
(A) Fluorescence emission spectra of the protein with increasing concentrations of the ampicillin (0.0029 to 57.0 μM) indicated by the thin arrow. A decrease in the fluorescence emission spectrum was observed as ampicillin concentration increased. (B) Double logarithm regression curve as a function of ampicillin concentration. Binding constant (Kb) and number of binding sites (n) are also depicted. (C) The linear regression derived from Stern-Volmer approximation. The Stern-Volmer constant (KSV) is also depicted. (D) Cell wall hydrolase assay showing decrease in the OD450nm due to PCP activity. Round dots and dashed line refer to the experiments in the presence of PCP while diamond-shaped dots and full line are the control experiments containing buffer without the enzyme. Error bars represent 1.5 times the standard deviations of a set of three replicates, as represented by three dots for every time measurement (when the 3 dots of one specific time overlapped, the dots were slightly separated along the time axis for clarity). The line connecting measurements passes through the mean average of each triplicate (unfilled squares). *Zero minutes represents the moment the experiment was first measured; however, there was a delay of approximately 2 minutes accounting for the time between adding the enzyme and setting up the experiment for its first measurement.

References

    1. Schmeisser C., Steele H. & Streit W. Metagenomics, biotechnology with non-culturable microbes. Appl. Microbiol. Biotechnol. 75, 955–962 (2007). - PubMed
    1. Streit W. R., Daniel R. & Jaeger K.-E. Prospecting for biocatalysts and drugs in the genomes of non-cultured microorganisms. Curr. Opin. Biotechnol. 15, 285–290 (2004). - PubMed
    1. Lorenz P. & Eck J. Metagenomics and industrial applications. Nature Rev. Microbiol. 3, 510–516 (2005). - PubMed
    1. Singh A. H., Doerks T., Letunic I., Raes J. & Bork P. Discovering functional novelty in metagenomes: examples from light-mediated processes. J. Bacteriol. 191, 32–41 (2009). - PMC - PubMed
    1. Alvarez T. M. et al.. Structure and function of a novel cellulase 5 from sugarcane soil metagenome. PloS one 8, e83635 (2013). - PMC - PubMed

Publication types

MeSH terms

LinkOut - more resources