. 2017 Mar;140(6):874-888.
doi: 10.1111/jnc.13923. Epub 2017 Feb 14.

An isogenic blood-brain barrier model comprising brain endothelial cells, astrocytes, and neurons derived from human induced pluripotent stem cells

Affiliations

An isogenic blood-brain barrier model comprising brain endothelial cells, astrocytes, and neurons derived from human induced pluripotent stem cells

Scott G Canfield et al. J Neurochem. 2017 Mar.

Abstract

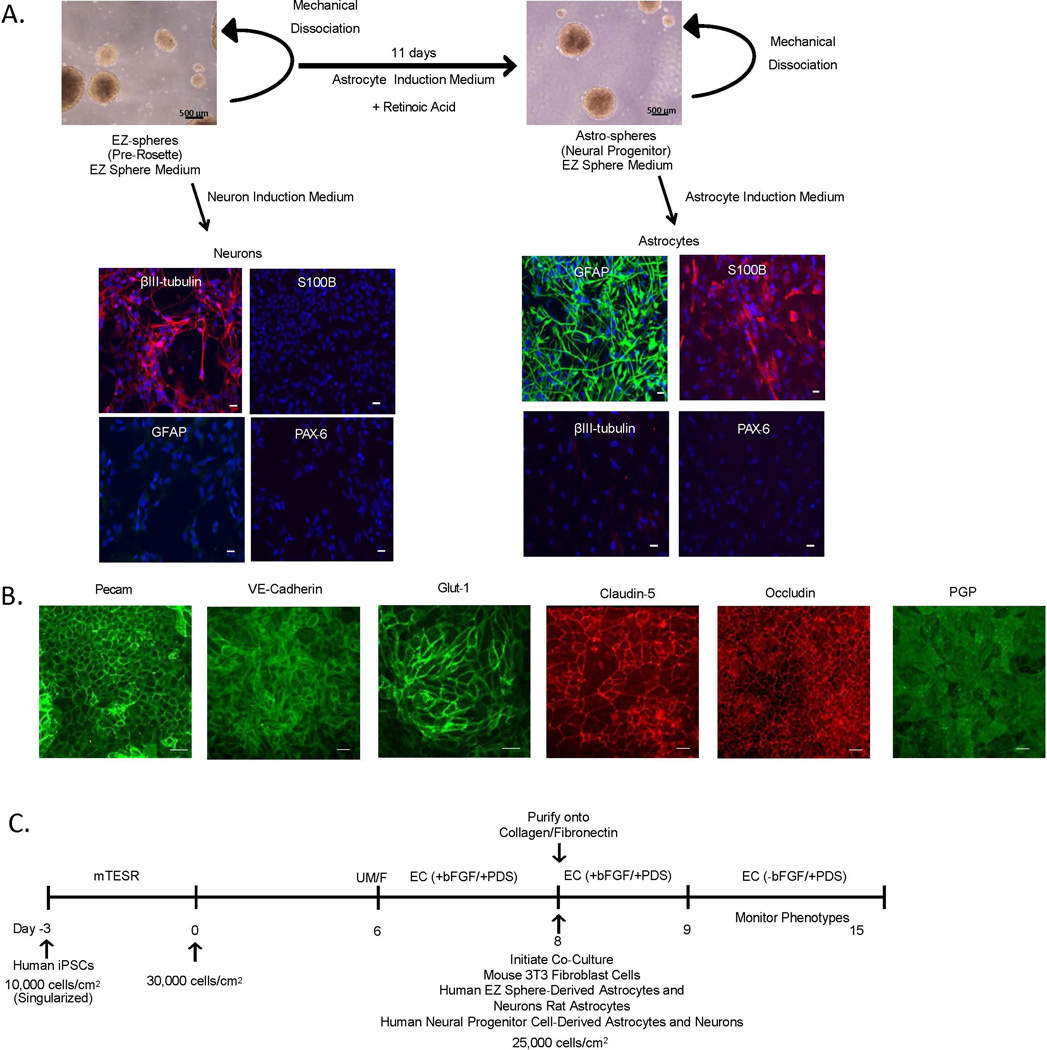
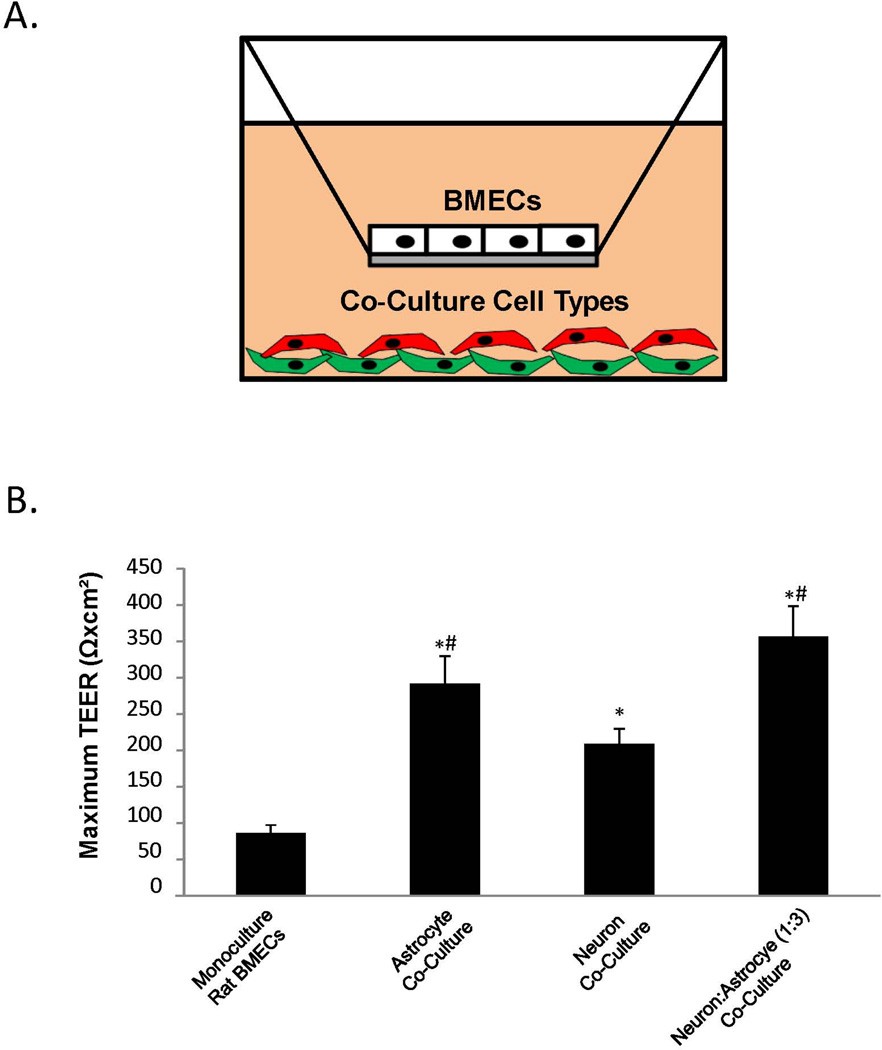
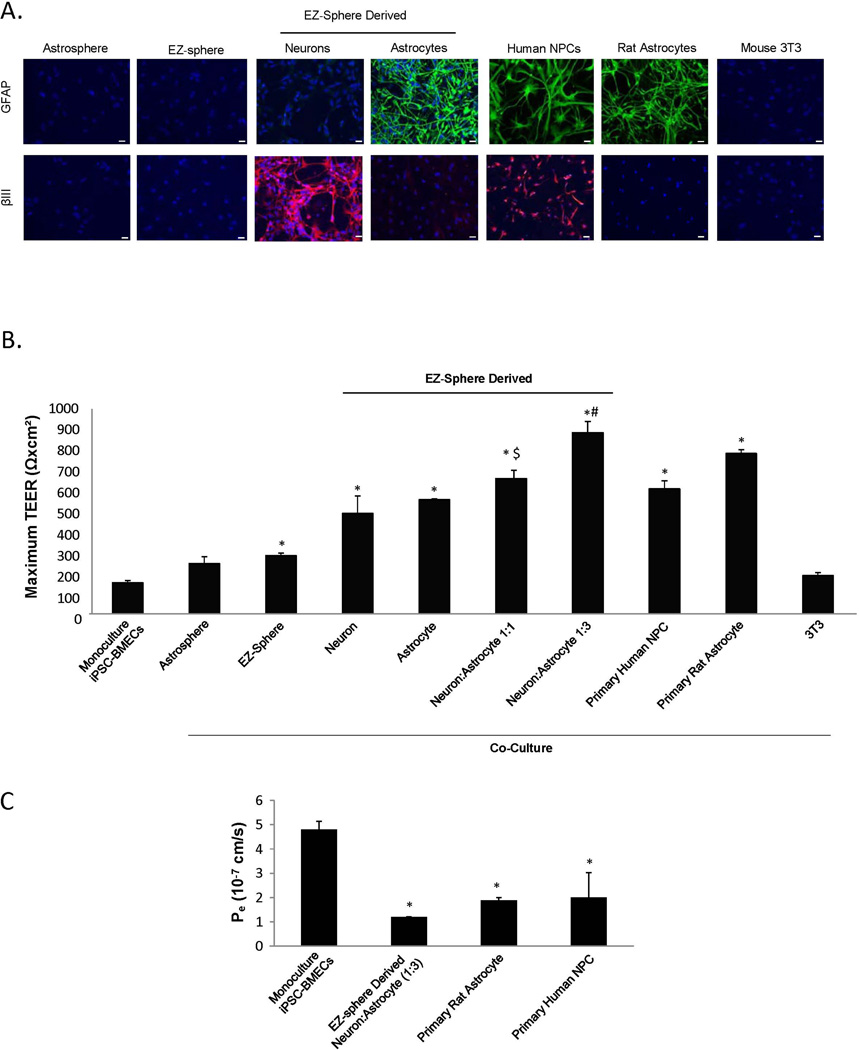
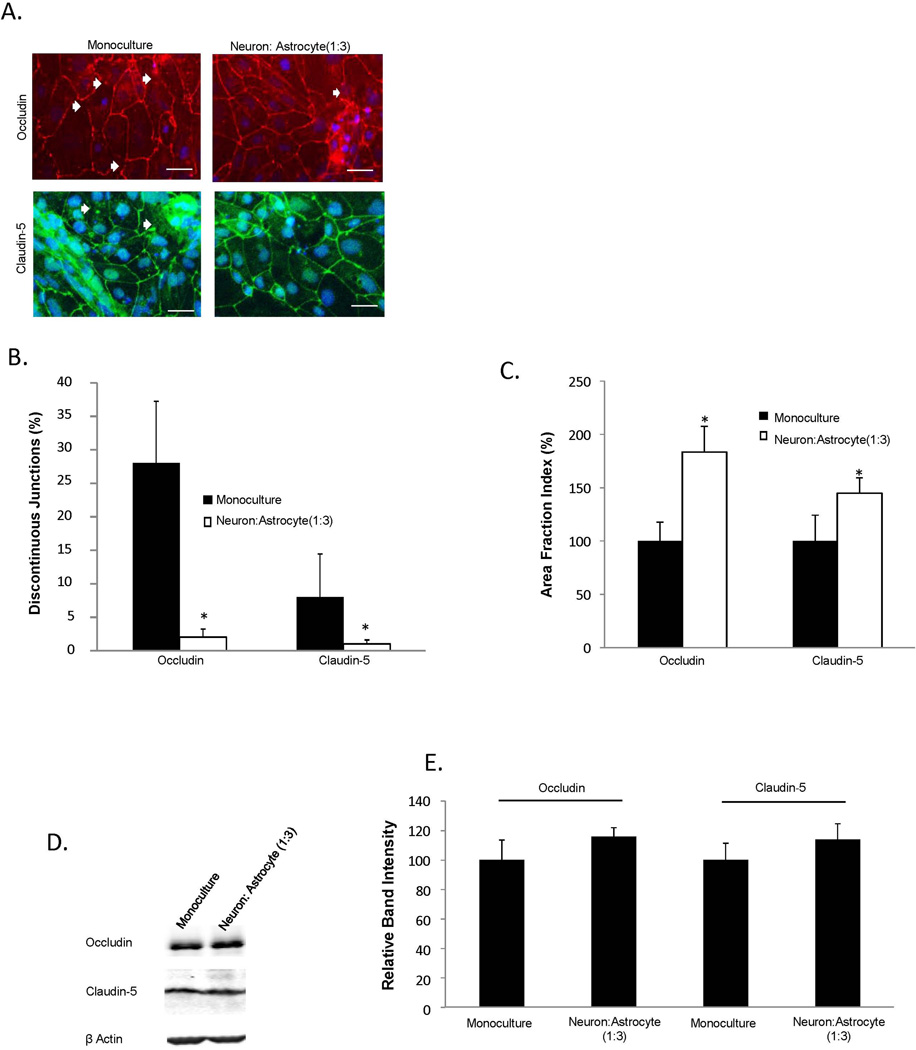
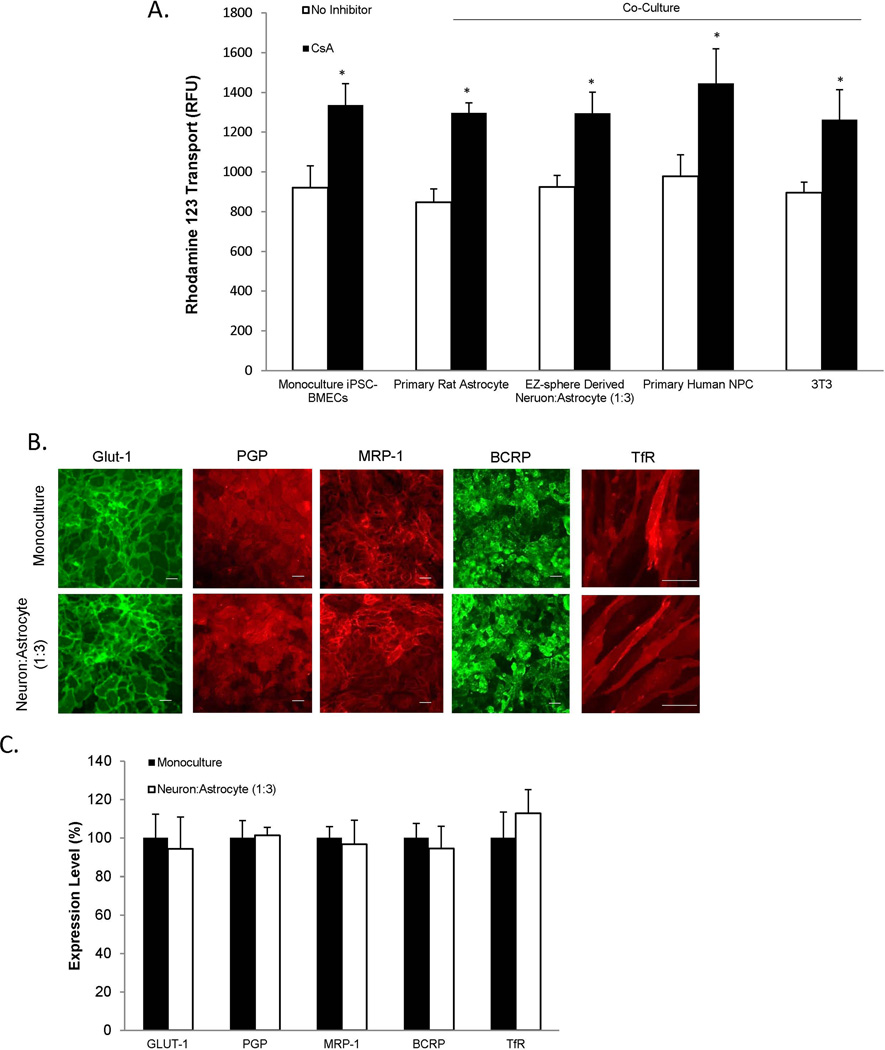
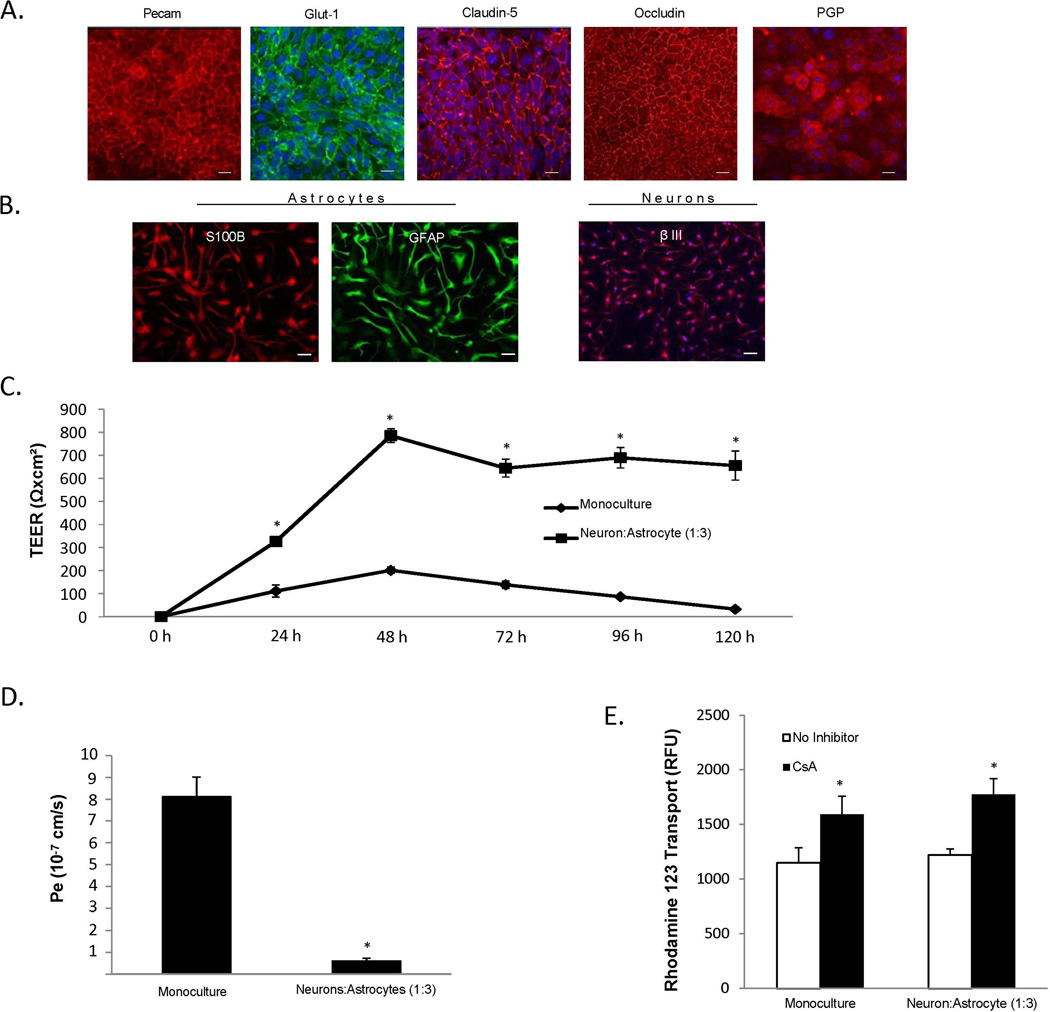
The blood-brain barrier (BBB) is critical in maintaining a physical and metabolic barrier between the blood and the brain. The BBB consists of brain microvascular endothelial cells (BMECs) that line the brain vasculature and combine with astrocytes, neurons and pericytes to form the neurovascular unit. We hypothesized that astrocytes and neurons generated from human-induced pluripotent stem cells (iPSCs) could induce BBB phenotypes in iPSC-derived BMECs, creating a robust multicellular human BBB model. To this end, iPSCs were used to form neural progenitor-like EZ-spheres, which were in turn differentiated to neurons and astrocytes, enabling facile neural cell generation. The iPSC-derived astrocytes and neurons induced barrier tightening in primary rat BMECs indicating their BBB inductive capacity. When co-cultured with human iPSC-derived BMECs, the iPSC-derived neurons and astrocytes significantly elevated trans-endothelial electrical resistance, reduced passive permeability, and improved tight junction continuity in the BMEC cell population, while p-glycoprotein efflux transporter activity was unchanged. A physiologically relevant neural cell mixture of one neuron: three astrocytes yielded optimal BMEC induction properties. Finally, an isogenic multicellular BBB model was successfully demonstrated employing BMECs, astrocytes, and neurons from the same donor iPSC source. It is anticipated that such an isogenic facsimile of the human BBB could have applications in furthering understanding the cellular interplay of the neurovascular unit in both healthy and diseased humans. Read the Editorial Highlight for this article on page 843.

Keywords: astrocytes; blood-brain barrier model; neurons; neurovascular unit; stem cells.


Conflict of interest statement

Conflicts of Interest Disclosure

The authors declare there are no conflicts of interest.

Figures

Figure 1
Figure 1. Derivation of neurons, astrocytes and BMECs for BBB modeling
(A) iPSC 4.2 EZ-spheres were maintained in suspension in EZ sphere medium. EZ-spheres were singularized and differentiated towards neurons following a 14-day treatment with neuron induction medium. EZ-spheres were also differentiated further to an astrosphere population following an 11-day treatment with astrocyte induction medium supplemented with retinoic acid. Astrospheres were maintained in suspension in EZ sphere medium and subsequently differentiated to astrocytes following 14 days in an astrocyte induction medium. To examine neuronal and astrocyte differentiation, EZ-sphere-derived cell populations were immunocytochemically labeled for the early neural ectoderm marker PAX-6, neuronal marker β-III tubulin, and astrocyte markers S100B and GFAP. Scale bar = 200 µm. To derive BMECS, singularized IMR90-4 iPSCs were expanded for 3 days prior to the initiation of differentiation (Day 0), differentiated for six days in UM/F medium and then switched to an EC based medium for two days. (B) IMR90-4 iPSC-derived BMECs were immunolabeled for Pecam and VE-Cadherin, the glucose transporter Glut-1, tight junction proteins Claudin-5 and Occludin, and the efflux transporter PGP. Scale bars = 100 µm. (C) iPSC-BMEC differentiation and co-culture timeline. Day 8 differentiated BMECs were placed in co-culture with EZ-sphere-derived astrocytes or neurons or control cell types including rat astrocytes, human neural progenitor cell-derived astrocytes and neurons, mouse 3T3 fibroblasts. All co-culture experiments were conducted in EC medium with BBB phenotypes being monitored to day 15.
Figure 2
Figure 2. Determination of the BBB inductive effects of EZ-sphere-derived astrocytes and neurons
(A) Co-culture was conducted using a Transwell system. BMECs were seeded on the Transwell filter with co-cultured cell types seeded at the bottom of the well. (B) Primary rat BMECs were co-cultured with iPSC 4.2 EZ-sphere-derived neurons, astrocytes or a mixture of neurons and astrocytes (1 neuron: 3 astrocytes) and TEER was monitored. Statistical significance was calculated using ANOVA.*p<0.05 vs. rat BMECs; #p<0.05 vs. neurons. Values are mean ± SD of three replicates from a single rat BMEC isolation and a single neuron and astrocyte differentiation, and experiments were repeated for two additional independent isolations and differentiations for verification of reported statistical trends.
Figure 3
Figure 3. Optimization of co-culture conditions to induce barrier tightening in iPSC-derived BMECs
A variety of co-cultured cells were examined for their capacity to induce barrier tightening in IMR90-4 iPSC-derived BMECs. (A) Immunocytochemical probing for GFAP and β-tubulin III was utilized to examine the distribution of astrocytes and neurons, respectively. Astrospheres, EZ-spheres and EZ-sphere-derived astrocytes and neurons were generated from the iPSC 4.2 EZ-spheres. Primary human NPC-derived mixtures of astrocytes and neurons, primary rat astrocytes and mouse 3T3 fibroblasts were employed as comparative controls. Scale bars = 200 µm. (B) Maximum TEER values were reached 48 h after the initiation of co-culture (Day 10). All co-cultured cells were seeded at 25,000 cells/cm2. EZ-sphere-derived neural cells were employed as either pure neuron or astrocyte cultures, or as mixtures as denoted. (C) Fluorescein permeability was measured 48 h following the initiation of co-culture (Day 10). Statistical significance was calculated using ANOVA. *p<0.05 vs. monoculture, $p<0.05 vs. neuron or astrocyte co-culture, #p<0.05 vs. all groups. Values are mean ± SD of three replicates from a single isolation/differentiation, and experiments were repeated for three additional differentiations for verification of reported statistical trends.
Figure 4
Figure 4. Analysis of tight junction continuity following EZ-sphere co-culture
Tight junction protein localization and expression levels were investigated in IMR90-4 iPSC-derived BMECs following 48 h of co-culture with iPSC 4.2 EZ-sphere-derived neurons and astrocytes (1:3). (A) Immunocytochemistry of occludin and claudin-5 revealed discontinuous tight junctions (white arrows). Scale bars = 50 µm. (B) Discontinuous junctions were quantified in BMECs in monoculture and co-culture conditions by counting cells that contained at least one discontinuous tight junction. (C) Additional quantification of tight junction localization in BMECs in monoculture and co-culture conditions was conducted by calculating the area of each image having occludin and claudin-5 immunoreactivity, resulting in the area fraction index. The data is normalized to monoculture conditions and expressed as a percentage. Statistical significance for panels (B) and (C) was calculated using a Student’s t-test. *p<0.05 vs. monoculture. Values are mean ± SD of three blinded independent differentiations. (D) Western blot of tight junction proteins occludin and claudin-5 in both monoculture and co-culture conditions with a β-actin loading control. A single lane representative of triplicate Western blot samples is shown. (E) Quantification of Western blots to compare tight junction protein expression levels. Co-culture samples were independently normalized to each respective monoculture sample. Statistical significance was calculated using a Student’s t-test. Values are mean ± SD of three independent differentiations.
Figure 5
Figure 5. Evaluation of BMECs following co-culture
(A) To assess active efflux transporter activity in IMR90-4 iPSC-derived BMECs, the trans-BMEC transport of PGP substrate rhodamine 123, with and without the PGP inhibitor cyclosporine A (CsA) was measured. IMR90-4 iPSC-derived BMECs were co-cultured with rat astrocytes, human NPC-derived astrocytes and neurons, iPSC 4.2 EZ-sphere-derived neurons and astrocytes (1:3), or mouse 3T3 fibroblasts. Rhodamine 123 transport from the apical to the basolateral chamber was measured in the two-compartment co-culture model in the presence or absence of CsA and reported as raw fluorescence units (RFU). Statistical significance was calculated using ANOVA.*p<0.05 vs. no inhibition control for each experimental condition. Values are mean ± SD of three replicates from a single differentiation/isolation, and experiments were repeated for two more additional independent differentiations to confirm statistical trends. (B) Immunocytochemistry of IMR90-4 iPSC-derived BMECs in mono-culture or after 48 hours of co-culture with 4.2 iPSC EZ-sphere-derived neurons and astrocytes (1:3) probing for glucose transporter, Glut-1, efflux transporters, PGP, MRP-1, BCRP, or transferrin receptor, TfR, expression. Scale bar = 100 µm. (C) Quantitative transporter expression levels were determined using flow cytometry. Geometric means of positively immunolabeled cell populations were used to compare expression levels with and without co-culture. Sample flow cytometry data can be found in Supplementary Figure 3. The data are normalized to monoculture expression levels. Statistical significance was determined using a Student’s t-test. Values are mean ± SD of three independent differentiations.
Figure 6
Figure 6. Development of an isogenic neurovascular unit
iPSC-derived BMECs and EZ-sphere-derived astrocytes and neurons were differentiated from the same CSO3n2 iPSC line. (A) Immunocytochemical analysis of BBB markers in CSO3n2-derived BMECs. Scale bar = 100 µm. (B) Immunocytochemical of astrocyte and neuron markers in astrocytes and neurons differentiated from CSO3n2 EZ-spheres. Scale bars = 100µm. (C) Temporal TEER profile for CSO3n2 iPSC-derived BMECs with and without co-culture with CS03n2 iPSC-derived neurons and astrocytes. Statistical significance was calculated using Student’s t-test. *p<0.05 vs. monoculture. Values are mean ± SD of three replicates from a single differentiation, and experiments were repeated for two additional independent differentiations to verify statistical trends. (D) Sodium fluorescein permeability measured at 48 h after the initiation of co-culture. Statistical significance was calculated using Student’s t-test. *p<0.05 vs. monoculture. Values are mean ± SD of three replicates from a single differentiation, and experiments were repeated for two additional independent differentiations to verify statistical trends. (E) PGP efflux transporter activity was measured 48 h after initiation of co-culture. Statistical significance was calculated using ANOVA. *p<0.05 vs. no-inhibition. Values are mean ± SD of three replicates from a single differentiation, and experiments were repeated for two additional independent differentiations to verify statistical trends.

Comment in

References

    1. Azevedo FA, Carvalho LR, Grinberg LT, Farfel JM, Ferretti RE, Leite RE, Jacob Filho W, Lent R, Herculano-Houzel S. Equal numbers of neuronal and nonneuronal cells make the human brain an isometrically scaled-up primate brain. J Comp Neurol. 2009;513:532–541. - PubMed
    1. Berezowski V, Landry C, Dehouck MP, Cecchelli R, Fenart L. Contribution of glial cells and pericytes to the mRNA profiles of P-glycoprotein and multidrug resistance-associated proteins in an in vitro model of the blood-brain barrier. Brain Res. 2004;1018:1–9. - PubMed
    1. Brown JA, Pensabene V, Markov DA, et al. Recreating blood-brain barrier physiology and structure on chip: A novel neurovascular microfluidic bioreactor. Biomicrofluidics. 2015;9:054124. - PMC - PubMed
    1. Butt AM, Jones HC, Abbott NJ. Electrical resistance across the blood-brain barrier in anaesthetized rats: a developmental study. J Physiol. 1990;429:47–62. - PMC - PubMed
    1. Calabria AR, Shusta EV. A genomic comparison of in vivo and in vitro brain microvascular endothelial cells. J Cereb Blood Flow Metab. 2008;28:135–148. - PMC - PubMed

Publication types

MeSH terms