. 2017 Mar;74(3):114-124.
doi: 10.1002/cm.21349. Epub 2017 Jan 31.

Matrix rigidity regulates microtubule network polarization in migration

Affiliations

Matrix rigidity regulates microtubule network polarization in migration

Matthew Raab et al. Cytoskeleton (Hoboken). 2017 Mar.

Abstract

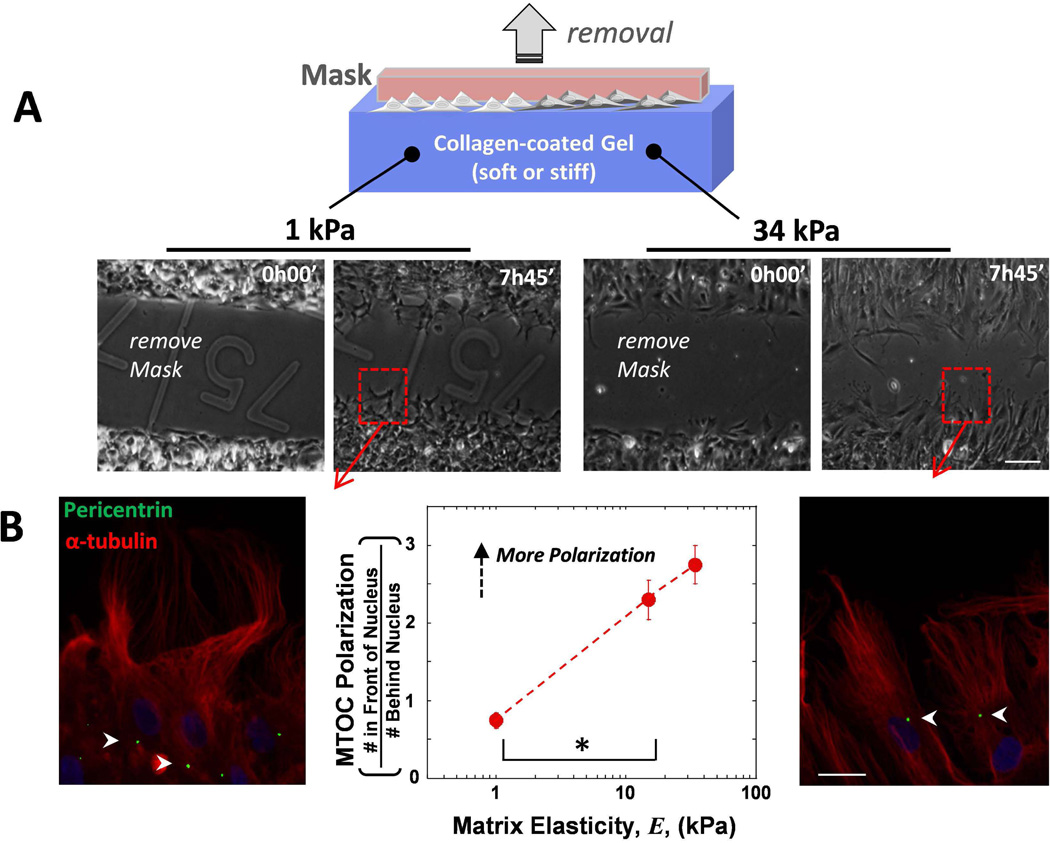
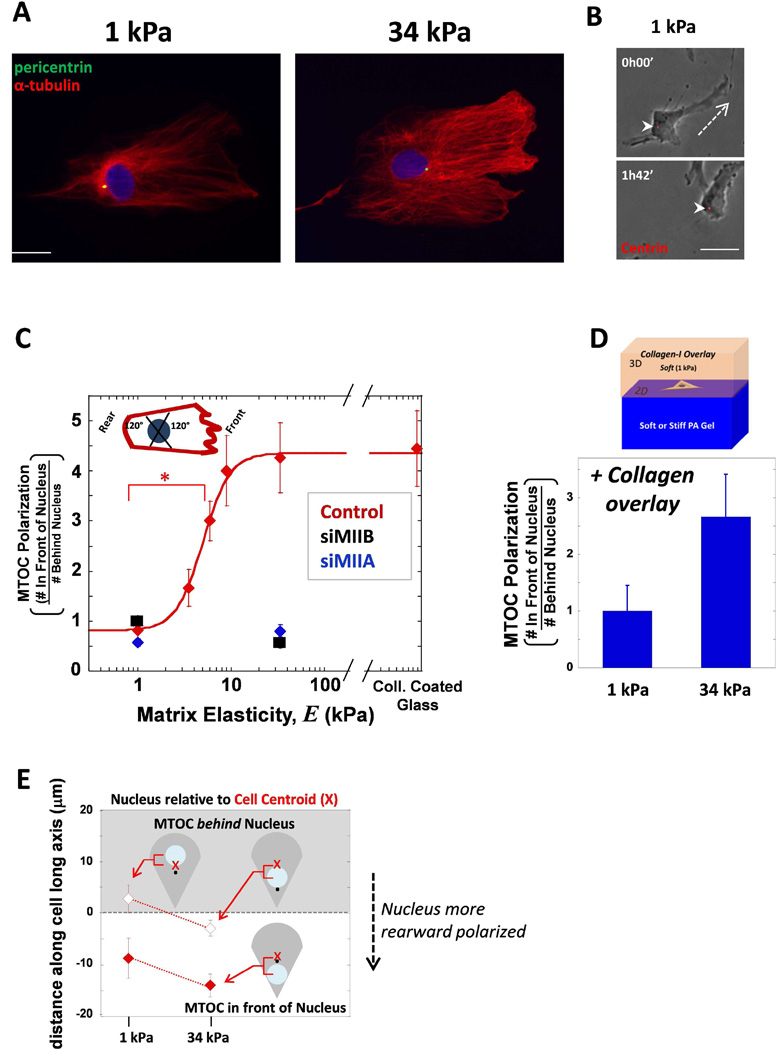
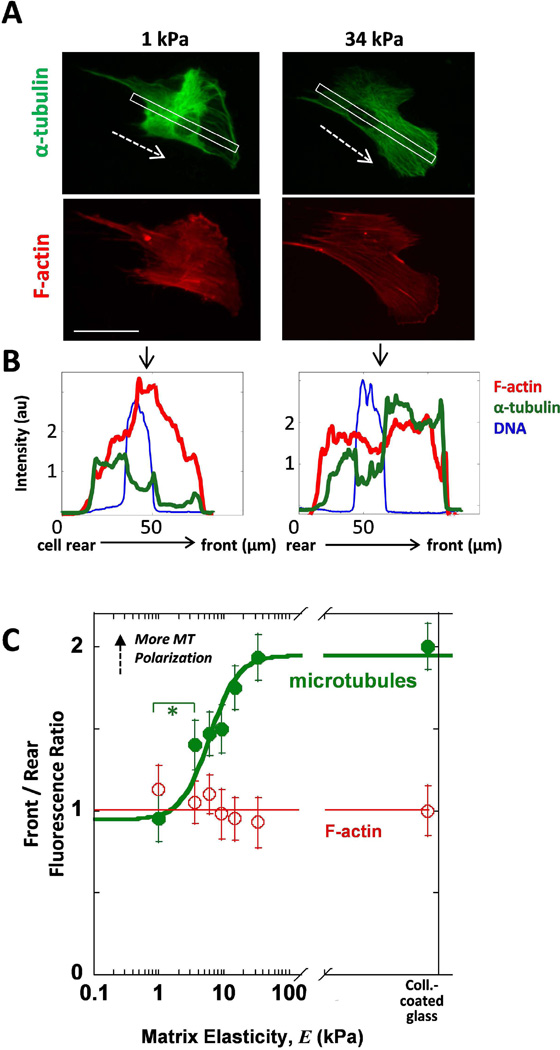
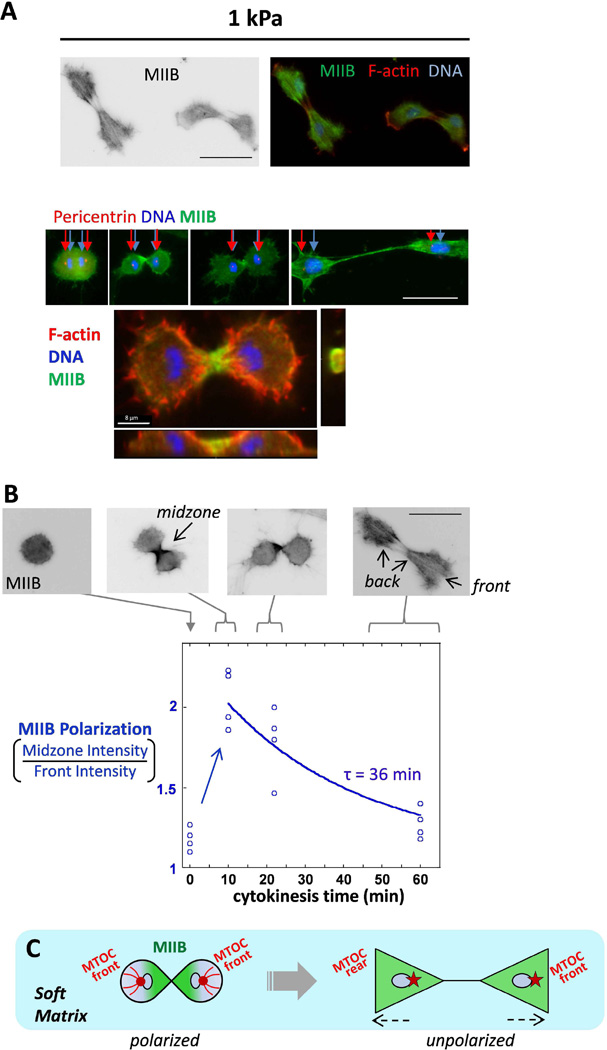
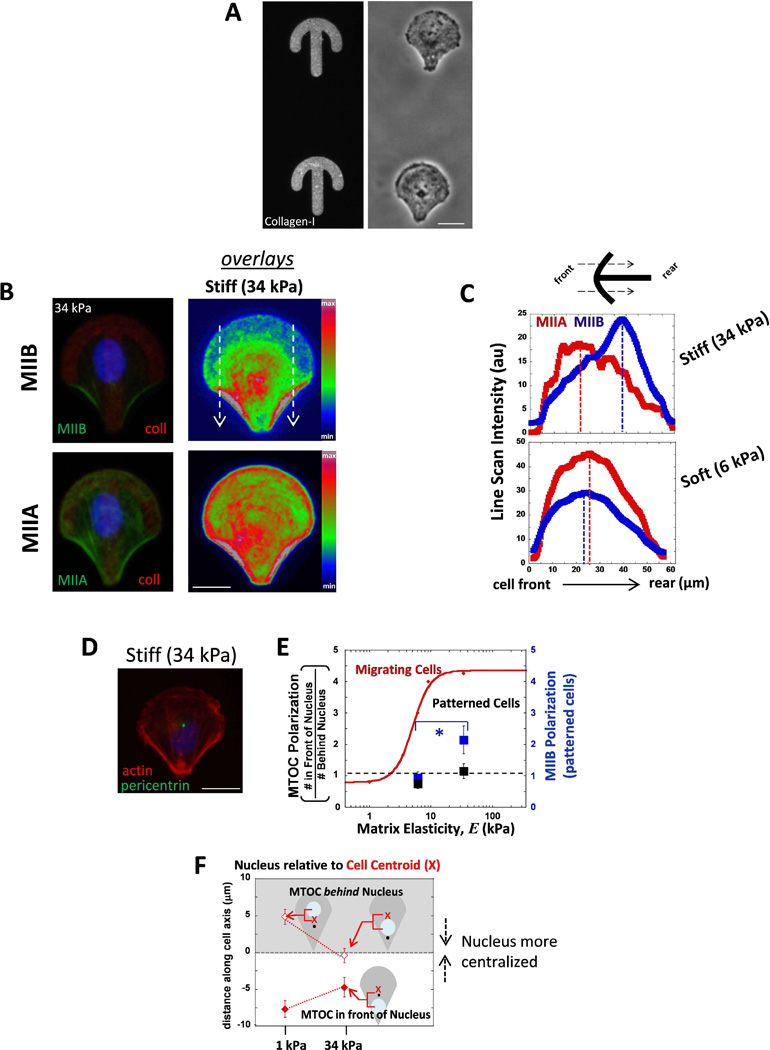
The microtubule organizing center (MTOC) frequently polarizes to a position in front of the nucleus during cell migration, but recent work has shown conflicting evidence for MTOC location in migratory polarized cells. Here, we show that subcellular localization of the MTOC is modulated by extracellular matrix stiffness. In scratch wound assays as well as single cell migration of mesenchymal stem cells (MSCs) the MTOC appears randomly positioned when cells are migrating on soft matrix, whereas on stiff matrix the MTOC is in front of the nucleus. The bulk of the microtubule density is also equally likely to be in front of or behind the nucleus on soft matrix, but it is polarized in front of the nucleus on stiff matrix. This occurred during cell migration with cells in interphase. During cytokinesis, the centrosomes polarize on either side of the chromosomes even on soft matrix, with MIIB localized strongly in the cleavage furrow which depolarizes only on soft matrix as cells exit cytokinesis. When cells are immobilized on micro-patterns printed on the top of substrates of different stiffness, MIIB polarized if the matrix was sufficiently stiff similar to results with migrating cells. However, the MTOC was randomly positioned with respect to the nucleus independent of matrix stiffness. We deduce that cell migration is necessary to orient the MTOC in front of the nucleus and that matrix stiffness helps to drive cell polarization during migration. © 2016 Wiley Periodicals, Inc.

Keywords: matrix stiffness; microtubules; migration; polarity.


Figures

Fig. 1
Fig. 1. MTOC polarization increases with increasing gel stiffness in MSCs migrating in wound assays
(A) The mask was removed at the initial time and the Mesenchymal stem cells (MSCs) migrate into the 500 µm wide gap on gels of varying stiffness. Scale bar 100 µm (B) The MTOC was visualized with pericentrin (green), the MTs with α-tubulin (red) and DNA with Hoechst (blue) 2 hours after migration. MTOC polarization was quantified as (# In Front of the Nucleus)/(# Behind Nucleus). A ratio of 1 indicates as many cells have the MTOC in the front as the back. Arrowheads indicate location of MTOC. Scale bar 20 µm. N=3, n≥91 cells, * p<0.05. Error bars SEM.
Fig. 2
Fig. 2. MSCs polarize their MTOC on sufficiently stiff matrix during migration as single cells
(A) Cells on either soft 1 kPa or stiff 34 kPa matrix were immunostained for pericentrin (green) and MTs (red) and DNA with hoechst (blue). Scale bar 20 µm. (B) Cell transfected with dsRed-Centrin was imaged migrating on soft 1 kPa matrix. The MTOC was located behind the nucleus during migration. Dashed line indicates direction of migration, arrowheads point to MTOC. Scale bar 20 µm (C) The ratio of the number of cells with MTOC in front of nucleus to the cells that have the MTOC behind nucleus. A schematic picture represents how the MTOC was considered in a ‘front’ or ‘rear’ position based on the migrating phenotype of a lamellipodium in the front and a tail in the rear. When MIIA (blue) or MIIB (black) is depleted, the MTOC fails to polarize to the cell front despite being on stiff matrix. Error bars SEM. N=3, n≥25, * p<0.05. (D) For PA gel stiffnesses of 1 and 34 kPa, a soft collagen was overlaid on top of the gel and the cells migrating on the surface were assessed for MTOC polarization. (E) The data from (C) was separated so that the instances the MTOC was in front of the nucleus (white background, filled shapes) was separated. The average distance between the cell centroid and the nucleus center was plotted and again the instances when the MTOC was behind the nucleus was differentiated from when it was behind. The nucleus was more rearward positioned in cells on stiffer matrix as the nucleus move closer to the rear.
Fig. 3
Fig. 3. Stiff matrix promotes frontward distribution of MTs
(A) Images of MSCs on soft or stiff gels show higher MT density in front of the nucleus with stiff matrix but not when on soft matrix. White outline indicates the region scanned for the line scans of fluorescence intensity. Dashed arrows indicate inferred direction of migration.. Scale bar = 50 µm. (B) Line scans taken from the back to the front of the cell show the intensity of MT density (green) as well as the nucleus (blue) and F-actin (red) as a function of distance. (C) The Front/Rear fluorescence is quantified as the ratio of the front half of the cell over the rear half on either side of the nucleus. The ratio for F-actin is plotted vs matrix elasticity and is compared to MTs. MTs polarize to the front of the cell with increasing matrix stiffness. Error bars SEM from N=3, n≥43, * p<0.05.
Fig. 4
Fig. 4. Cytokinesis on soft matrix reveals transient polarization of myosin-IIB which diminishes soon after
(A) Cells on soft matrix which have recently divided and are migrating away from each other. The MTOC, indicated by pericentrin immunostaining, is at the front end of each daughter cell as the chromosomes are pulled apart. Z-projection of dividing daughter MSCs on 1 kPa matrix (bottom). MIIB (green) localizes to the contractile ring. (B) Cells dividing on soft matrix at progressive stages of division. The average time was approximately 10 min for a dividing cell to go from one rounded cell to the forming a cleavage furrow. In going from a single rounded cell to 2 cells migrating apart separated by about one cell length, the average time was 60 min. The extent of MIIB polarization from the midzone to the nascently formed front of the cells is plotted and fit to an exponential decay to estimate the indicated depolarization time constant. The blue empty dots indicate data for individual cells and the cytokinesis time from the fixed images was estimated based on data taken from live cell imaging of dividing MSCs in Fig. S3. (C) Schematic drawing of transient cytoskeletal polarization on soft matrix: green represents MIIB and red dot represents the MTOC. Scale bars 50 µm.
Fig. 5
Fig. 5. MSCs confined to polarized patterns exhibit myosin-IIB polarization on stiffer matrix, but MTOC polarization in front of the nucleus is not present either soft and stiff matrix
(A) Gels with micropatterned collagen-I in polarized crossbow shapes (stained with an antibody). Phase contrast images of MSCs on the micropatterned gels. Scale bar 20 µm. (B) Sample image of cellular distributions of MIIB and MIIA in a cell on stiff (34 kPa) gels. False color represents an overlay of MIIB (top) or MIIA (bottom) staining. White arrows indicate the direction of the scan used as the region of interest in C. Scale bar 20 µm. (C) Distributions of MIIB and MIIA on stiff and soft patterned gels by taking scans of the ROI shown in B from the cell front to cell rear. MIIB is more polarized to cell rear only on stiff patterns. MIIA is not polarized to cell rear in cells on either stiffness (D) MTOC positioning in cells on patterned gels. Scale 20 µm. (E) Summary plot that compares the difference in MTOC polarization between migrating cells (red, from Fig. 2C) and patterned cells (black) and also MIIB polarization for patterned cells (blue). Patterned cells polarize MIIB with increasing matrix stiffness but MTOC polarization in front of the nucleus does not occur with increasing stiffness. * p<0.05 N=2, n≥15. (F) The positioning of the nucleus relative the cell center. The data is divided for cells that displayed MTOC behind the nucleus (open points, gray background) from cells that had the MTOC in front of the nucleus (filled in points, white background). The nucleus is more randomly positioned on soft matrix, while more centered on stiff.

References

    1. Akhshi TK, Wernike D, Piekny A. Microtubules and actin crosstalk in cell migration and division. Cytoskeleton. 2014 - PubMed
    1. Beningo KA, Hamao K, Dembo M, Wang YL, Hosoya H. Traction forces of fibroblasts are regulated by the Rho-dependent kinase but not by the myosin light chain kinase. Arch Biochem Biophys. 2006;456:224–231. doi:S0003-9861(06)00369-9. - PMC - PubMed
    1. Burke B, Roux KJ. Nuclei take a position: managing nuclear location. Dev Cell. 2009;17:587–597. doi:S1534-5807(09)00440-7. - PubMed
    1. Discher DE, Janmey P, Wang YL. Tissue cells feel and respond to the stiffness of their substrate. Science. 2005;310:1139–1143. doi:310/5751/1139. - PubMed
    1. Distel M, Hocking JC, Volkmann K, Koster RW. The centrosome neither persistently leads migration nor determines the site of axonogenesis in migrating neurons in vivo. J Cell Biol. 2010;191:875–890. doi:jcb.201004154. - PMC - PubMed

LinkOut - more resources