

A Versatile Method to Determine the Cellular Bioavailability of Small-Molecule Inhibitors
- PMID: 27935314
- PMCID: PMC7771553
- DOI: 10.1021/acs.jmedchem.6b00923
A Versatile Method to Determine the Cellular Bioavailability of Small-Molecule Inhibitors
Abstract
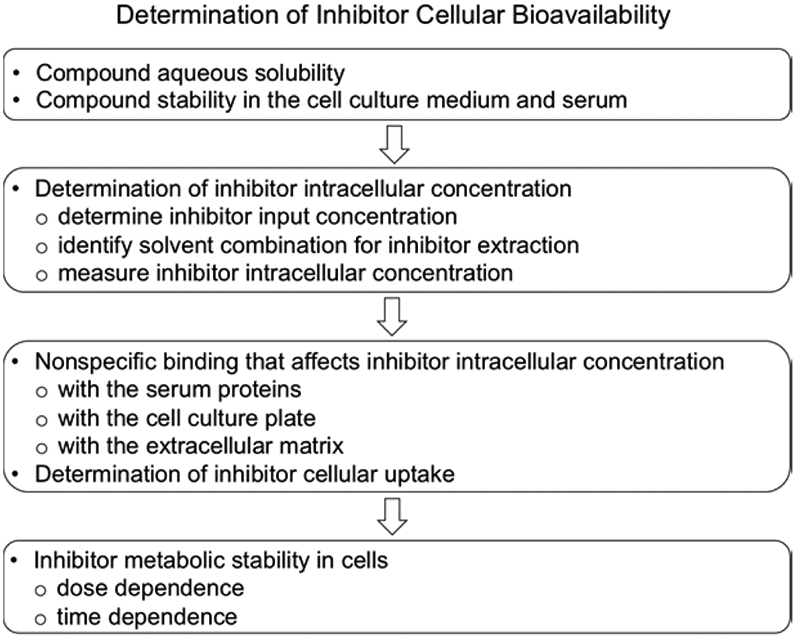
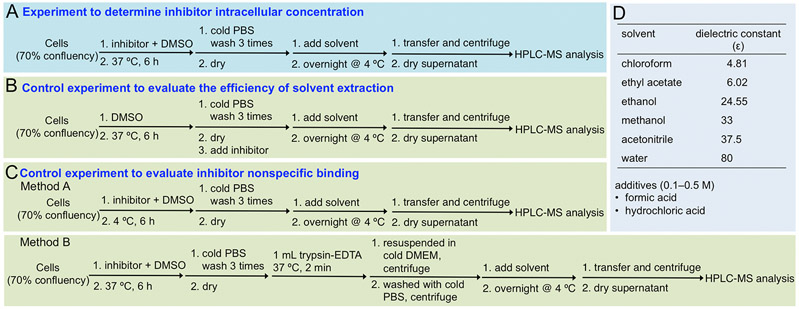
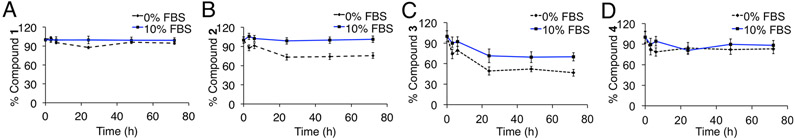
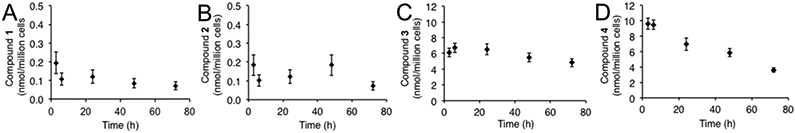
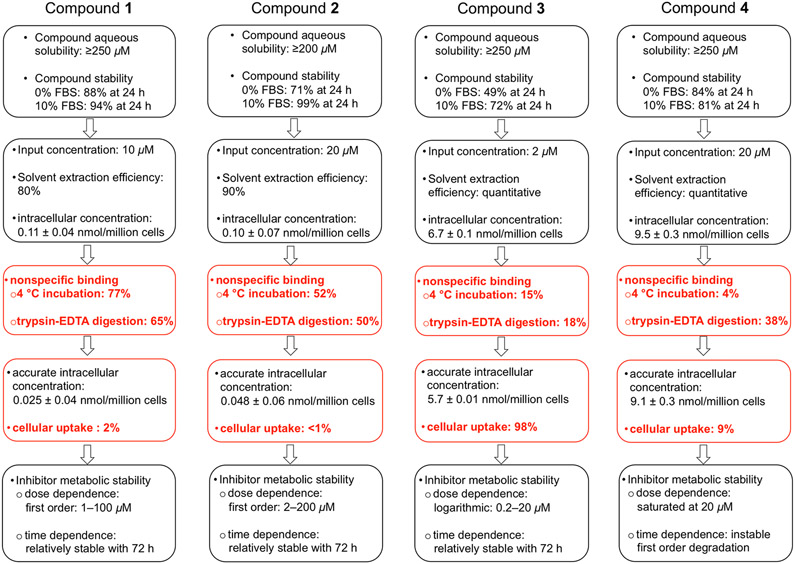
The determination of the cellular bioavailability of small-molecule inhibitors is a critical step for interpreting cell-based data and guiding inhibitor optimization. Herein, a HPLC-MS based protocol was developed to determine inhibitor cellular bioavailability. This generalizable protocol allows determination of the accurate intracellular concentrations and characterization of various properties of inhibitors including the extra- and intracellular stability, the dose- and time-dependence of the intracellular concentrations, the cell permeability, and the nonspecific binding with the cell culture plates, the extracellular matrices, and the cell membrane. The inhibitors of the protein-protein interactions, bromodomains, and the β-catenin/B-cell lymphoma 9 (BCL9) interaction were used to examine the protocol, and the cellular bioavailability of the inhibitors in cancer cells was determined. High nonspecific binding and low cellular uptake were observed for two bromodomain inhibitors. The two β-catenin/BCL9 inhibitors had low nonspecific binding but different cellular uptake. These inhibitors exhibited different stability kinetics in cells.
Figures


Similar articles
-
Inhibition of β-catenin/B cell lymphoma 9 protein-protein interaction using α-helix-mimicking sulfono-γ-AApeptide inhibitors.Proc Natl Acad Sci U S A. 2019 May 28;116(22):10757-10762. doi: 10.1073/pnas.1819663116. Epub 2019 May 14. Proc Natl Acad Sci U S A. 2019. PMID: 31088961 Free PMC article.
-
New ZW4864 Derivatives as Small-Molecule Inhibitors for the β-Catenin/BCL9 Protein-Protein Interaction.ACS Med Chem Lett. 2022 Apr 25;13(5):865-870. doi: 10.1021/acsmedchemlett.2c00068. eCollection 2022 May 12. ACS Med Chem Lett. 2022. PMID: 35586435 Free PMC article.
-
Structure-Based Design of 1,4-Dibenzoylpiperazines as β-Catenin/B-Cell Lymphoma 9 Protein-Protein Interaction Inhibitors.ACS Med Chem Lett. 2016 Mar 28;7(5):508-13. doi: 10.1021/acsmedchemlett.5b00284. eCollection 2016 May 12. ACS Med Chem Lett. 2016. PMID: 27190602 Free PMC article.
-
Bromodomains and their pharmacological inhibitors.ChemMedChem. 2014 Mar;9(3):438-64. doi: 10.1002/cmdc.201300434. Epub 2014 Feb 4. ChemMedChem. 2014. PMID: 24497428 Review.
-
Small molecule inhibitors of bromodomain-acetyl-lysine interactions.ACS Chem Biol. 2015 Jan 16;10(1):22-39. doi: 10.1021/cb500996u. ACS Chem Biol. 2015. PMID: 25549280 Review.
Cited by
-
Iterative machine learning-based chemical similarity search to identify novel chemical inhibitors.J Cheminform. 2023 Sep 23;15(1):86. doi: 10.1186/s13321-023-00760-6. J Cheminform. 2023. PMID: 37742003 Free PMC article.
-
Inhibition of β-catenin/B cell lymphoma 9 protein-protein interaction using α-helix-mimicking sulfono-γ-AApeptide inhibitors.Proc Natl Acad Sci U S A. 2019 May 28;116(22):10757-10762. doi: 10.1073/pnas.1819663116. Epub 2019 May 14. Proc Natl Acad Sci U S A. 2019. PMID: 31088961 Free PMC article.
-
Optimization of Peptidomimetics as Selective Inhibitors for the β-Catenin/T-Cell Factor Protein-Protein Interaction.J Med Chem. 2019 Apr 11;62(7):3617-3635. doi: 10.1021/acs.jmedchem.9b00147. Epub 2019 Mar 21. J Med Chem. 2019. PMID: 30856332 Free PMC article.
-
A widely-applicable high-throughput cellular thermal shift assay (CETSA) using split Nano Luciferase.Sci Rep. 2018 Jun 21;8(1):9472. doi: 10.1038/s41598-018-27834-y. Sci Rep. 2018. PMID: 29930256 Free PMC article.
-
Highly Potent and Selective N-Aryl Oxamic Acid-Based Inhibitors for Mycobacterium tuberculosis Protein Tyrosine Phosphatase B.J Med Chem. 2020 Sep 10;63(17):9212-9227. doi: 10.1021/acs.jmedchem.0c00302. Epub 2020 Aug 21. J Med Chem. 2020. PMID: 32787087 Free PMC article.
References
-
- Arrowsmith CH; Audia JE; Austin C; Baell J; Bennett J; Blagg J; Bountra C; Brennan PE; Brown PJ; Bunnage ME; Buser-Doepner C; Campbell RM; Carter AJ; Cohen P; Copeland RA; Cravatt B; Dahlin JL; Dhanak D; Edwards AM; Frederiksen M; Frye SV; Gray N; Grimshaw CE; Hepworth D; Howe T; Huber KVM; Jin J; Knapp S; Kotz JD; Kruger RG; Lowe D; Mader MM; Marsden B; Mueller-Fahrnow A; Müller S; O’Hagan RC; Overington JP; Owen DR; Rosenberg SH; Roth B; Ross R; Schapira M; Schreiber SL; Shoichet B; Sundström M; Superti-Furga G; Taunton J; Toledo-Sherman L; Walpole C; Walters MA; Willson TM; Workman P; Young RN; Zuercher WJ The promise and peril of chemical probes. Nat. Chem. Biol 2015, 11, 536–541. - PMC - PubMed
-
- Morgan P; Van Der Graaf PH; Arrowsmith J; Feltner DE; Drummond KS; Wegner CD; Street SD Can the flow of medicines be improved? Fundamental pharmacokinetic and pharmacological principles toward improving Phase II survival. Drug Discovery Today 2012, 17, 419–424. - PubMed
-
- Bunnage ME; Piatnitski Chekler EL; Jones LH Target validation using chemical probes. Nat. Chem. Biol 2013, 9, 195–199. - PubMed
-
- Hann MM; Simpson GL Intracellular drug concentration and disposition – the missing link? Methods 2014, 68, 283–285. - PubMed
Publication types
MeSH terms
Substances
Grants and funding
LinkOut - more resources
Full Text Sources
Other Literature Sources
Chemical Information
