

The role of obesity in the relation between total water intake and urine osmolality in US adults, 2009-2012
- PMID: 27935519
- PMCID: PMC7392307
- DOI: 10.3945/ajcn.116.137414
The role of obesity in the relation between total water intake and urine osmolality in US adults, 2009-2012
Abstract
Background: Adequate water intake is critical to physiologic and cognitive functioning. Although water requirements increase with body size, it remains unclear whether weight status modifies the relation between water intake and hydration status.
Objective: We examined how the association between water intake and urine osmolality, which is a hydration biomarker, varied by weight status.
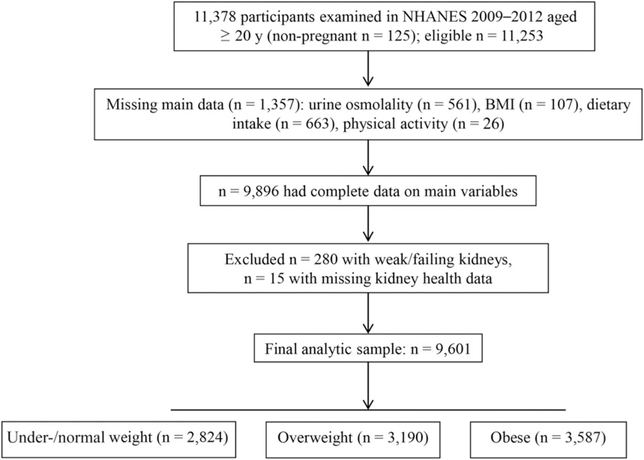
Design: NHANES cross-sectional data (2009-2012) were analyzed in 9601 nonpregnant adults aged ≥20 y who did not have kidney failure. Weight status was categorized with the use of body mass index on the basis of measured height and weight (underweight or normal weight, overweight, and obesity). Urine osmolality was determined with the use of freezing-point depression osmometry. Hypohydration was classified according to the following age-dependent formula: ≥831 mOsm/kg - [3.4 × (age - 20 y)]. Total water intake was determined with the use of a 24-h dietary recall and was dichotomized as adequate or low on the basis of the Institute of Medicine's adequate intake recommendations for men and women (men: ≥3.7 or <3.7 L; nonlactating women: ≥2.7 or <2.7 L; lactating women: ≥3.8 or <3.8 L for adequate or low intakes, respectively). We tested interactions and conducted linear and log-binomial regressions.
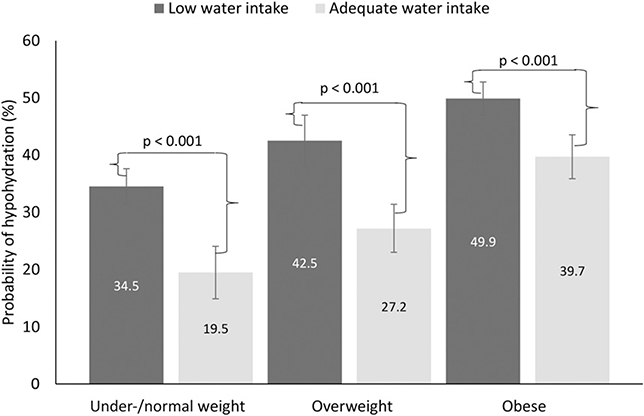
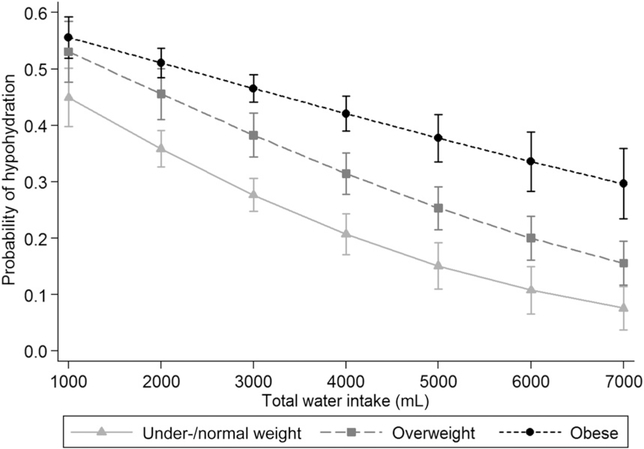
Results: Total water intake (P = 0.002), urine osmolality (P < 0.001), and hypohydration prevalence (P < 0.001) all increased with higher weight status. Interactions between weight status and water intake status were significant in linear (P = 0.005) and log-binomial (P = 0.015) models, which were then stratified. The prevalence ratio of hypohydration between subjects with adequate water intake and those with low water intake was 0.56 (95% CI: 0.43, 0.73) in adults who were underweight or normal weight, 0.67 (95% CI: 0.57, 0.79) in adults who were overweight, and 0.78 (95% CI: 0.70, 0.88) in adults who were obese.
Conclusion: On a population level, obesity modifies the association between water intake and hydration status.
Keywords: NHANES; effect modification; hydration status; obesity; water intake.
© 2016 American Society for Nutrition.
Conflict of interest statement
The authors’ responsibilities were as follows—AYR: drafted the manuscript; AYR, HGL, and LJA: analyzed the data; AYR, LJA, and CLO: designed the research; and all authors: edited and revised the manuscript, had responsibility for the final content of the manuscript, and read and approved the final manuscript. None of the authors reported a conflict of interest related to the study.
Figures
Similar articles
-
The Relationships between Water Intake and Hydration Biomarkers and the Applications for Assessing Adequate Total Water Intake among Young Adults in Hebei, China.Nutrients. 2021 Oct 26;13(11):3805. doi: 10.3390/nu13113805. Nutrients. 2021. PMID: 34836061 Free PMC article.
-
Elevated Serum Osmolality and Total Water Deficit Indicate Impaired Hydration Status in Residents of Long-Term Care Facilities Regardless of Low or High Body Mass Index.J Acad Nutr Diet. 2016 May;116(5):828-836.e2. doi: 10.1016/j.jand.2015.12.011. J Acad Nutr Diet. 2016. PMID: 27126154 Free PMC article. Clinical Trial.
-
Inadequate Hydration, BMI, and Obesity Among US Adults: NHANES 2009-2012.Ann Fam Med. 2016 Jul;14(4):320-4. doi: 10.1370/afm.1951. Ann Fam Med. 2016. PMID: 27401419 Free PMC article.
-
Folic acid supplementation and malaria susceptibility and severity among people taking antifolate antimalarial drugs in endemic areas.Cochrane Database Syst Rev. 2022 Feb 1;2(2022):CD014217. doi: 10.1002/14651858.CD014217. Cochrane Database Syst Rev. 2022. PMID: 36321557 Free PMC article.
-
Water intake and hydration state in children.Eur J Nutr. 2019 Mar;58(2):475-496. doi: 10.1007/s00394-018-1869-9. Epub 2018 Nov 30. Eur J Nutr. 2019. PMID: 30506317 Review.
Cited by
-
Water intake, hydration status and 2-year changes in cognitive performance: a prospective cohort study.BMC Med. 2023 Mar 8;21(1):82. doi: 10.1186/s12916-023-02771-4. BMC Med. 2023. PMID: 36882739 Free PMC article.
-
Water Intake and Markers of Hydration Are Related to Cardiometabolic Risk Biomarkers in Community-Dwelling Older Adults: A Cross-Sectional Analysis.J Nutr. 2021 Oct 1;151(10):3205-3213. doi: 10.1093/jn/nxab233. J Nutr. 2021. PMID: 34383920 Free PMC article.
-
Variation in urine osmolality throughout pregnancy: a longitudinal, randomized-control trial among women with overweight and obesity.Eur J Nutr. 2022 Feb;61(1):127-140. doi: 10.1007/s00394-021-02616-x. Epub 2021 Jul 3. Eur J Nutr. 2022. PMID: 34218315 Free PMC article. Clinical Trial.
-
A Cross-Sectional Study on the Association between 24-h Urine Osmolality and Weight Status in Older Adults.Nutrients. 2017 Nov 22;9(11):1272. doi: 10.3390/nu9111272. Nutrients. 2017. PMID: 29165353 Free PMC article.
-
Hydration in relation to water insecurity, heat index, and lactation status in two small-scale populations in hot-humid and hot-arid environments.Am J Hum Biol. 2021 Jan;33(1):e23447. doi: 10.1002/ajhb.23447. Epub 2020 Jun 24. Am J Hum Biol. 2021. PMID: 32583580 Free PMC article.
References
-
- Murray B Hydration and physical performance. J Am Coll Nutr 2007; 26(5 Suppl):542S–8S. - PubMed
-
- Ganio MS, Armstrong LE, Casa DJ, McDermott BP, Lee EC, Yamamoto LM, Marzano S, Lopez RM, Jimenez L, Le Bellego L, et al. Mild dehydration impairs cognitive performance and mood of men. Br J Nutr 2011;106:1535–43. - PubMed
-
- Grandjean AC, Grandjean NR. Dehydration and cognitive performance. J Am Coll Nutr 2007;26(5 Suppl):549S–54S. - PubMed
-
- Armstrong LE, Ganio MS, Casa DJ, Lee EC, McDermott BP, Klau JF, Jimenez L, Le Bellego L, Chevillotte E, Lieberman HR. Mild dehydration affects mood in healthy young women. J Nutr 2012;142:382–8. - PubMed
-
- Bear T, Philipp M, Hill S, Mündel T. A preliminary study on how hypohydration affects pain perception. Psychophysiology 2016;53:605–10. - PubMed
Publication types
MeSH terms
Substances
Grants and funding
LinkOut - more resources
Full Text Sources
Other Literature Sources
Medical
