

A ruthenium anticancer compound interacts with histones and impacts differently on epigenetic and death pathways compared to cisplatin
- PMID: 27935863
- PMCID: PMC5356824
- DOI: 10.18632/oncotarget.13711
A ruthenium anticancer compound interacts with histones and impacts differently on epigenetic and death pathways compared to cisplatin
Abstract
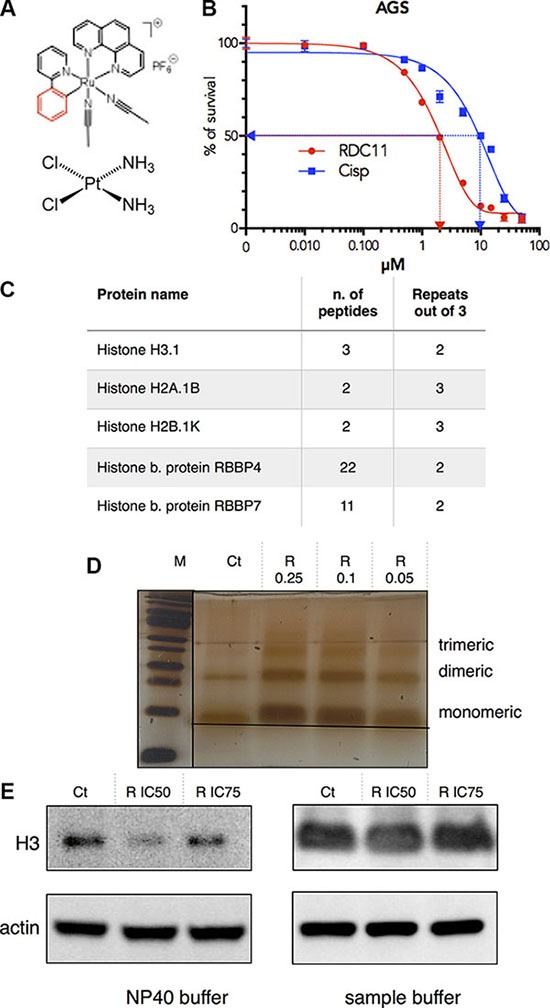
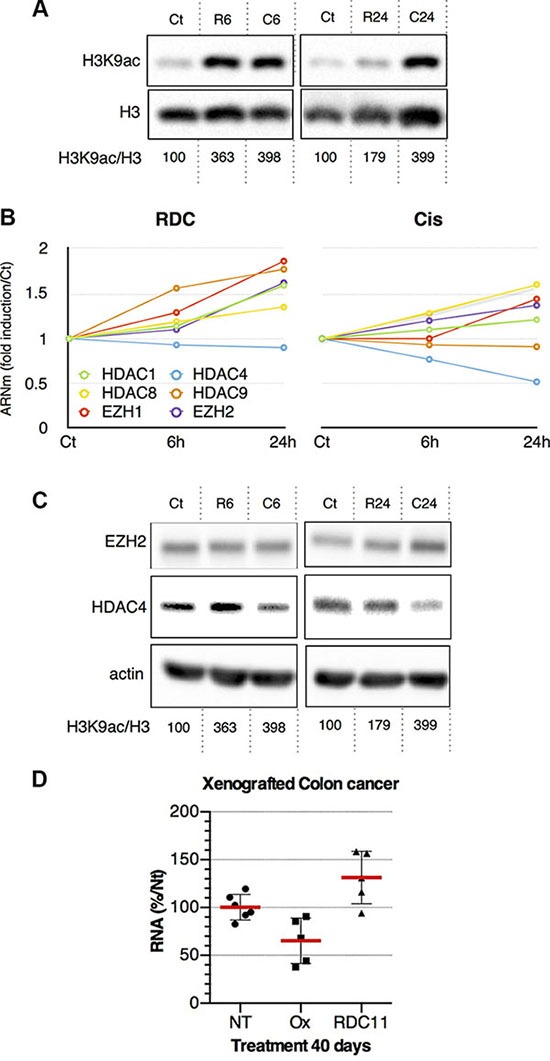
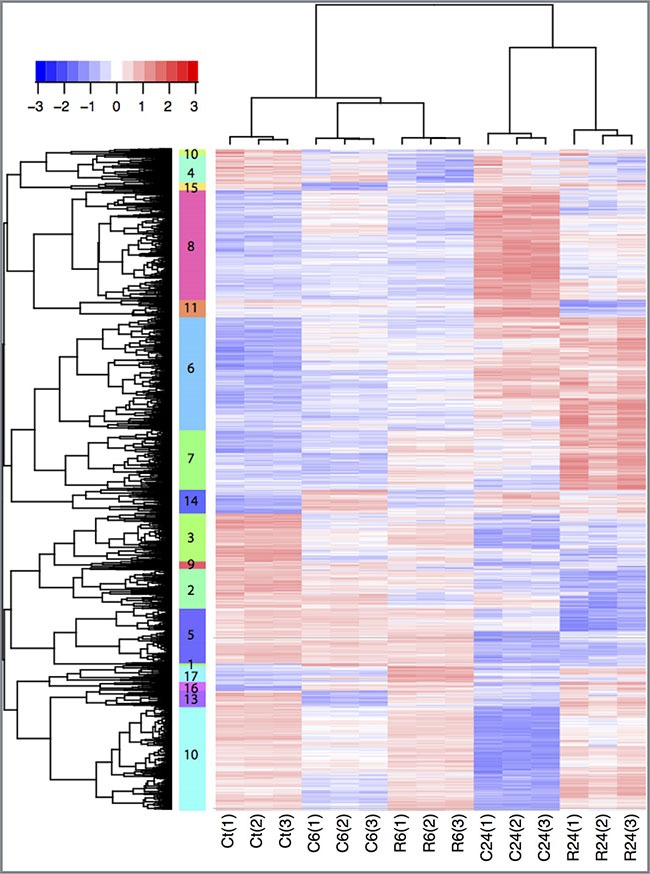
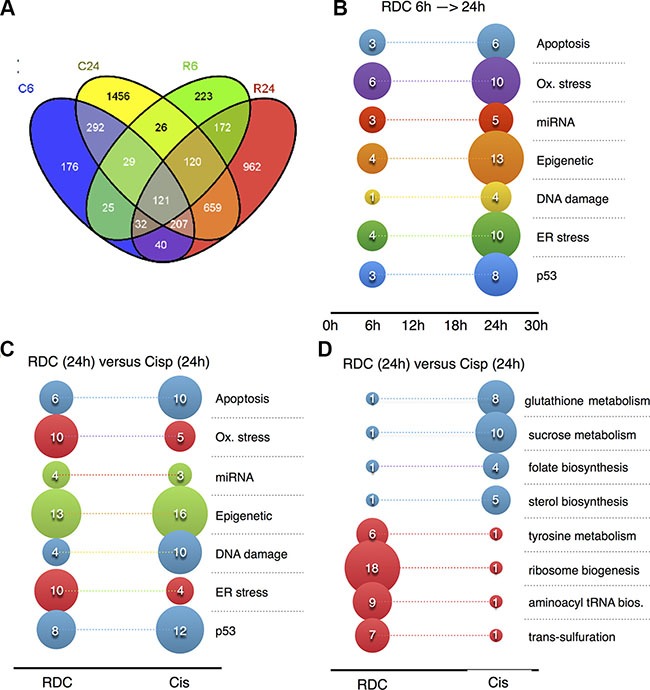
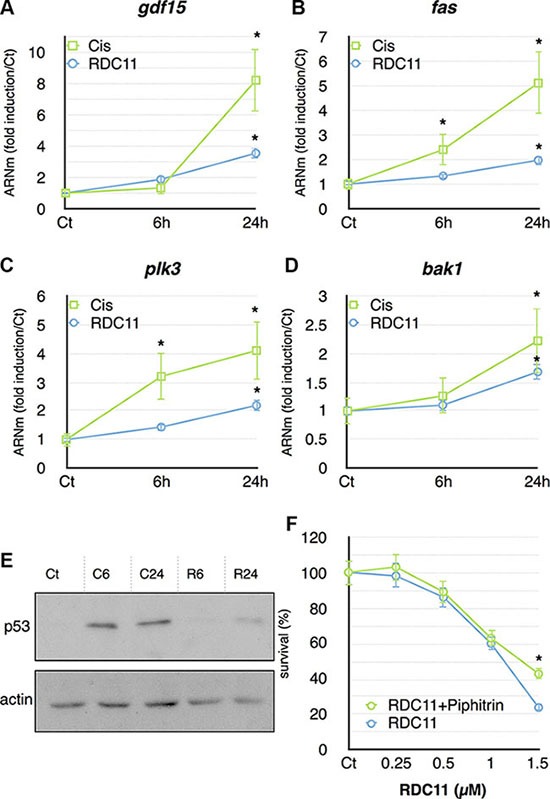
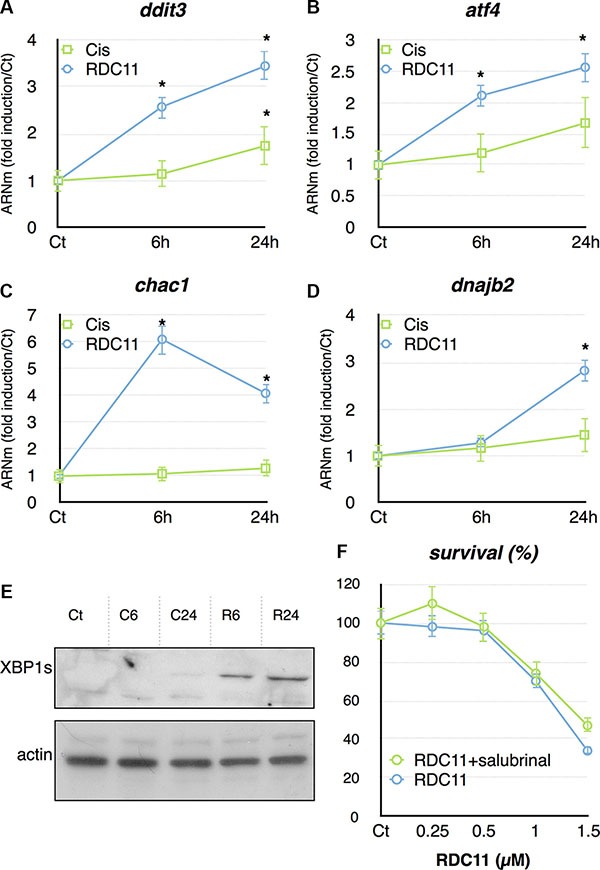
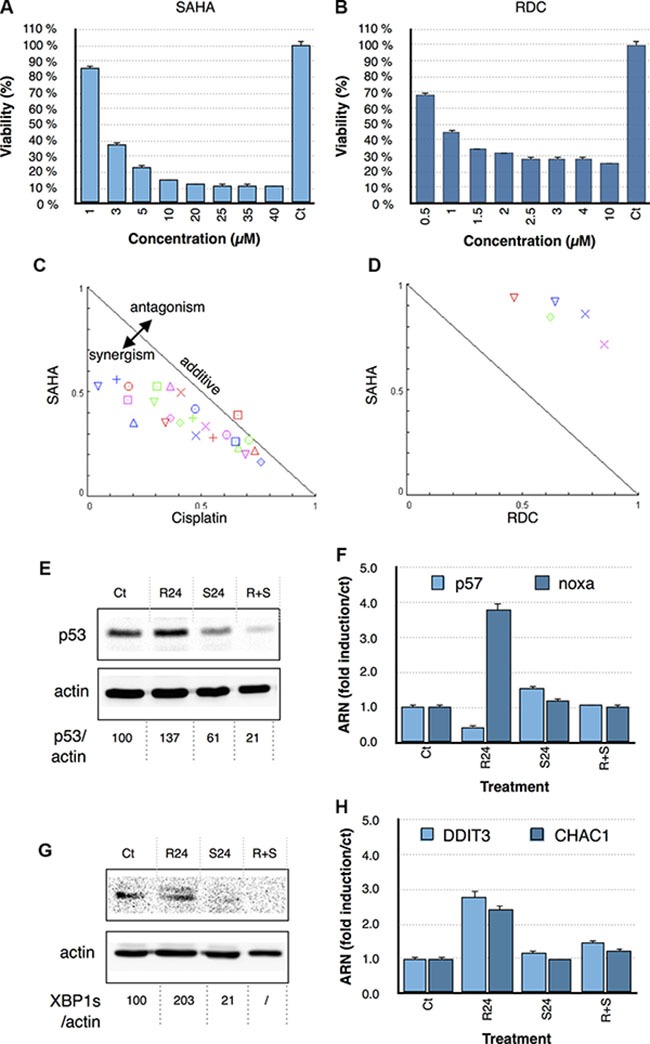
Ruthenium complexes are considered as potential replacements for platinum compounds in oncotherapy. Their clinical development is handicapped by a lack of consensus on their mode of action. In this study, we identify three histones (H3.1, H2A, H2B) as possible targets for an anticancer redox organoruthenium compound (RDC11). Using purified histones, we confirmed an interaction between the ruthenium complex and histones that impacted on histone complex formation. A comparative study of the ruthenium complex versus cisplatin showed differential epigenetic modifications on histone H3 that correlated with differential expression of histone deacetylase (HDAC) genes. We then characterized the impact of these epigenetic modifications on signaling pathways employing a transcriptomic approach. Clustering analyses showed gene expression signatures specific for cisplatin (42%) and for the ruthenium complex (30%). Signaling pathway analyses pointed to specificities distinguishing the ruthenium complex from cisplatin. For instance, cisplatin triggered preferentially p53 and folate biosynthesis while the ruthenium complex induced endoplasmic reticulum stress and trans-sulfuration pathways. To further understand the role of HDACs in these regulations, we used suberanilohydroxamic acid (SAHA) and showed that it synergized with cisplatin cytotoxicity while antagonizing the ruthenium complex activity. This study provides critical information for the characterization of signaling pathways differentiating both compounds, in particular, by the identification of a non-DNA direct target for an organoruthenium complex.
Keywords: ER stress; cisplatin; epigenetics; p53; ruthenium.
Conflict of interest statement
The authors declare no conflicts of interest.
Figures
Similar articles
-
A redox ruthenium compound directly targets PHD2 and inhibits the HIF1 pathway to reduce tumor angiogenesis independently of p53.Cancer Lett. 2019 Jan;440-441:145-155. doi: 10.1016/j.canlet.2018.09.029. Epub 2018 Oct 17. Cancer Lett. 2019. PMID: 30339780
-
Dinuclear Organoruthenium Complexes Exhibiting Antiproliferative Activity through DNA Damage and a Reactive-Oxygen-Species-Mediated Endoplasmic Reticulum Stress Pathway.Inorg Chem. 2019 Feb 4;58(3):2208-2217. doi: 10.1021/acs.inorgchem.8b03447. Epub 2019 Jan 24. Inorg Chem. 2019. PMID: 30675781
-
A ruthenium-containing organometallic compound reduces tumor growth through induction of the endoplasmic reticulum stress gene CHOP.Cancer Res. 2009 Jul 1;69(13):5458-66. doi: 10.1158/0008-5472.CAN-08-4408. Epub 2009 Jun 23. Cancer Res. 2009. PMID: 19549908
-
Bypassing the Resistance Mechanisms of the Tumor Ecosystem by Targeting the Endoplasmic Reticulum Stress Pathway Using Ruthenium- and Osmium-Based Organometallic Compounds: An Exciting Long-Term Collaboration with Dr. Michel Pfeffer.Molecules. 2021 Sep 4;26(17):5386. doi: 10.3390/molecules26175386. Molecules. 2021. PMID: 34500819 Free PMC article. Review.
-
Epigenetic therapy of cancer with histone deacetylase inhibitors.J Cancer Res Ther. 2014 Jul-Sep;10(3):469-78. doi: 10.4103/0973-1482.137937. J Cancer Res Ther. 2014. PMID: 25313724 Review.
Cited by
-
Ultrasound and Transcriptomics Identify a Differential Impact of Cisplatin and Histone Deacetylation on Tumor Structure and Microenvironment in a Patient-Derived In Vivo Model of Gastric Cancer.Pharmaceutics. 2021 Sep 16;13(9):1485. doi: 10.3390/pharmaceutics13091485. Pharmaceutics. 2021. PMID: 34575561 Free PMC article.
-
Gold(III) to Ruthenium(III) Metal Exchange in Dithiocarbamato Complexes Tunes Their Biological Mode of Action for Cytotoxicity in Cancer Cells.Molecules. 2021 Jul 3;26(13):4073. doi: 10.3390/molecules26134073. Molecules. 2021. PMID: 34279414 Free PMC article.
-
Exploring cellular uptake, accumulation and mechanism of action of a cationic Ru-based nanosystem in human preclinical models of breast cancer.Sci Rep. 2019 May 7;9(1):7006. doi: 10.1038/s41598-019-43411-3. Sci Rep. 2019. PMID: 31065032 Free PMC article.
-
The development of anticancer ruthenium(ii) complexes: from single molecule compounds to nanomaterials.Chem Soc Rev. 2017 Oct 2;46(19):5771-5804. doi: 10.1039/c7cs00195a. Chem Soc Rev. 2017. PMID: 28654103 Free PMC article. Review.
-
Screening and Preliminary Biochemical and Biological Studies of [RuCl(p-cymene)(N,N-bis(diphenylphosphino)-isopropylamine)][BF4] in Breast Cancer Models.ACS Omega. 2019 Aug 1;4(8):13005-13014. doi: 10.1021/acsomega.9b00296. eCollection 2019 Aug 20. ACS Omega. 2019. PMID: 31460427 Free PMC article.
References
-
- Jakupec MA, Galanski M, Arion VB, Hartinger CG, Keppler BK. Antitumour metal compounds: more than theme and variations. Dalton Trans. 2008:183–194. - PubMed
-
- Markman M. Toxicities of the platinum antineoplastic agents. Expert Opin Drug Saf. 2003;2:597–607. - PubMed
-
- Kelland L. The resurgence of platinum-based cancer chemotherapy. Nat Rev Cancer. 2007;7:573–584. - PubMed
-
- Allardyce CS, Dyson PJ. Ruthenium in medicine: current clinical uses and future prospects. Platinum Metals Rev. 2001;45:62.
Publication types
MeSH terms
Substances
LinkOut - more resources
Full Text Sources
Other Literature Sources
Research Materials
Miscellaneous
