. 2017 Jan 9;27(1):27-38.
doi: 10.1016/j.cub.2016.11.011. Epub 2016 Dec 8.

Adhesion-Dependent Wave Generation in Crawling Cells

Affiliations

Adhesion-Dependent Wave Generation in Crawling Cells

Erin L Barnhart et al. Curr Biol. .

Abstract

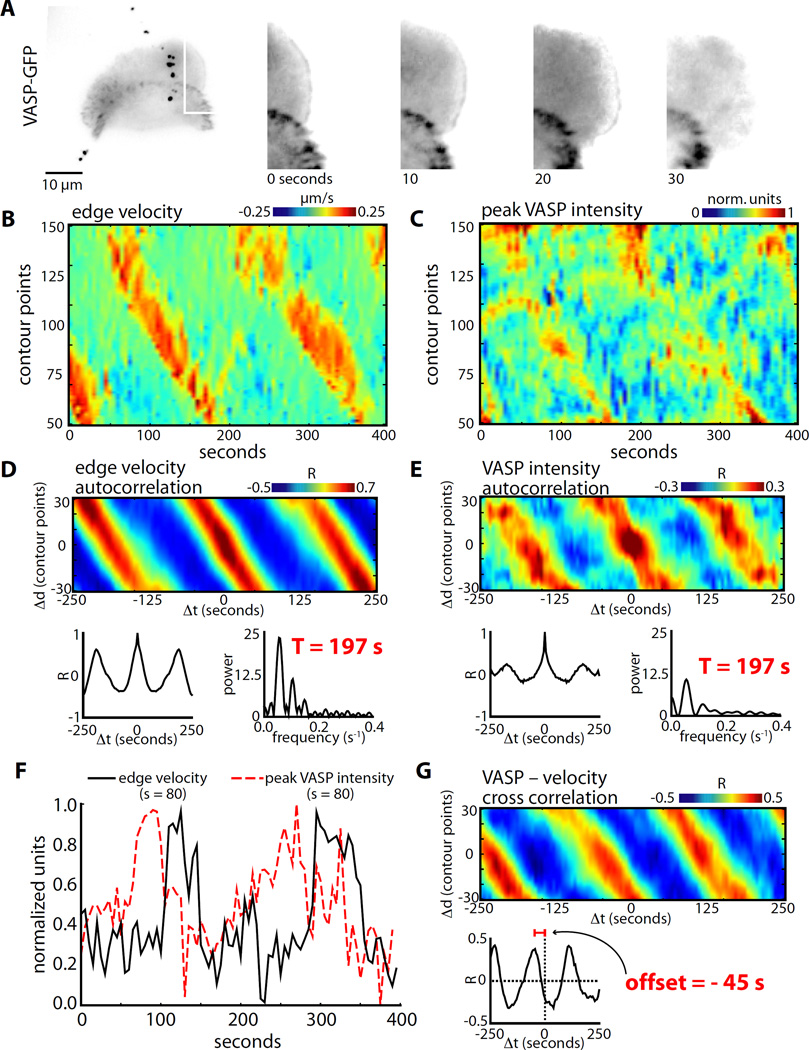
Dynamic actin networks are excitable. In migrating cells, feedback loops can amplify stochastic fluctuations in actin dynamics, often resulting in traveling waves of protrusion. The precise contributions of various molecular and mechanical interactions to wave generation have been difficult to disentangle, in part due to complex cellular morphodynamics. Here we used a relatively simple cell type-the fish epithelial keratocyte-to define a set of mechanochemical feedback loops underlying actin network excitability and wave generation. Although keratocytes are normally characterized by the persistent protrusion of a broad leading edge, increasing cell-substrate adhesion strength results in waving protrusion of a short leading edge. We show that protrusion waves are due to fluctuations in actin polymerization rates and that overexpression of VASP, an actin anti-capping protein that promotes actin polymerization, switches highly adherent keratocytes from waving to persistent protrusion. Moreover, VASP localizes both to adhesion complexes and to the leading edge. Based on these results, we developed a mathematical model for protrusion waves in which local depletion of VASP from the leading edge by adhesions-along with lateral propagation of protrusion due to the branched architecture of the actin network and negative mechanical feedback from the cell membrane-results in regular protrusion waves. Consistent with our model simulations, we show that VASP localization at the leading edge oscillates, with VASP leading-edge enrichment greatest just prior to protrusion initiation. We propose that the mechanochemical feedbacks underlying wave generation in keratocytes may constitute a general module for establishing excitable actin dynamics in other cellular contexts.

Keywords: VASP; actin dynamics; actin waves; adhesion dynamics; cell motility; excitable system; keratocyte; leading edge.


Figures

Figure 1
Figure 1. Leading edge dynamics in highly adherent keratocytes
A–L: Phase images (A,E,I), edge velocity maps (B,F,J), velocity of the center of the leading edge, plotted over time (C,G,K), and velocity of along the leading edge, plotted versus cell boundary position (D,H,L) for a representative waving (A–D), noisy (E–H) and smooth cell (I–L), all plated on highly adhesive surfaces. The edge velocity maps show the speed of the cell boundary at each point around the cell perimeter, plotted over time. Hot colors represent protrusion of the cell boundary, and cold colors represent retraction. The insets in C, G and K show the autocorrelation function for the edge velocity (top) and the power spectrum of the autocorrelation function (bottom). The period of oscillation of the leading edge for the waving cell is indicated on the power spectrum plot in red. M: The fraction of waving (gray), noisy (white), and smooth (black) cells in populations of cells plated on the indicated surfaces. N–R: Wave periods (N), duty ratios (O), protrusion fractions (P), protrusion rates (Q) and lateral propagation rates (R) for waving cells plated on surface coated with either high (N = 26 cells) or intermediate (N=3 cells) RGD densities. The red lines indicate the median. Values from only three medium adhesion cells are reported in parts n–r because a tiny fraction of medium adhesion cells exhibit traveling waves. See also Figures S1–4.
Figure 2
Figure 2. FAK inhibition prevents adhesion turnover and increases waving
A–C: Images of cells plated on either intermediate (A) or high adhesion strength surfaces (B–C) and labeled for actin with fluorescent phalloidin and immunolabled for vinculin. The cells in A and B are control cells; the cell in C was treated with 25 µM of the FAK inhibitor PF-573228 (PF). D–F: Edge velocity map (D) and velocity of the center of the leading edge for a waving cell before (E) and after (F) treatment with PF. The upper insets in E and F are the autocorrelation functions for the edge velocity, and the lower insets are the power spectrums of the autocorrelation functions. The wave period increased from 197 seconds to 301 seconds after the addition of PF. G: The fraction of waving, noisy, and smooth cells in populations of cells plated on high adhesion strength surfaces and treated with PF. H–L: Wave periods (H), duty ratios (I), protrusion fractions (J), protrusion rates (K) and lateral propagation rates (L) for control (N=26 cells) or PF-treated waving cells (N = 5 cells). The red lines indicate the median. The control measurements shown in Fig. 1M–R are shown again here in parts G–L for ease of comparison. See also Figure S5.
Figure 3
Figure 3. Cell edge velocities in waving cells correlate with actin polymerization rates, not retrograde flow rates
A–C: Fluorescence image (A), phase images (B), cell outlines (C) of a cell electroporated with fluorescent phalloidin and plated on a high adhesion strength surface. D–E: Edge velocity map (D) and edge velocity, actin polymerization, and actin retrograde flow plotted over time (E). F: Box and whisker plots showing cell edge velocity, actin polymerization rates, and actin retrograde flow rates for stalled and protruding portions of the leading edge. G: The rate of protrusion of the leading edge plotted versus the rate of lateral wave propagation.
Figure 4
Figure 4. Overexpression of VASP-GFP reduces waving
Keratocytes were transfected with a VASP-GFP construct and plated on high adhesion strength surfaces. A–B: Images of waving (A) and smooth (B) cells expressing VASP-GFP. Arrows indicate enrichment of VASP-GFP at the leading edge and VASP localization to adhesions. C–F: The relative levels of VASP intensity at the leading edge for the waving cell in A (C,E) and smooth cell in B (D,F). C and E show VASP intensity linescans indicated by the white arrows in A and B. VASP peak-to-base ratios, calculated by dividing the highest fluorescence intensity at the cell edge (peak) by the lowest intensity interior to the cell boundary (base), are indicated on the graphs. D and F show peak-to-base ratios plotted versus position along the leading edge. G–H: Bar graphs showing the fraction of the cell perimeter with a peak-to-base ratio > 1 (G) and the total VASP-GFP intensity (H) for waving, rough, and smooth cells; error bars are standard error of the mean and red asterisks indicate significant differences from the smooth population (Student's t-test, p < 0.025). Cell intensities were normalized to the mean intensity for each coverslip by subtracting the mean and dividing by the standard deviation. I: The fraction of waving, rough, and smooth cells in populations expressing either VASP-GFP or GFP alone.
Figure 5
Figure 5. Model for adhesion- and VASP-dependent traveling wave generation
A: Diagram depicting feedbacks among membrane protrusion, membrane tension, adhesions, and actin barbed ends. B: VASP molecules bind adhesions or actin barbed ends, or diffuse in the cytosol. C: Sequence of events during waving. At stalled portions of the leading edge in waving cells, accumulation of VASP increases the density of barbed ends until protrusion begins, triggering positive feedback between protrusion and the branching rate (parts i–ii). This increase in protrusion also increases membrane tension, which serves to prevent the initiation of protrusion at any other point along the leading edge, limiting the cell to a single protrusion. The lateral flow of barbed ends (due to the branched architecture of the actin network) causes protrusion to spread along the leading edge (parts ii – iv). Protrusion induces adhesion formation, resulting in the depletion of VASP from the leading edge (indicated by the red arrows in parts ii–iv) and the eventual termination of protrusion behind the wave front. Waves travel the length of the leading edge before extinguishing at the rear corners of the cell (parts iv–v). This is followed by a transient decrease in membrane tension, allowing a new wave to form at the site of initial protrusion where VASP has once again accumulated (part v).
Figure 6
Figure 6. Model simulations recapitulate adhesion- and VASP-dependent wave generation
A: Phase diagram showing average leading edge velocity as a function of two model parameters, VASP delivery rate δ and adhesion maturation rate R. Dashed lines show predicted transitions between stalled, waving, and smooth motile leading edges. Roman numerals (i) – (iv) correspond to the kymographs shown in part B. The inset to the right of the main figure shows the wave period in seconds for the region of parameter space exhibiting waves. B: Kymographs showing protrusion velocity along the leading edge over time; roman numbers correspond to values of δ and R shown in part a. Orange indicates protrusion; green indices stalled regions. C: Time series of local concentration of VASP and protrusion velocity at a particular point on the leading edge in a simulated waving cell.
Figure 7
Figure 7. VASP localization to the leading edge increases prior to protrusion initiation
A: Fluorescence images of a highly adhesive, waving cell expressing VASP-GFP. The white box indicates the region enlarged in the images on the left. B: Edge velocity map. C: Peak VASP intensity map. The highest fluorescence intensity at each point along the cell boundary is plotted over time. Hot colors indicate high fluorescence intensities and cold colors indicate low intensities. D–E: Edge velocity (D) and VASP intensity autocorrelation maps. Autocorrelation coefficients for the indicated time (Δt) and contour position (Δd) offsets are plotted for the edge velocity and VASP intensity maps shown in B and C. Hot colors indicate positive correlation, and cold colors indicate negative correlation. The graphs below the autocorrelation maps show the autocorrelation function at Δd=0 (left) and the power spectrum of the autocorrelation function (right). Edge velocity and VASP intensity at the cell edge both oscillated with a period of 197 seconds. F: Velocity (black line) and VASP intensity (dashed red line) at the same point along the leading edge, plotted over time. G: Edge velocity and VASP-GFP cross correlation map. Cross correlation coefficients for the edge velocity and VASP intensity maps shown in B and C are plotted at the indicated time and distance offsets. The graph below the cross correlation map shows the cross correlation function at Δd=0. The offset of −45 seconds indicates that VASP localization at the leading edge increases prior to protrusion of the leading edge. See also Figures S6–7.

Comment in

References

    1. Ridley AJ. Life at the leading edge. Cell. 2011;145:1012–1022. - PubMed
    1. Giannone G, Dubin-Thaler B, Dobereiner H-G, Kieffer N, Bresnick A, Sheetz M. Periodic lamellipodial contractions correlate with rearward actin waves. Cell. 2004;116:431–443. - PubMed
    1. Machacek M, Danuser G. Morphodynamic profiling of protrusion phenotypes. Biophys. J. 2006;90:1439–1452. - PMC - PubMed
    1. Burnette D, Manley S, Sengupta P, Sougrat R, Davidson M, Kachar B, Lippincott-Schwartz J. A role for actin arcs in the leading edge advance of migrating cells. Nat. Cell Biol. 2011;13:371–381. - PMC - PubMed
    1. Döbereiner H-G, Dubin-Thaler BJ, Hofman JM, Xenias HS, Sims TN, Giannone G, Dustin ML, Wiggins CH, Sheetz MP. Lateral membrane waves constitute a universal dynamic pattern of motile cells. Phys. Rev. Lett. 2006;97:038102. - PubMed