. 2017 Mar;23(3):378-394.
doi: 10.1261/rna.058040.116. Epub 2016 Dec 9.

Inhibition of nonsense-mediated RNA decay by ER stress

Affiliations

Inhibition of nonsense-mediated RNA decay by ER stress

Zhelin Li et al. RNA. 2017 Mar.

Abstract

Nonsense-mediated RNA decay (NMD) selectively degrades mutated and aberrantly processed transcripts that contain premature termination codons (PTC). Cellular NMD activity is typically assessed using exogenous PTC-containing reporters. We overcame some inherently problematic aspects of assaying endogenous targets and developed a broadly applicable strategy to reliably and easily monitor changes in cellular NMD activity. Our new method was genetically validated for distinguishing NMD regulation from transcriptional control and alternative splicing regulation, and unexpectedly disclosed a different sensitivity of NMD targets to NMD inhibition. Applying this robust method for screening, we identified NMD-inhibiting stressors but also found that NMD inactivation was not universal to cellular stresses. The high sensitivity and broad dynamic range of our method revealed a strong correlation between NMD inhibition, endoplasmic reticulum (ER) stress, and polysome disassembly upon thapsigargin treatment in a temporal and dose-dependent manner. We found little evidence of calcium signaling mediating thapsigargin-induced NMD inhibition. Instead, we discovered that of the three unfolded protein response (UPR) pathways activated by thapsigargin, mainly protein kinase RNA-like endoplasmic reticulum kinase (PERK) was required for NMD inhibition. Finally, we showed that ER stress compounded TDP-43 depletion in the up-regulation of NMD isoforms that had been implicated in the pathogenic mechanisms of amyotrophic lateral sclerosis and frontotemporal dementia, and that the additive effect of ER stress was completely blocked by PERK deficiency.

Keywords: ALS; ATF6α; FTD; Hnrnpl; IREα; NMD; PERK; Psd-95; Ptbp1; Ptbp2; Srsf11; Tdp-43; Tra2b; UPR; Upf2; alternative splicing; cellular stress; cryptic splicing.


Figures

FIGURE 1.
FIGURE 1.
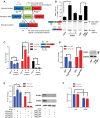
A new quantitative method, distinct from alternative splicing assays, distinguishes NMD activity from alternative splicing and transcriptional regulation. (A) Schematics of the RT-qPCR method specifically detecting alternative splicing isoforms. The NMD isoform can be either the inclusion or exclusion isoform, while the other isoform is designated as the non-NMD isoform. The inclusion isoform is detected by primer F1 and isoform-specific primer R1. The exclusion isoform is detected by F2 and isoform-specific junction primer R2. Primers F3 and R3 are commonly used in alternative splicing assays to detect both inclusion and exclusion isoforms. (B) Conventional splicing assay to derive expression ratios of the Psd-95 NMD isoform relative to the non-NMD isoform in N2a cells depleted of UPF1 using two independent siRNAs or N2a cells overexpressing PTBP1. The ratios by themselves do not distinguish NMD regulation from alternative splicing regulation. Representative digital gel images are shown in the lower panel. A one-way ANOVA test was used to determine significant ratio changes between different samples, followed by a Tukey's multiple comparison test. N = 3. (C) RT-qPCR analysis of the Upf1 deficient cells as in B but using different primers specific to the Psd-95 non-NMD isoform and Psd-95 NMD (NPsd-95) isoform along with validation of the siUpf1 knockdown efficiency. (D) RT-qPCR analysis of the PTBP1-overexpressing cells as in B but using different primers specific to the Psd-95 isoforms described in C. Western blots (right panel) of the samples transfected with GFP and Flag-PTBP1 plasmids. Arrow: Flag-PTBP1; arrowheads: endogenous PTBP1 proteins that are down-regulated by PTBP1 overexpression. (E) Responses of the two Psd-95 isoforms to double knockdown of PTBP1 and PTBP2 in N2a cells assayed by RT-qPCR. Right panel shows the Western blots verifying the knockdown efficiencies. (F) RT-qPCR analysis of the two Psd-95 isoforms 4 h after 4 µg/µL actinomycin D treatment. (CF) A two-way ANOVA test followed by Dunnett's multiple comparison tests was used to determine significant expression changes between samples. (*) P < 0.05. Error bars represent mean ± SEM.
FIGURE 2.
FIGURE 2.
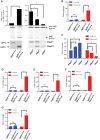
The new method distinguishes NMD activity from alternative splicing regulation in animal samples. (A) Alternative splicing assay of the Psd-95 NMD and non-NMD isoforms in Upf2 conditional knockout cortices (left panel) and Ptbp2 null cortices (right panel). (Lower left panel) Western blot of UPF2 in Upf2loxP/lox and Upf2loxP/loxP; Emx1-cre cortices. The Upf2 conditional knockout cortices produce truncated UPF2 proteins (ΔUPF2). (Lower right panel) Genotyping of Ptbp2 animals. Statistics were calculated using a two-tailed unpaired Student's t-test for the Upf2 knockout samples (N = 2) and a one-way ANOVA test followed by Tukey's multiple comparison test for the Ptbp2 mutant samples (Ptbp2+/+ and Ptbp2+/−, N = 2; Ptbp2−/−, N = 4). (B,C) RT-qPCR analysis of the samples shown in A for individual expression of the Psd-95 non-NMD isoform and Psd-95 NMD (NPsd-95) isoform. (DG) Expression levels of both NMD and non-NMD isoforms of Ptbp2, Tra2b, Hnrnpl, and Srsf11 in Upf2 knockout cortices relative to wild type. (BG) A two-way ANOVA test followed by Dunnett's multiple comparison tests was used to determine significant expression changes between samples. (*) P < 0.05; (ns) not significant. Error bars represent mean ± SEM.
FIGURE 3.
FIGURE 3.
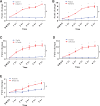
Thapsigargin specifically enhances the endogenous NMD targets. (AE) Temporal expression of NMD isoforms (red lines) and non-NMD isoforms (blue lines) of Srsf11, Ptbp2, Tra2b, Hnrnpl, and Psd-95 upon 0.2 µM thapsigargin treatment. Expression levels are normalized to DMSO-treated samples. A two-way ANOVA test was used to determine significant difference of expression between the two isoforms. (#) P < 0.05. Dunnett's multiple comparison tests were used to determine significant expression changes of individual isoforms over time relative to DMSO treatment. (*) P < 0.05. N = 3. Error bars represent mean ± SEM.
FIGURE 4.
FIGURE 4.
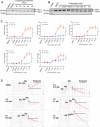
Dose-dependent correlation between ER stress, polysome disassembly, and NMD inhibition upon thapsigargin treatment. (A) Time course analysis of Xbp1 splicing upon application of 0.2 µM thapsigargin in N2a cells. N = 3. (B) Thapsigargin dose-dependent Xbp1 splicing in N2a cells at 5 h after treatment. N = 3. (C) Thapsigargin dose-dependent expression of the NMD (red lines) and non-NMD (blue lines) isoforms of Srsf11, Ptbp2, Tra2b, Hnrnpl, and Psd-95 in N2a cells at 5 h after treatment. A two-way ANOVA test was used to determine the significant difference between the two isoforms. (#) P < 0.05. Dunnett's multiple comparison tests were used to determine significant expression changes of individual isoforms after thapsigargin treatment in comparison to DMSO treatment. (*) P < 0.05. N = 3. Error bars represent mean ± SEM. (D) Polysome fractionation graphs of N2a cells at 5 h after treatment with DMSO, 0.01 µM, 0.02 µM, 0.05 µM, 0.1 µM, and 0.2 µM thapsigargin (TG). 40S, 60S, 80S, disome (black arrow) and polysome are labeled accordingly. In each graph, a red line is drawn from the disome peak to the peak of the eight-ribosome fraction.
FIGURE 5.
FIGURE 5.
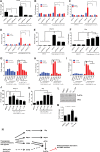
PERK is necessary for thapsigargin-induced NMD inhibition. Expression levels of Perk (A); the NMD (red) and non-NMD (blue) isoforms of Psd-95 (B), Ptbp2 (C), and Tra2b (D); Xbp1s (E); and Bip (F) after siPerk knockdown and thapsigargin treatment. Control siRNA and two different siRNAs targeting Perk were transfected into N2a cells for 48 h before thapsigargin application. Note that the thapsigargin effect on the NMD isoforms was completely blocked by siPerk transfection (BD). Expression levels of the NMD (red) and non-NMD (blue) isoforms of Psd-95 (G), Ptbp2 (H), and Tra2b (I) as well as Xbp1s (J) and Bip (K) in N2a cells treated with DMSO, thapsigargin, or thapsigargin plus PERK inhibitor GSK2606414 at various concentrations. A concentration of 0.1 µM GSK2606414 or above was sufficient to revert the effect of thapsigargin on the NMD isoforms (GI). (L) Western blots of phosphorylated eIF2α (P-eIF2α) and total eIF2α in cells treated with DMSO, DMEM, 0.2 µM thapsigargin (TG), and 0.3 µM GSK2606414 (GSK) plus TG. (M) Quantification of L using the intensity ratio of P-eIF2α over total eIF2α. N = 2. (N) Schematics of the proposed mechanism of thapsigargin and other stressors leading to NMD inhibition. A one-way ANOVA test was used for A, E, F, J, and K. A two-way ANOVA test followed by Dunnett's multiple comparison tests was used for B, C, D, G, H, and I. (*) P < 0.05; (ns) not significant. N = 3. Error bars represent mean ± SEM.
FIGURE 6.
FIGURE 6.
Thapsigargin enhances TDP-43-repressed NMD isoforms through PERK. The expression levels of Tdp-43 (A) and Perk (B) in N2a cells transfected with control siRNA, siTdp43, and/or siPerk and subsequently treated with DMSO or 0.2 µM thapsigargin. These cells were also assayed for the expression of the normal and NMD isoforms of A230046K03Rik (C), Mib1 (D), and Ups15 (E). Representative digital gels are shown in the lower panels. Arrows point to the NMD and normal isoforms. The ratio of the NMD isoform relative to the normal isoform was quantified for each gene under each experimental condition (upper panels). In siTdp43 cells, thapsigargin further increased the ratios. In siTdp43 and siPerk double-knockdown cells, thapsigargin had no effect on the ratios compared to DMSO. (ns) P ≥ 0.05; (*) P < 0.05 (two-way ANOVA followed by Dunnett's multiple comparison tests). All error bars represent mean ± SEM. N = 3.

Similar articles

Cited by

References

    1. Arai T, Hasegawa M, Akiyama H, Ikeda K, Nonaka T, Mori H, Mann D, Tsuchiya K, Yoshida M, Hashizume Y, et al. 2006. TDP-43 is a component of ubiquitin-positive τ-negative inclusions in frontotemporal lobar degeneration and amyotrophic lateral sclerosis. Biochem Biophys Res Commun 351: 602–611. - PubMed
    1. Axten JM, Medina JR, Feng Y, Shu A, Romeril SP, Grant SW, Li WHH, Heerding DA, Minthorn E, Mencken T, et al. 2012. Discovery of 7-methyl-5-(1-[3-(trifluoromethyl)phenyl]acetyl-2,3-dihydro-1H-indol-5-yl)-7H-pyrrolo[2,3-d]pyrimidin-4-amine (GSK2606414), a potent and selective first-in-class inhibitor of protein kinase R (PKR)-like endoplasmic reticulum kinase (PERK). J Med Chem 55: 7193–7207. - PubMed
    1. Barmada SJ, Ju S, Arjun A, Batarse A, Archbold HC, Peisach D, Li X, Zhang Y, Tank EMH, Qiu H, et al. 2015. Amelioration of toxicity in neuronal models of amyotrophic lateral sclerosis by hUPF1. Proc Natl Acad Sci 112: 7821–7826. - PMC - PubMed
    1. Boutz PL, Stoilov P, Li Q, Lin C-H, Chawla G, Ostrow K, Shiue L, Ares M Jr, Black DL. 2007. A post-transcriptional regulatory switch in polypyrimidine tract-binding proteins reprograms alternative splicing in developing neurons. Genes Dev 21: 1636–1652. - PMC - PubMed
    1. Calfon M, Zeng H, Urano F, Till JH, Hubbard SR, Harding HP, Clark SG, Ron D. 2002. IRE1 couples endoplasmic reticulum load to secretory capacity by processing the XBP-1 mRNA. Nature 415: 92–96. - PubMed

MeSH terms

Substances

LinkOut - more resources