

Hair follicle stem cell cultures reveal self-organizing plasticity of stem cells and their progeny
- PMID: 27940653
- PMCID: PMC5242381
- DOI: 10.15252/embj.201694902
Hair follicle stem cell cultures reveal self-organizing plasticity of stem cells and their progeny
Abstract
Understanding how complex tissues are formed, maintained, and regenerated through local growth, differentiation, and remodeling requires knowledge on how single-cell behaviors are coordinated on the population level. The self-renewing hair follicle, maintained by a distinct stem cell population, represents an excellent paradigm to address this question. A major obstacle in mechanistic understanding of hair follicle stem cell (HFSC) regulation has been the lack of a culture system that recapitulates HFSC behavior while allowing their precise monitoring and manipulation. Here, we establish an in vitro culture system based on a 3D extracellular matrix environment and defined soluble factors, which for the first time allows expansion and long-term maintenance of murine multipotent HFSCs in the absence of heterologous cell types. Strikingly, this scheme promotes de novo generation of HFSCs from non-HFSCs and vice versa in a dynamic self-organizing process. This bidirectional interconversion of HFSCs and their progeny drives the system into a population equilibrium state. Our study uncovers regulatory dynamics by which phenotypic plasticity of cells drives population-level homeostasis within a niche, and provides a discovery tool for studies on adult stem cell fate.
Keywords: differentiation; hair follicle stem cells; niche; reprogramming; stem cell cultures.
© 2016 The Authors.
Figures
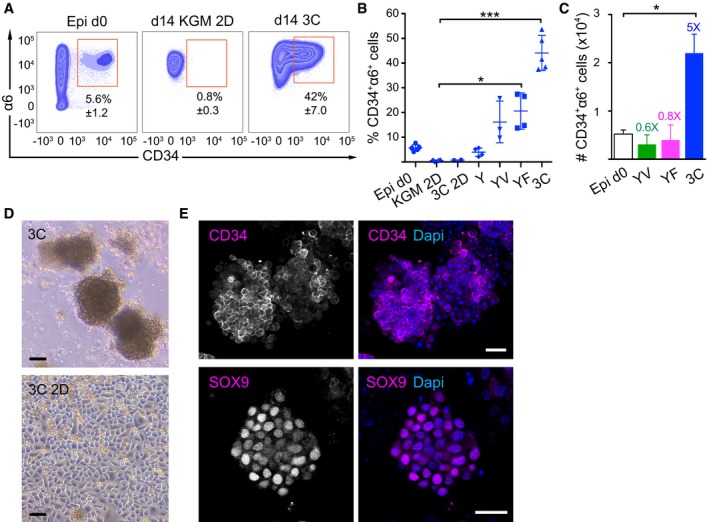
Representative FACS plots of freshly isolated epidermal cells (Epi d0) and day 14 (d14) cultures of epidermal cells in different growth conditions and media. KGM 2D: 2D in basal KGM; 3C: 3D‐Matrigel in KGM + Y27632 + VEGF‐A + FGF‐2.
CD34+α6+ cells were quantified by flow cytometry from d14 as in panel (A) (mean ± SD; n = 3–5; *P ≤ 0.05; ***P ≤ 0.001, Kruskal–Wallis/Dunn's post‐test). 3C 2D: 2D in KGM + Y27632 + VEGF‐A + FGF‐2; Y: 3D‐Matrigel in KGM + Y27632; YV: Y + VEGF‐A; YF: Y + FGF‐2; 3C: Y + VEGF‐A + FGF‐2.
Absolute numbers of CD34+α6+ cells from Epi d0 and d14 cultures as in (A and B). Fold enrichment over Epi d0 is shown (mean ± SEM, n = 3–5; *P ≤ 0.05, Mann–Whitney U‐test).
Epidermal cells grown for 14 days in the indicated conditions. 3C: 3D‐Matrigel in KGM + Y27632 + VEGF‐A + FGF‐2. 3C 2D: 2D in 3C medium. Scale bars 30 μm.
Immunofluorescence analysis of 3C cultures showing the expression of the HFSC markers CD34 and SOX9 in a subset of cells. Scale bars 25 μm. See also Appendix Fig S1.
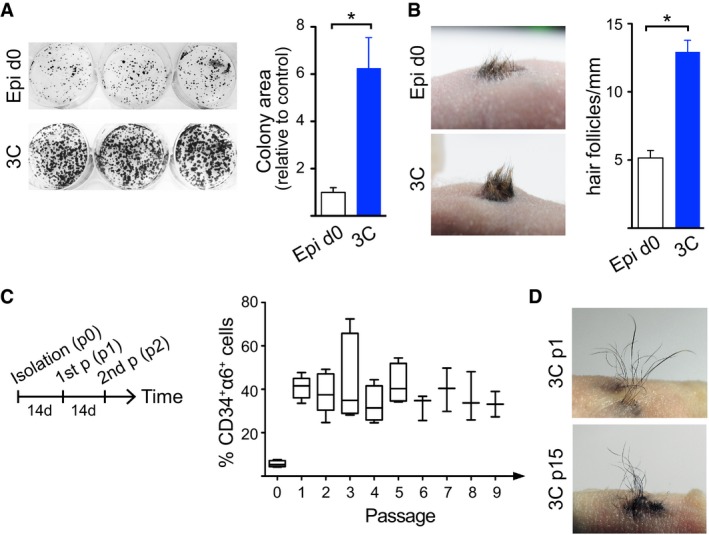
Colony‐forming assays show increased proliferative potential of cells cultured in 3C compared to freshly isolated epidermal cells (Epi d0; control; mean ± SEM; n = 5; *P ≤ 0.05, Mann–Whitney U‐test). 3C: 3D‐Matrigel in KGM + Y27632 + VEGF‐A + FGF‐2.
Full‐thickness skin reconstitution assay with freshly isolated epidermal cells (Epi d0) or 3C cultures shows that cells cultured in 3C retain their self‐renewal capacity and multipotency. A representative recipient of four mice/condition is shown. Right panel shows quantification of hair follicle density. Note that 3C cultures give rise to more hair compared to controls (mean ± SEM; n = 4; *P ≤ 0.05, Mann–Whitney U‐test).
Long‐term culture of cells in 3C was performed as shown in the left panel. 3C cultures maintain a stable population of CD34+α6+ long term (data are shown using a box‐and‐whisker plot: box indicates 25th and 75th percentiles; error bars represent 10th and 90th percentiles; middle line is the median; n = 3–5 independent experiments). p: passage.
Full‐thickness skin reconstitution assay using 3C cells from passage 1 (p1) and passage 15 (p15) shows that cells cultured in 3C maintain their multipotency and self‐renewal capacity in long‐term cultures. A representative recipient of four mice/condition is shown. See also Appendix Fig S2.
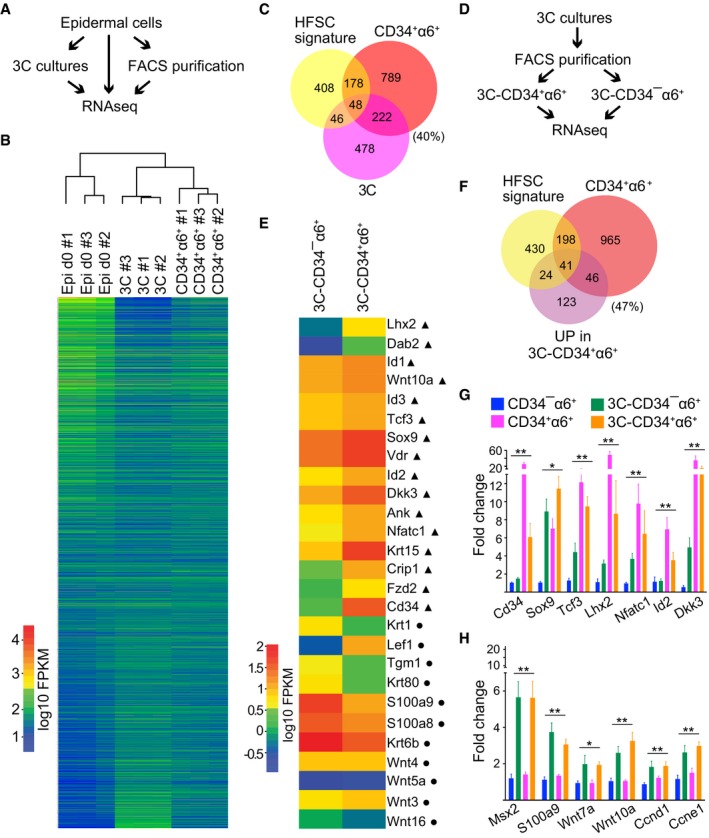
Schematic workflow of the RNAseq experiment from FACS‐purified CD34+α6+ HFSCs (CD34+α6+), cells cultured in 3C and freshly isolated epidermal cells (Epi d0).
Heatmap and Euclidian distance dendrogram of quantified transcripts from RNAseq data generated as shown in panel (A). 3C cultures cluster with purified CD34+α6+ HFSCs (n = 3 biological replicates).
Venn diagram of genes most significantly upregulated in 3C and in purified CD34+α6+ (log2FC > 2, padj < 0.05) together with published HFSC signature shows significant overlap between the three signatures (P = 0.00252451 and P = 3.058928e‐51, hypergeometric distribution).
Schematic workflow of the RNAseq experiment from FACS‐purified CD34+α6+ and CD34−α6+ cells from 3C cultures.
Heatmap of selected genes differentially expressed in 3C‐CD34+α6+ and 3C‐CD34−α6+ cells. Note upregulation of multiple key HFSC lineage identity transcription factors and bulge markers (triangles) in 3C‐CD34+α6+ cells, and upregulation of genes implicated in lineage progression in 3C‐CD34−α6+ cells (circles).
Venn diagram of genes upregulated in 3C‐CD34+α6+ and in purified CD34+α6+ cells (log2FC > 2, padj < 0.05) together with a published HFSC signature shows significant overlap between the three groups (P = 1.381896e‐09 and P = 0.01636903, hypergeometric distribution).
RT–qPCR analyses of FACS‐purified CD34+α6+ and CD34−α6+ cells from either 3C cultures or from freshly isolated epidermis show upregulation of HFSC identity genes in both freshly isolated and 3C‐CD34+α6+ cells compared to freshly isolated CD34−α6+ progenitors. 3C‐CD34−α6+ cells show intermediated expression (mean ± SEM; n = 4; *P ≤ 0.05, **P ≤ 0.01, Kruskal–Wallis).
Both 3C‐CD34+α6+ and 3C‐CD34−α6+ cells show upregulation of a panel of cell cycle genes and genes shown to be enriched in HFSC progeny (mean ± SEM; n = 4; *P ≤ 0.05, **P ≤ 0.01, Kruskal–Wallis). See also Appendix Fig S3 and Datasets EV1, EV2, and EV3.
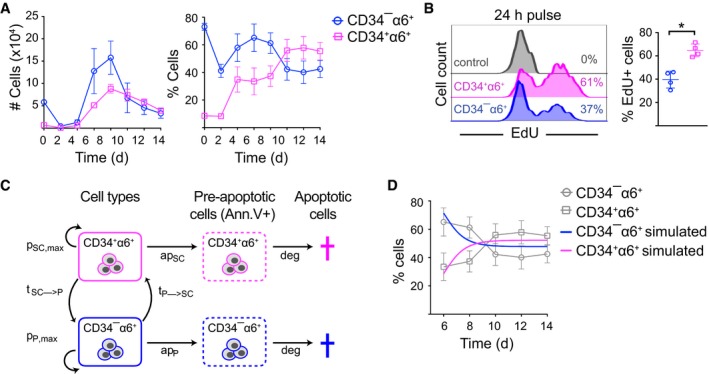
FACS analysis of CD34+α6+ cells over time shows that 3C cultures reach a ˜50:50 population equilibrium after 10 days of culture (mean ± SEM; n = 3).
Cells were EdU‐labeled for 24 h (day 10–11) prior to analysis by flow cytometry to quantify proliferating cells. Percentage of EdU+ cells is indicated (n = 4; mean ± SD; *P ≤ 0.05, Mann–Whitney U‐test).
Schematic illustration of the parameters used in the mathematical model. HFSCs (CD34+α6+) and non‐HFSCs (CD34−α6+) have a maximum proliferation rate of pSC,max and pP,max, respectively. They enter apoptosis with rates apSC and apP and are both degraded with a rate deg. Non‐HFSCs can convert to HFSCs with a rate tP→SC and vice versa with rate tSC→P.
Simulated population proportions of CD34+α6+ HFSCs and CD34−α6+ non‐HFSCs derived from the mathematical model describing steady‐state cultures. Experimental data from (A) are shown as reference (in gray) (mean ± SEM; n = 3). See also Appendix Fig S4 and Dataset EV4.
- A
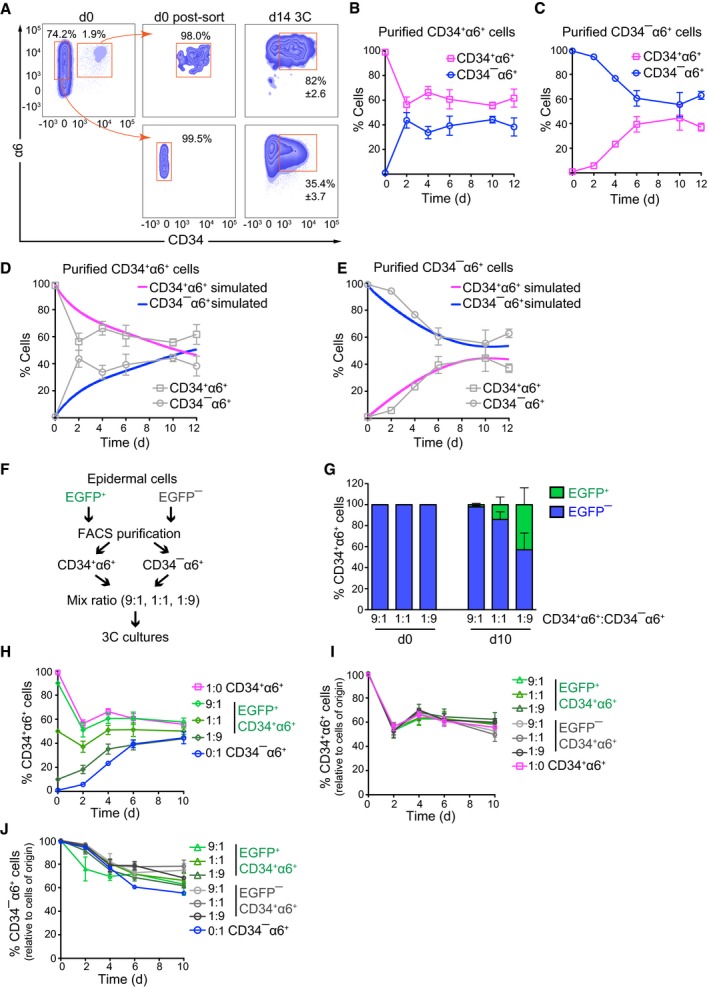
CD34+α6+ HFSCs and CD34−α6+ non‐HFSCs were FACS‐purified from total epidermis (d0) to ≥ 98% purity post‐sorting (d0 post‐sort), and grown 14 days in 3C cultures (d14 3C). A significant population of CD34+α6+ HFSCs and CD34−α6+ non‐HFSCs is generated from both purified populations after 14 days. A representative of three independent experiments is shown (mean ± SD).
- B, C
Time course analyses of 3C cultures established from FACS‐purified populations of CD34+α6+ HFSCs (B) or CD34−α6+ non‐HFSCs (C) from 3C cultures. Both cultures reach population equilibrium between day 6 and 10 (n = 4; mean ± SD).
- D, E
Simulated population proportions of CD34+α6+ HFSCs (D) and CD34−α6+ non‐HFSCs (E) from the mathematical model describing behavior of pure cell populations. The model parameters were estimated from the experimental data in (B, C; shown in gray as reference).
- F
Schematic illustration of lineage‐tracing experiments.
- G
Lineage tracing of FACS‐purified CD34+α6+ HFSCs and CD34−α6+ non‐HFSCs from EGFP− and EGFP+ 3C cultures, respectively. CD34+α6+ and CD34−α6+ were mixed at the indicated ratios at d0, and EGFP expression was used to trace the cells of origin over time by flow cytometry. Presence of CD34+α6+ EGFP+ cells in cultures at d10 indicates non‐HFSC to HFSC interconversion.
- H
Lineage tracing as in (F) shows that 3C cultures reach equilibrium between day 6 and 10 independent of the initial proportions of HFSCs and non‐HFSCs.
- I
Quantification of the proportion of CD34+α6+ cells that maintain their fate over time (experiments with both EGFP+ and EGFP− labeled cells are indicated).
- J
Quantification of the proportion of CD34−α6+ cells that maintain their fate over time (experiments with both EGFP+ and EGFP− labeled cells are indicated).
- A, B
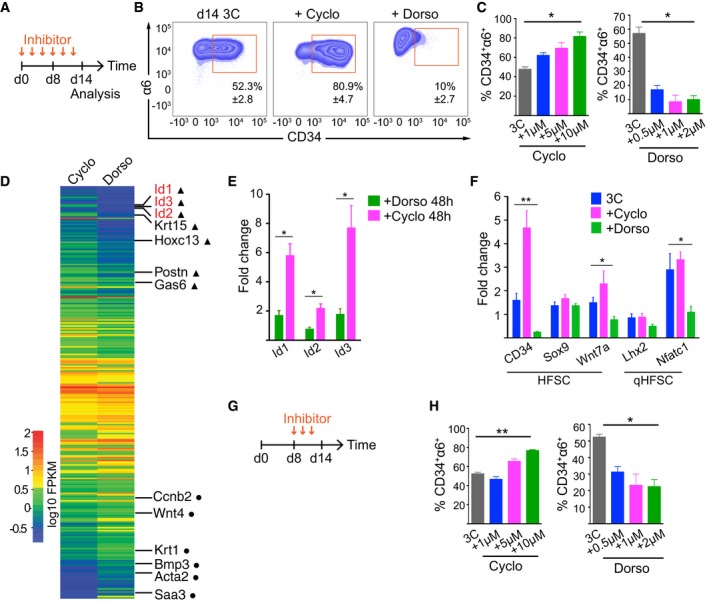
Inhibitor treatment scheme (A) and FACS plots (B) of 3C cultures treated with the Shh inhibitor cyclopamine or the BMP inhibitor dorsomorphin (mean ± SD; n = 3).
- C
Quantification of experiments as in (B) shows enrichment of HFSCs upon cyclopamine (Cyclo) treatment, whereas dorsomorphin (Dorso) treatment leads to depletion of HFSCs (mean ± SD; n = 3; *P ≤ 0.05, Kruskal–Wallis).
- D
Heatmap of significantly (padj value < 0.05) differentially expressed genes from RNAseq analysis of 3C cultures treated with Cyclo or Dorso for 48 h. HFSC identity genes (triangles) and genes implicated in HFSC lineage progression (circles) are indicated.
- E
RT–qPCR analysis of 3C cultures treated as in (D) confirms that Id 1,2, and 3 are significantly upregulated in Cyclo‐treated cells (mean ± SEM; n = 4; *P ≤ 0.05, Mann–Whitney U‐test).
- F
RT–qPCR analysis of 3C cultures treated as in (A) shows upregulation of HFSC identity genes upon cyclopamine treatment whereas regulators of HFSC quiescence are downregulated upon dorsomorphin treatment (mean ± SEM; n = 4; *P ≤ 0.05, **P ≤ 0.01, Kruskal–Wallis).
- G
Inhibitor treatment scheme of 3C cultures treated from day 8 onward.
- H
Quantification of experiments as in (G) (mean ± SD; n = 3–4; *P ≤ 0.05, **P ≤ 0.01, Kruskal–Wallis). See also Appendix Fig S6 and Dataset EV5.
Comment in
-
Maintaining hair follicle stem cell identity in a dish.EMBO J. 2017 Jan 17;36(2):132-134. doi: 10.15252/embj.201696051. Epub 2016 Dec 21. EMBO J. 2017. PMID: 28003314 Free PMC article.
References
-
- Ben Bolker and R Development Core Team (2016) bbmle: Tools for General Maximum Likelihood Estimation. R package version 1.0.18. URL http://CRAN.R-project.org/package=bbmle
-
- Bilousova G, Roop DR (2013) Generation of functional multipotent keratinocytes from mouse induced pluripotent stem cells. Methods Mol Biol 961: 337–350 - PubMed
Publication types
MeSH terms
LinkOut - more resources
Full Text Sources
Other Literature Sources
Medical
Molecular Biology Databases
