. 2017 Jan 15;198(2):657-668.
doi: 10.4049/jimmunol.1601301. Epub 2016 Dec 9.

Endogenous Nur77 Is a Specific Indicator of Antigen Receptor Signaling in Human T and B Cells

Affiliations

Endogenous Nur77 Is a Specific Indicator of Antigen Receptor Signaling in Human T and B Cells

Judith F Ashouri et al. J Immunol. .

Abstract

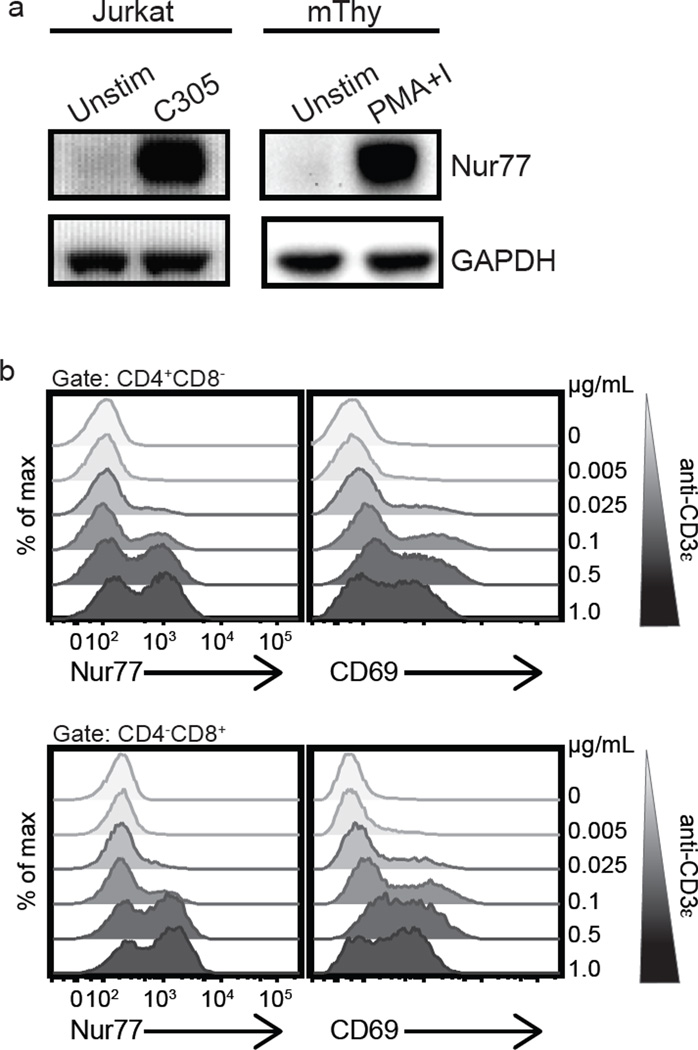
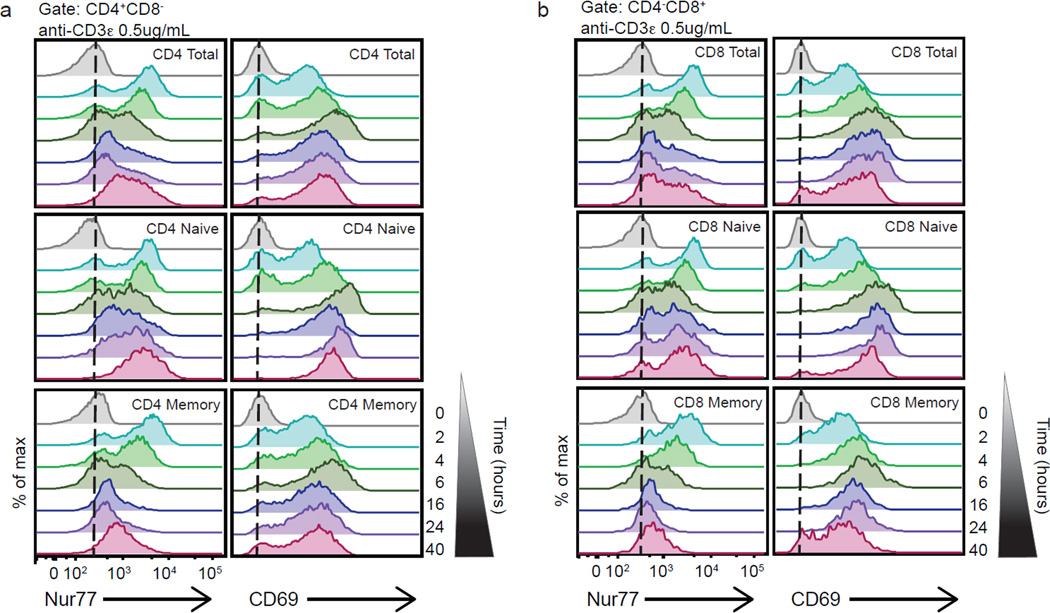
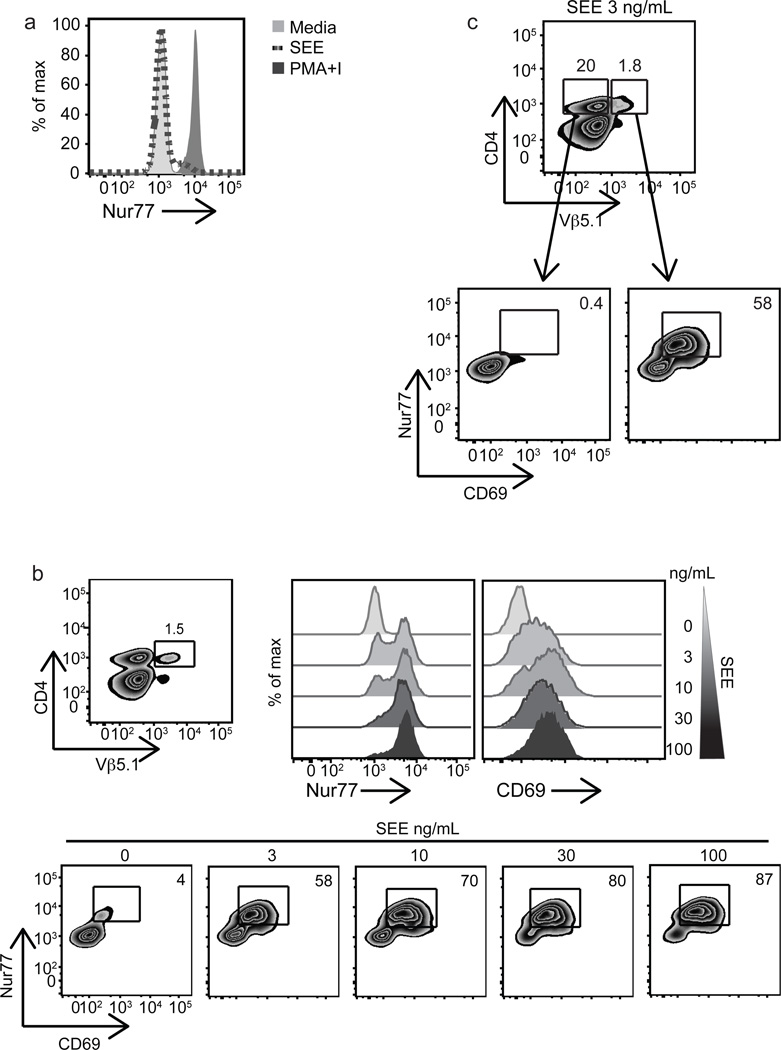
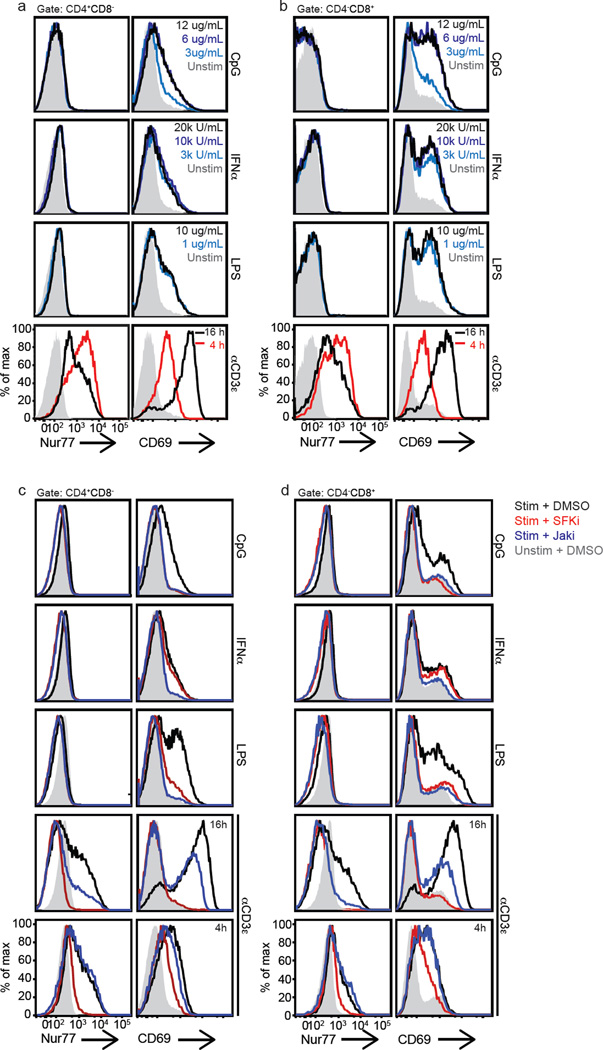
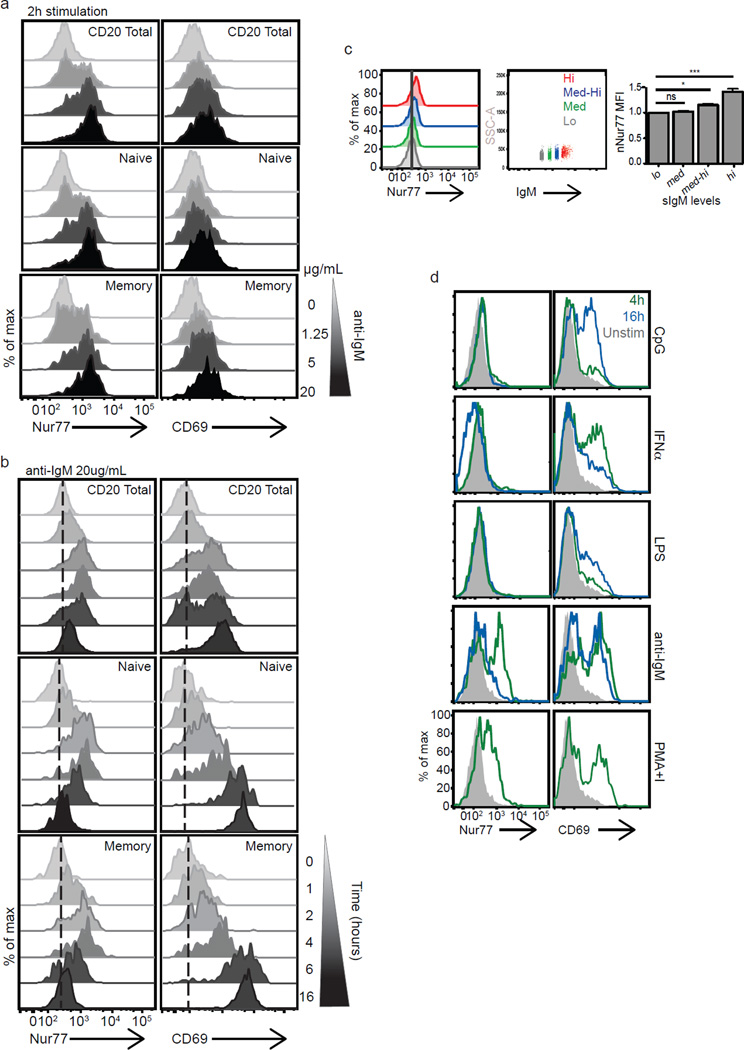
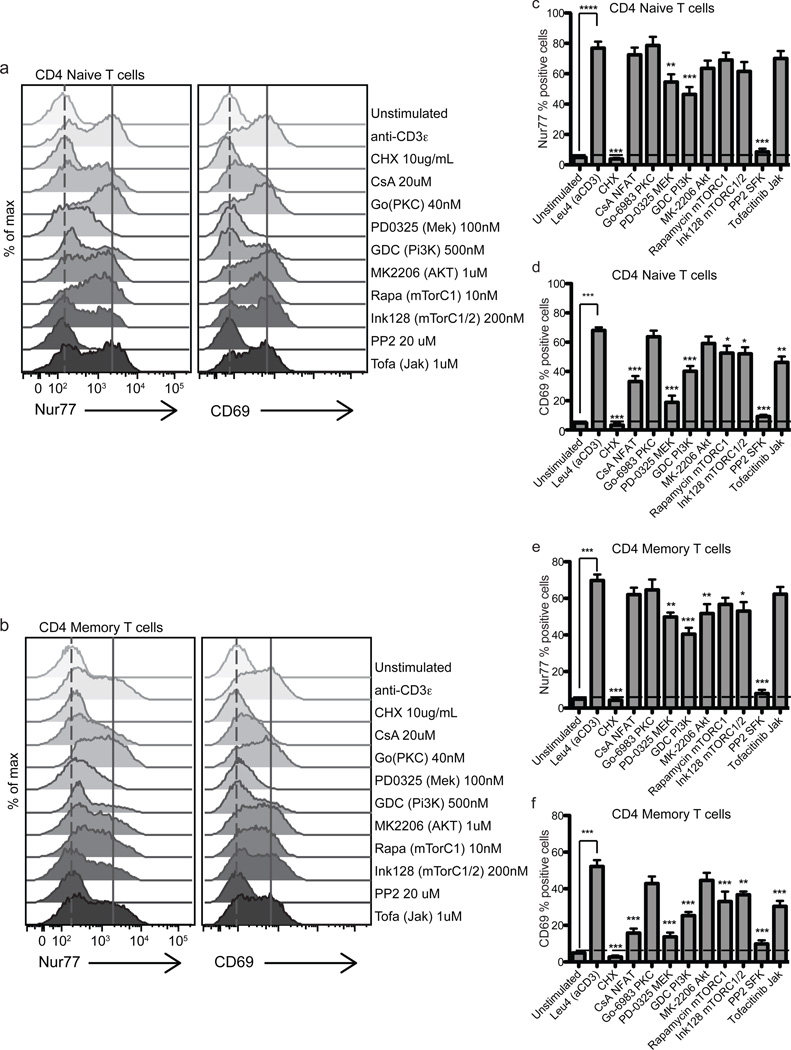
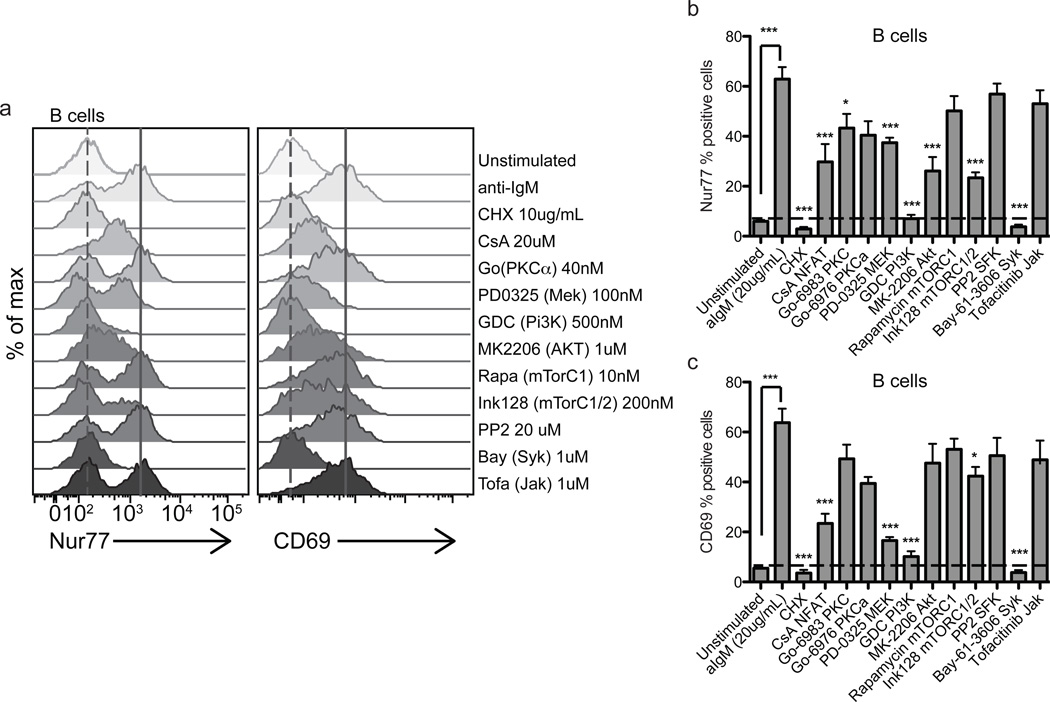
Distinguishing true Ag-stimulated lymphocytes from bystanders activated by the inflammatory milieu has been difficult. Nur77 is an immediate early gene whose expression is rapidly upregulated by TCR signaling in murine T cells and human thymocytes. Nur77-GFP transgenes serve as specific TCR and BCR signaling reporters in murine transgenic models. In this study, we demonstrate that endogenous Nur77 protein expression can serve as a reporter of TCR and BCR specific signaling in human PBMCs. Nur77 protein amounts were assessed by immunofluorescence and flow cytometry in T and B cells isolated from human PBMCs obtained from healthy donors that had been stimulated by their respective Ag receptors. We demonstrate that endogenous Nur77 is a more specific reporter of Ag-specific signaling events than the commonly used CD69 activation marker in both human T and B cells. This is reflective of the disparity in signaling pathways that regulate the expression of Nur77 and CD69. Assessing endogenous Nur77 protein expression has great potential to identify Ag-activated lymphocytes in human disease.


Figures

Figure 1
Figure 1. Endogenous Nur77 expression reflects the strength of antigen receptor signaling of human T cells in vitro
(a) The Jurkat human T cell line and murine thymocytes (mThy, positive blotting control) were stimulated with C305 or PMA and ionomycin as indicated and were analyzed by immunoblotting for Nur77 and GAPDH (loading control). (b) Histograms represent endogenous intracellular Nur77 and surface CD69 expression of CD4 (top panel) and CD8 (bottom panel) human T cells from a mixed population of PBMCs treated with purified anti-CD3ε mAb for 4 h at the indicated doses (ranging from 0.005 – 1.0 µg ml−1). Data are representative of at least three independent experiments.
Figure 2
Figure 2. Endogenous Nur77 levels denote distinct downstream antigen receptor signaling responses after TCR ligation in naïve and memory T cells over time, peaking at early time points
Histograms represent endogenous intracellular Nur77 and surface CD69 expression of (a) CD4 total T cells (top panels) CD4 naïve T cells (middle panels) and CD4 memory T cells (bottom panels), as well as (b) CD8 total T cells (top panels) CD8 naïve T cells (middle panels) and CD8 memory T cells (bottom panels), from a mixed population of PBMCs treated with anti-CD3ε 0.5 µg ml−1 at the indicated time points (ranging from 2 – 40 hours) (a,b). Data are representative of at least three independent experiments.
Figure 3
Figure 3. Stimulation with SEE validates Nur77 as a marker of antigen specific signaling in human T cells
Mixed human PBMCs were stimulated with soluble SEE for 16 h and analyzed by FACS. (a) Overlaid histograms are gated on total CD3+CD4+ T cells and represent endogenous Nur77 expression in unstimulated (light grey filled histogram), SEE (dark grey dotted line), or 2 h with PMA and ionomycin (dark grey filled histogram) stimulation. (b) Upper left, plot demonstrates gating strategy used to identify CD4+Vβ5.1+ subset. Upper right, histograms representative of intracellular Nur77 and surface CD69 levels in response to SEE 3 – 100µg ml−1 as indicated in the CD4+Vβ5.1+ subset. Bottom, plots of Nur77 and CD69 dose response of CD4+Vβ5.1+ subset to SEE at indicated doses. (c) Top, CD3+ T cells stained for CD4 and Vβ5.1 expression to identify double positive and CD4+Vβ5.1 subsets. Bottom plots represent Nur77 and CD69 levels in CD4+Vβ5.1 (left) or CD4+Vβ5.1+ (right) subsets stimulated with SEE 3 ng ml−1 overnight. Data are representative of at least two to three independent experiments.
Figure 4
Figure 4. Endogenous Nur77 reflects TCR specific signaling in human T cells, in contrast to CD69, reflective of Jak signaling differences
Histograms represent endogenous Nur77 and surface CD69 expression of human CD4(a, c) and CD8 (b, d) T cells. (a–b) Mixed human PBMCs were stimulated for 16 h with various immunostimulants: CpG, IFNα, or LPS at the indicated doses, or with anti-CD3ε 1.0 µg ml−1 for 4 or 16 h. Filled in grey histograms represent unstimulated samples treated with media alone. (c–d) Mixed PBMCs were pre-treated in the presence or absence of specific inhibitors and then stimulated for 16 h with CpG 12 µg ml−1, IFNα 20kU ml−1, or LPS 10 µg ml−1, or with anti-CD3ε 1.0 µg ml−1 for 4 or 16 h as indicated. Filled in grey histograms represent unstimulated samples pretreated with vehicle control (DMSO). (SFKi – src family kinase inhibitor, PP2; Jaki – janus kinase inhibitor, tofacitinib). Data are representative of at least three independent experiments and six biologically different donors.
Figure 5
Figure 5. Endogenous Nur77 expression reflects strength of B cell receptor signaling in human B cells
(a–b) Histograms represent intracellular Nur77 and surface CD69 expression in total human CD20+ B cells, naïve (CD20+IgM+CD27) and memory (CD20+IgM+CD27+) B cells from mixed PBMC populations (a) treated with varying doses of soluble anti-IgM for 2 h (1.25 – 20 µg ml−1 in a fivefold dilution series) or (b) treated with soluble anti-IgM 20 µg ml−1 from 1–16 hours as indicated. Data are representative of at least three independent experiments and five biologically different donors. (c) Histograms represent basal Nur77 levels in unstimulated primary human CD20+ B cells (left panel) binned on surface IgM expression levels: highest 15% (red), medium-high (blue histogram), medium (green histogram), lowest 15% (grey) (middle panel). Right panel bar graph represents mean Nur77 MFI of B cells based on surface IgM levels and normalized to Nur77 MFI from cells in lowest surface IgM bin +/− SEM. Data are accumulative from two independent experiments and 3–5 biologically different donors. Results are expressed as mean +/− SEM. *p<0.05, ***p<0.001 (d) Mixed human PBMCs were stimulated with various immunostimulants: CpG 12 µg ml−1, IFNα 20kU ml−1, LPS 10 µg ml−1 or with anti-IgM 20 µg ml−1 for 4 h (green histograms) or 16 h (blue histograms) or with PMA and ionomycin for 4 hours. Filled in grey histograms represent unstimulated samples treated with media alone. Data are representative of at least 3 independent experiments.
Figure 6
Figure 6. Nur77 levels reflect the integration of multiple TCR signaling pathways in human PBMCs
Histograms represent Nur77 and CD69 induction in CD4+CD8 Naïve (a) and Memory T cells (b) treated with anti-CD3ε in the presence or absence of specific inhibitors for 4 hours. Data in figures 6 a–b are representative of at least 5 biologically different donors. (c–f) Bar graphs represent Nur77 or CD69 percent positive cells in CD4+CD8 Naïve (CD45RA+RO) (c,d), Memory (CD45RARO+) T cells (e,f) treated with anti-CD3ε 1.0 µg ml−1 in the presence or absence of specific inhibitors for 4 hours. Horizontal dashed line in 6c–f marks Nur77 and CD69 % positive of unstimulated cells. Positive gate was set at highest 5% of unstimulated cells. Values in 6c–f are the mean of 5–6 biologically different donors +/− SEM. One-way ANOVA was used to compare unstimulated samples (treated with DMSO vehicle control) and inhibitor treatment groups to Leu4 + inhibitor vehicle control (DMSO). ns p>0.05, *p<0.05, **p<0.01, ***p<0.001
Figure 7
Figure 7. Nur77 levels reflect the integration of multiple BCR signaling pathways in human PBMCs
Histograms represent Nur77 and CD69 induction in CD20+IgM+ B cells (a) treated with anti-IgM in the presence or absence of specific inhibitors for 4 hours. Histograms are representative of at least 5 biologically different donors. (b,c) Bar graphs represent Nur77 or CD69 % positive cells in CD20+IgM+ B cells treated with anti-IgM in the presence or absence of specific inhibitors for 4 hours. Horizontal dashed lines mark Nur77 or CD69 % positive of unstimulated cells. Positive gate was set at the highest 5% of unstimulated cells. Values in 6b–c are the mean of 5–6 biologically different donors +/− SEM. One-way ANOVA was used to compare unstimulated samples (treated with DMSO vehicle control) and inhibitor treatment groups to anti-IgM + inhibitor vehicle control (DMSO). ns p>0.05, *p<0.05, **p<0.01, ***p<0.001

References

    1. Moran AE, Holzapfel KL, Xing Y, Cunningham NR, Maltzman JS, Punt J, Hogquist KA. T cell receptor signal strength in Treg and iNKT cell development demonstrated by a novel fluorescent reporter mouse. The Journal of experimental medicine. 2011;208(6):1279–1289. - PMC - PubMed
    1. Sun S, Zhang X, Tough DF, Sprent J. Type I interferon-mediated stimulation of T cells by CpG DNA. The Journal of experimental medicine. 1998;188(12):2335–2342. - PMC - PubMed
    1. McInnes IB, Schett G. Cytokines in the pathogenesis of rheumatoid arthritis. Nature reviews Immunology. 2007;7(6):429–442. - PubMed
    1. Brennan FM, McInnes IB. Evidence that cytokines play a role in rheumatoid arthritis. The Journal of clinical investigation. 2008;118(11):3537–3545. - PMC - PubMed
    1. Olefsky JM. Nuclear receptor minireview series. The Journal of biological chemistry. 2001;276(40):36863–36864. - PubMed

Publication types

Substances