. 2017 Jan;5(1):9-16.
doi: 10.1158/2326-6066.CIR-16-0103. Epub 2016 Dec 9.

Efficacy of PD-1 Blockade Is Potentiated by Metformin-Induced Reduction of Tumor Hypoxia

Affiliations

Efficacy of PD-1 Blockade Is Potentiated by Metformin-Induced Reduction of Tumor Hypoxia

Nicole E Scharping et al. Cancer Immunol Res. 2017 Jan.

Abstract

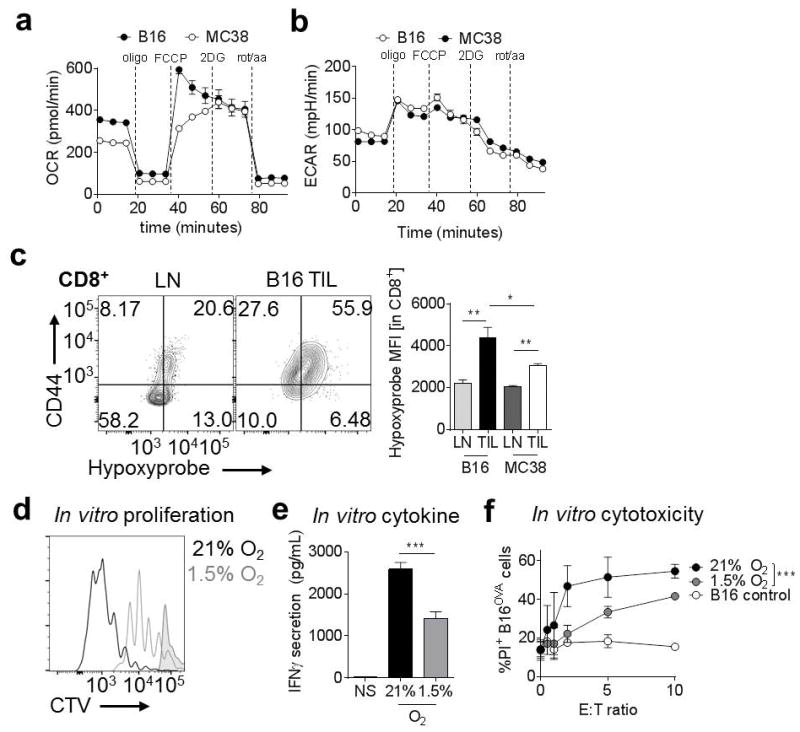
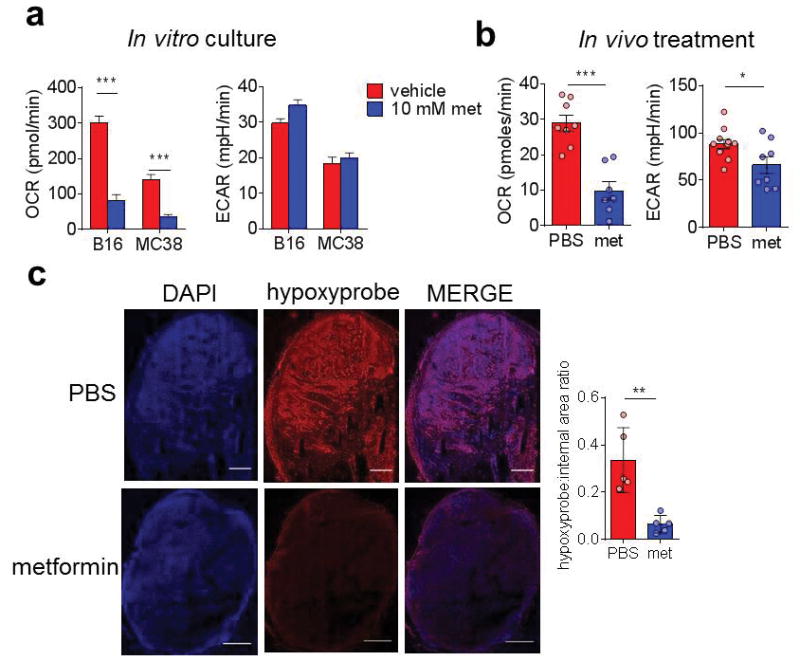
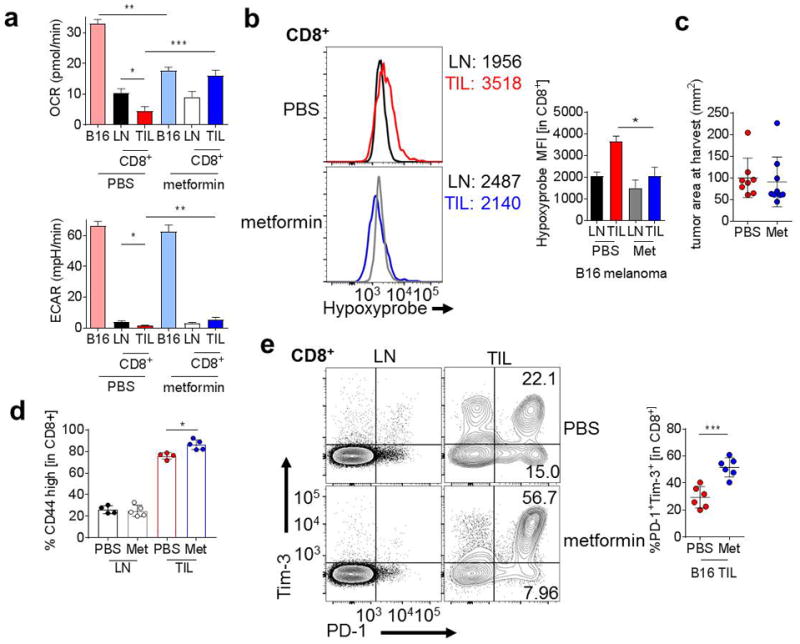
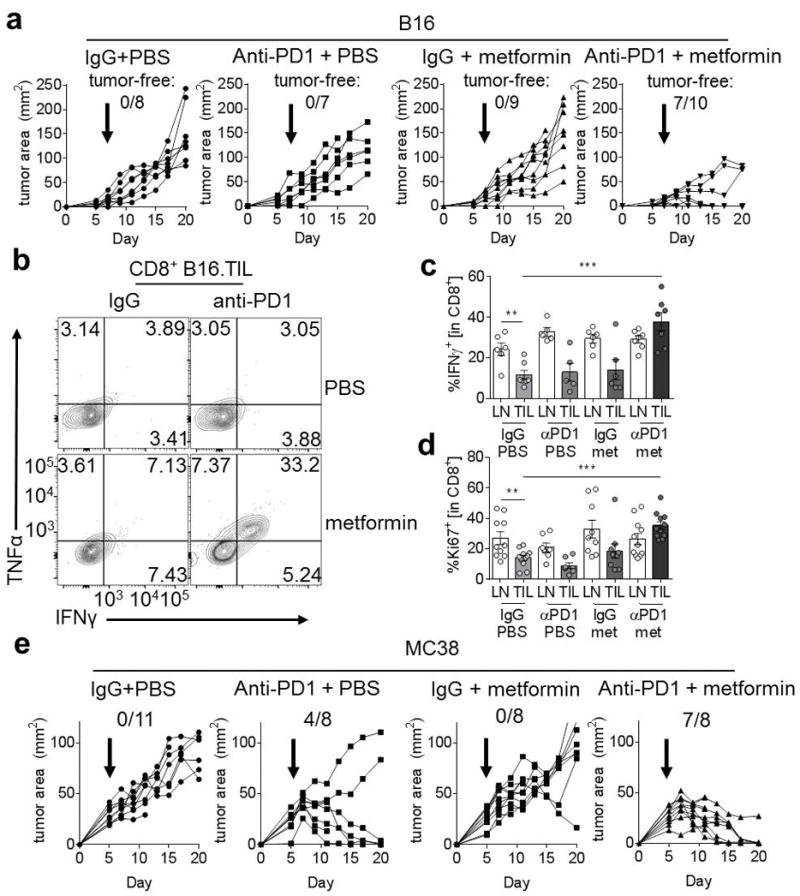
Blockade of the coinhibitory checkpoint molecule PD-1 has emerged as an effective treatment for many cancers, resulting in remarkable responses. However, despite successes in the clinic, most patients do not respond to PD-1 blockade. Metabolic dysregulation is a common phenotype in cancer, but both patients and tumors are metabolically heterogeneous. We hypothesized that the deregulated oxidative energetics of tumor cells present a metabolic barrier to antitumor immunity through the generation of a hypoxic microenvironment and that normalization of tumor hypoxia might improve response to immunotherapy. We show that the murine tumor lines B16 and MC38 differed in their ability to consume oxygen and produce hypoxic environments, which correlated with their sensitivity to checkpoint blockade. Metformin, a broadly prescribed type II diabetes treatment, inhibited oxygen consumption in tumor cells in vitro and in vivo, resulting in reduced intratumoral hypoxia. Although metformin monotherapy had little therapeutic benefit in highly aggressive tumors, combination of metformin with PD-1 blockade resulted in improved intratumoral T-cell function and tumor clearance. Our data suggest tumor hypoxia acts as a barrier to immunotherapy and that remodeling the hypoxic tumor microenvironment has potential to convert patients resistant to immunotherapy into those that receive clinical benefit. Cancer Immunol Res; 5(1); 9-16. ©2016 AACR.


Conflict of interest statement

Conflict of interest statement

The authors have no conflicts of interest to disclose.

Figures

Figure 1
Figure 1. Tumor hypoxia is variable between tumor types and inhibits T-cell function
(A) Oxygen consumption rate (OCR) trace of B16 and MC38 cells (50,000 cells/well) interrogated for mitochondrial activity in the Seahorse instrument. (B), Extracellular acidification rate (ECAR) trace of B16 and MC38 cells interrogated for glycolytic activity in the Seahorse instrument. (C) Hypoxyprobe staining of T cells isolated from B16 and MC38 tumors. Results are tabulated to the right. (D) CellTrace Violet (CTV) dye dilution showing proliferation of OT-I T cells activated with peptide in ambient normoxia (20%) or hypoxic (1.5%) conditions. Shaded histogram shows unstimulated cells. (E) Cytokine production of CD8+ T cells stimulated as in b overnight. (F) Cytotoxicity (PI staining) of parental or OVA-expressing B16 tumor cells incubated with previously activated, effector OT-I T cells overnight under conditions of normoxia or hypoxia. * P < 0.05, ** P < 0.01, *** P < 0.001 by unpaired t-test (C, E) or two-way ANOVA with repeated-measures (F). Results represent three independent experiments.
Figure 2
Figure 2. Metformin treatment acts as an inhibitor of tumor oxygen consumption
(A) Oxygen consumption rate of B16 or MC38 cells (50,000 cells/well) treated overnight in the presence or absence of 10 mM metformin. (B) OCR of B16 tumor cells (CD45-depleted) plated directly ex vivo from mice bearing small tumors treated with PBS or metformin (50 mg/kg) for 3 days. (C) Pimonidazole staining of full tumor sections (stitched from 300–500 individual panels) from mice bearing B16 tumors receiving PBS or metformin treatment for 3 days as in B. Tabulated results quantify the internal hypoxyprobe signal from a set threshold normalized for each day of imaging. Scale bar = 1mm. ** P < 0.01, *** P < 0.001 by unpaired t-test. Data represent the mean (A, B, C tabulation) or are representative (C images) of at least three independent experiments.
Figure 3
Figure 3. Metformin treatment reduces intratumoral T-cell hypoxia
(A) Oxygen consumption rate (top) or extracellular acidification rate (bottom) from B16-bearing mice treated with metformin or vehicle for 3 days. CD45+CD8+ T cells were sorted by flow cytometry and assayed directly ex vivo, whereas B16 tumor cells were CD45-depleted before assaying. (B) Flow cytogram (left) and tabulation (right) of pimonidazole staining in T cells from B16-bearing mice treated with metformin or vehicle for 3 days. (C) Tumor area at 21 days for mice treated during tumor progression with PBS or metformin. (D) Quantification of CD44hi CD8+ T cells from B16-bearing mice treated with metformin or vehicle for 3 days (E) PD-1 and Tim-3 expression in CD8+ T cells from mice treated as in D. * P < 0.05, *** P < 0.001 by unpaired t-test. Results are representative of three (A, B, D, E) or four (C) independent experiments.
Figure 4
Figure 4. Metabolic remodeling synergizes with checkpoint blockade to effect antitumor immunity
(A), Tumor measurements of C57/BL6 mice inoculated with B16 melanoma. Mice began receiving treatment on d5 as indicated, receiving 0.2mg anti-PD1 or its isotype control every 4 days, and either metformin or vehicle. Number of mice tumor-free of the total inoculated is reported. (B) Representative flow cytogram depicting IFNγ and TNFα production from CD8+ tumor infiltrating T cells from B16-bearing mice treated as in A. (C) Tabulated IFNγ staining from multiple mice; each dot represents one animal. (D) Ki67 expression in CD8+ T cells from mice treated as in a as indicated. (E) As in A, but mice were inoculated with MC38. * P < 0.05, ** P < 0.01, *** P < 0.001 by unpaired t-test. Results represent the mean (A, C, D, E) or are representative of (B) three to five independent experiments.

References

    1. Topalian SL, Drake CG, Pardoll DM. Immune checkpoint blockade: a common denominator approach to cancer therapy. Cancer cell. 2015;27:450–61. - PMC - PubMed
    1. Gajewski TF, Woo SR, Zha Y, Spaapen R, Zheng Y, Corrales L, et al. Cancer immunotherapy strategies based on overcoming barriers within the tumor microenvironment. Current opinion in immunology. 2013;25:268–76. - PubMed
    1. Siska PJ, Rathmell JC. T cell metabolic fitness in antitumor immunity. Trends in immunology. 2015;36:257–64. - PMC - PubMed
    1. Delgoffe GM, Powell JD. Feeding an army: The metabolism of T cells in activation, anergy, and exhaustion. Molecular immunology. 2015;68:492–6. - PMC - PubMed
    1. Justus CR, Sanderlin EJ, Yang LV. Molecular Connections between Cancer Cell Metabolism and the Tumor Microenvironment. International journal of molecular sciences. 2015;16:11055–86. - PMC - PubMed

MeSH terms