. 2017 Jan 27;292(4):1160-1177.
doi: 10.1074/jbc.M116.771592. Epub 2016 Dec 9.

Endosomal Phosphatidylinositol 3-Phosphate Promotes Gephyrin Clustering and GABAergic Neurotransmission at Inhibitory Postsynapses

Affiliations

Endosomal Phosphatidylinositol 3-Phosphate Promotes Gephyrin Clustering and GABAergic Neurotransmission at Inhibitory Postsynapses

Theofilos Papadopoulos et al. J Biol Chem. .

Abstract

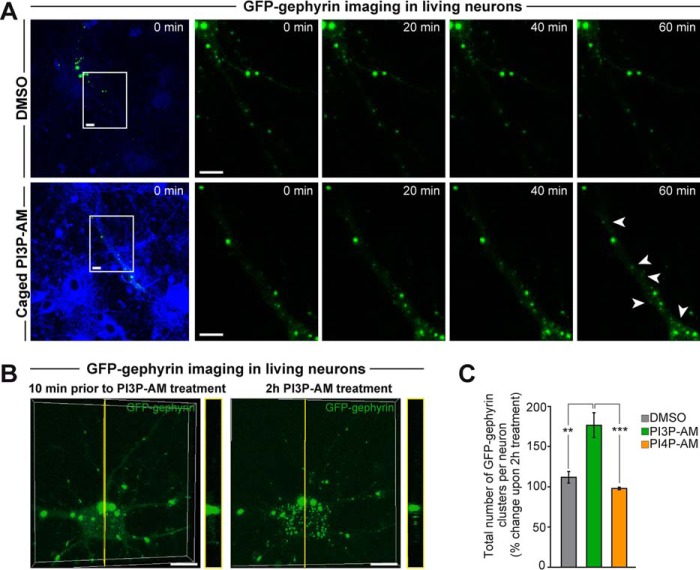
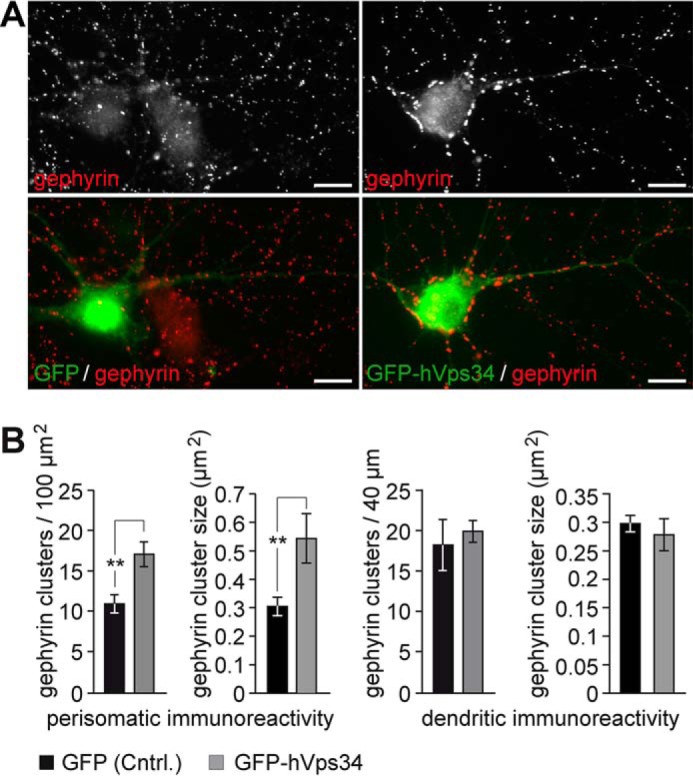
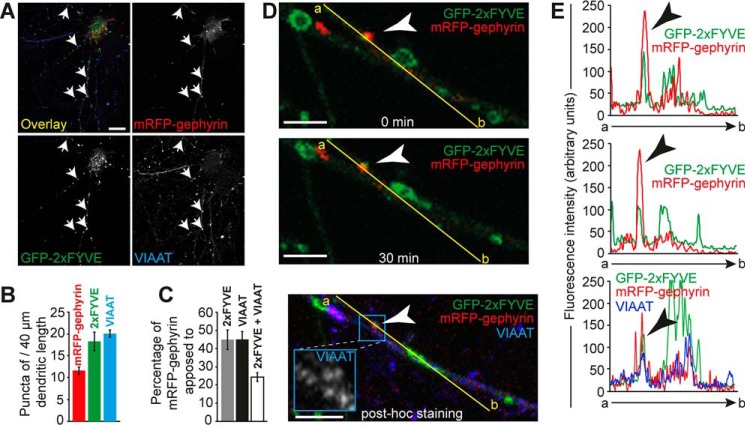
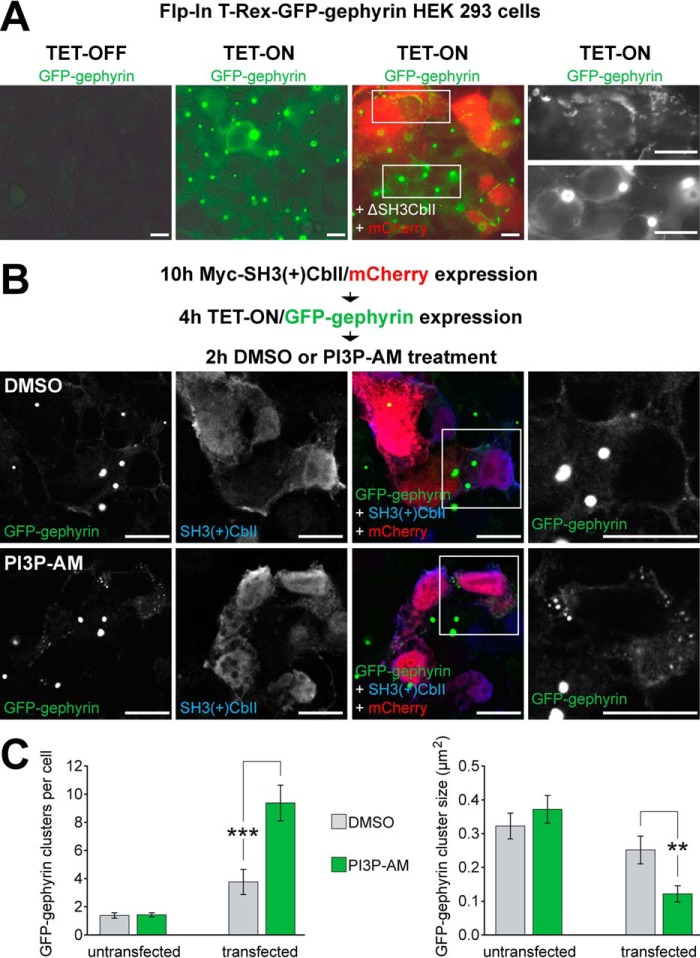
The formation of neuronal synapses and the dynamic regulation of their efficacy depend on the proper assembly of the postsynaptic neurotransmitter receptor apparatus. Receptor recruitment to inhibitory GABAergic postsynapses requires the scaffold protein gephyrin and the guanine nucleotide exchange factor collybistin (Cb). In vitro, the pleckstrin homology domain of Cb binds phosphoinositides, specifically phosphatidylinositol 3-phosphate (PI3P). However, whether PI3P is required for inhibitory postsynapse formation is currently unknown. Here, we investigated the role of PI3P at developing GABAergic postsynapses by using a membrane-permeant PI3P derivative, time-lapse confocal imaging, electrophysiology, as well as knockdown and overexpression of PI3P-metabolizing enzymes. Our results provide the first in cellula evidence that PI3P located at early/sorting endosomes regulates the postsynaptic clustering of gephyrin and GABAA receptors and the strength of inhibitory, but not excitatory, postsynapses in cultured hippocampal neurons. In human embryonic kidney 293 cells, stimulation of gephyrin cluster formation by PI3P depends on Cb. We therefore conclude that the endosomal pool of PI3P, generated by the class III phosphatidylinositol 3-kinase, is important for the Cb-mediated recruitment of gephyrin and GABAA receptors to developing inhibitory postsynapses and thus the formation of postsynaptic membrane specializations.

Keywords: GABA receptor; inositol phospholipid; phosphatidylinositol phosphatase; synapse; vesicles.


Figures

FIGURE 1.
FIGURE 1.
PI3P-AM induces formation of GFP-gephyrin clusters in dissociated hippocampal neurons. A, images show cultured hippocampal neurons transfected from DIV 9–10 with GFP-gephyrin and treated with either DMSO-only or 50 μm caged PI3P-AM, for 5 min prior to imaging. The caged PI3P-AM carries a photolabile protecting group (7-diethylamino-4-hydrodymethylcoumarin) that masks the d3-phosphate of PI3P. This protective group was removed at 0 min by short UV light illumination (5 s, 405 nm), as described previously (21). Note successful cell entry and wide-spread distribution in intracellular membranes of caged PI3P-AM (bottom, left) at this time point. After UV light illumination, the number of GFP-gephyrin clusters increased in caged PI3P-AM-treated (bottom panels, arrowheads) but not DMSO-treated (top panels) neurons over the subsequent 60 min. Scale bars, 10 μm. B, 3D reconstruction of confocal image stacks and YZ plane views (right panels) of a single rat hippocampal neuron transfected at DIV 9 with a cDNA encoding GFP-gephyrin. At DIV 10, the medium was replaced with imaging medium (see “Experimental Procedures”), and confocal imaging was performed 10 min prior to PI3P-AM treatment (left) and after a 2-h treatment with 50 μm PI3P-AM (right). Yellow lines indicate the positions of the YZ plane views. Note that PI3P-AM leads to a redistribution of GFP-gephyrin aggregates into numerous clusters. Scale bars, 10 μm. C, quantifications of the % change in the number of total clusters (synaptic + extrasynaptic) upon treatment as indicated. Bars correspond to values obtained from the analysis of n = 10 neurons per condition from n = 3 independent experiments.
FIGURE 2.
FIGURE 2.
PI3P-AM induces postsynaptic clustering of GFP-gephyrin in dissociated hippocampal neurons. A–C, cultures were transfected at DIV 9 with a cDNA encoding GFP-gephyrin. At DIV 10, the medium was replaced by imaging medium (see under “Experimental Procedures”), and confocal images were sampled 10 min prior to DMSO (A, left), PI3P-AM (B, left), or PI4P-AM (C, left) treatment and 2 h after the addition of either DMSO (A, center), 50 μm PI3P-AM (B, center), or 50 μm PI4P-AM (C, center). The same neurons were again imaged after fixation and post hoc VIAAT staining to visualize inhibitory presynaptic terminals (A–C, right panels). Arrowheads in the higher magnifications of the boxed areas indicate synaptic sites positive for both GFP-gephyrin and VIAAT. Scale bars, 10 μm. D, quantifications of the % change in fluorescence intensity of postsynaptic GFP-gephyrin clusters upon treatment as indicated. Values are from 70 (PI3P-AM or DMSO-only) or 35 (PI4P-AM) postsynaptic clusters analyzed on 10 or 5 individual neurons each from three independent transfection experiments.
FIGURE 3.
FIGURE 3.
Post- and presynaptic effects of PI3P-AM in autaptic GABAergic striatal neurons. A, representative mIPSC traces recorded at a holding potential of −70 mV in the presence of 300 nm TTX from autaptic striatal neurons treated with either PI3P-AM (50 μm; green) or DMSO only (control; gray). B, mean mIPSC amplitudes (left) and frequencies (right) in PI3P-AM-treated and control neurons. Note the significant increase of mIPSC amplitudes but not frequencies in PI3P-AM-treated neurons, as compared with controls. C, representative traces (left) and normalized responses (right; see “Experimental Procedures”) induced by 3 μm exogenously applied GABA in PI3P-AM-treated (green) and control neurons (gray). D, representative traces of AP-evoked IPSCs (left), mean evoked IPSC amplitudes (center), and mean numbers of SVs released per AP (right) in PI3P-AM-treated (green) and control neurons (gray). E, representative responses to the application of hypertonic (0.5 m) sucrose solution (left), mean charge transfer during the response to hypertonic sucrose solution (apparent RRP size; center), and mean numbers of calculated primed SVs (PSVs; right) in PI3P-AM-treated (green) and control neurons (gray). Note the significant decrease in the number of SVs per AP, but not in the number of PSVs, in PI3P-AM-treated neurons. F, average (Pvr) expressed as the percentage of RRP and calculated by dividing the charge transfer during the AP-evoked response by the charge transfer measured during a response to hypertonic sucrose solution (left) or by dividing the number of SVs released during an AP by the number of SVs in the readily releasable vesicle pool (right) in PI3P-AM-treated (green) and control (gray) autaptic neurons. Data in B–D, center, E, center, and F, left were obtained from 26 DMSO and 30 PI3P-AM-treated neurons in 4–5 independent experiments. Data in D, right, E, right, and F, right, were obtained from 18 DMSO and 21 PI3P-AM-treated neurons in three independent experiments.
FIGURE 4.
FIGURE 4.
PI3P-AM enhances postsynaptic clustering of gephyrin and GABAARs in autaptic GABAergic striatal neurons. A and B, representative images of autaptic striatal neurons treated at DIV 9 for 2 h with either DMSO only (left) or 50 μm PI3P-AM (right) in imaging medium (see “Experimental Procedures”). Cells were fixed after treatment and stained with gephyrin-, VIAAT-, and GABAAR-α2-specific antibodies, as indicated. Scale bars, 10 μm. B, overlays and single channels of the corresponding boxed areas in A, at higher magnifications, as indicated. Note increases in the size of synaptically localized gephyrin (geph) and, to a lesser extent, α2 subunit-containing GABAARs in neurons treated with PI3P-AM, as compared with control cells. C, quantifications of the densities of VIAAT, gephyrin, and GABAAR α2 immunoreactive puncta per 40 μm dendritic length (left), of the percentages (center), and the mean sizes (right) of synaptically localized dendritic gephyrin and GABAAR α2 clusters in PI3P-AM-treated (green) and control (gray) autaptic neurons. Bars correspond to counts on randomly selected dendrites of 20 individual neurons from three independent treatments per condition.
FIGURE 5.
FIGURE 5.
Post- and presynaptic effects of PI3P-AM in autaptic glutamatergic hippocampal neurons. A, representative mEPSC traces recorded at a holding potential of −70 mV in the presence of 300 nm TTX from autaptic hippocampal neurons treated with either PI3P-AM (50 μm; blue) or DMSO only (control; gray). B, mean mEPSC amplitudes (left) and frequencies (right) are not significantly different in PI3P-AM-treated (blue) and control (gray) neurons. C, representative traces (left) and normalized responses (right; see “Experimental Procedures”) induced by 100 μm exogenously applied glutamate in PI3P-AM-treated (blue) and control neurons (gray). D, representative traces (left) and normalized responses (right; see “Experimental Procedures”) induced by 3 μm exogenously applied GABA in PI3P-AM-treated (blue) and control neurons (gray). Note, in contrast to glutamate-induced currents, GABA responses are increased in PI3P-AM-treated neurons. E, representative traces of AP-evoked EPSCs (left) and mean evoked EPSC amplitudes (right) in PI3P-AM-treated (blue) and control neurons (gray). F, representative responses to the application of hypertonic (0.5 m) sucrose solution (left) and mean charge transfer during the response to hypertonic sucrose solution (apparent RRP size; right) in PI3P-AM-treated (blue) and control neurons (gray). Note a strong decrease in the mean amplitude of the eEPSCs, but not in RRP size, in PI3P-AM-treated neurons, as compared with controls. G, average Pvr, expressed as the percentage of RRP and calculated by dividing the charge transfer during the AP-evoked response by the charge transfer measured during a response to hypertonic sucrose solution, in PI3P-AM-treated (blue) and control (gray) autaptic hippocampal neurons. Data in B were obtained from 15 DMSO and 21 PI3P-AM-treated neurons; data in C and D were obtained from 19 DMSO and 24 PI3P-AM-treated neurons; and data in E were obtained from 20 DMSO and 9 of 26 measured PI3P-AM-treated neurons, in three independent experiments each. Data in F and G are from 17 DMSO and 16 of 25 analyzed PI3P-AM-treated neurons in three independent experiments.
FIGURE 6.
FIGURE 6.
Down-regulation of kinases involved in PI3P synthesis. A, Western blotting analysis of lysates from Rat2 cells stably expressing negative control (neg. Cntrl.-miRNA) or miRNAs specific for the rat isoforms of PI3K-C3, PI3K-C2α, or PI3K-C2β, as indicated. Top panels, Western blots with antibodies specific for PI3K-C3 (left), PI3K-C2α (center), or PI3K-C2β (right). Center panels, β-tubulin-specific antibody was used to monitor protein loading. Bottom panels, MemCode stainings of the same membranes prior to immunoblotting were used to ensure that similar amounts of total protein were present in the samples analyzed. B, knockdown efficiencies were calculated by comparing normalized band intensities (kinase-specific bands normalized to β-tubulin bands) in lysates prepared from cells expressing the negative control miRNA with those from cells expressing the corresponding kinase-specific miRNAs, as indicated. Data represent means ± S.E. of 3–4 independent experiments.
FIGURE 7.
FIGURE 7.
PI3K-C3 knockdown impairs postsynaptic gephyrin clustering. A, cultured hippocampal neurons were transfected at DIV 4 with a cDNA encoding a GFP-tagged negative control (neg. Cntrl.)-miRNA (left) or an miRNA specific for rat PI3K-C3 (right). At DIV 14, the cultures were fixed and stained with gephyrin- and VIAAT-specific antibodies. Bottom panels, overlays of the corresponding boxed areas at higher magnifications. Note the reduction of synaptically localized (as indicated by VIAAT immunostaining) gephyrin clusters in neurons transfected with the PI3K-C3-specific miRNA. Scale bars, 20 μm. B, quantifications of gephyrin immunoreactive clusters in the dendrites of cultured neurons transfected at DIV 4 with the corresponding miRNAs, as indicated, and analyzed at DIV 14. Bars correspond to counts on randomly selected dendrites of 14–22 individual neurons from three independent transfection experiments. C, quantifications of VIAAT immunoreactive puncta in the dendrites of cultured neurons transfected at DIV 4 with the corresponding miRNAs, as indicated, and analyzed at DIV 14. Bars correspond to counts on randomly selected dendrites of 12–13 individual neurons from three independent transfection experiments. D, PI3K-C3 knockdown leads to a reduction of EEA1 immunoreactivity on dendritic early/sorting endosomes. Cultured hippocampal neurons were transfected at DIV 4 either with a cDNA encoding a GFP-tagged negative control miRNA (top) or a PI3K-C3-specific miRNA (bottom). At DIV 14, the cultures were fixed and stained with an EEA1-specific antibody. Note the reduction of EEA1 immunoreactive puncta in the dendrites of neurons expressing the PI3K-C3-miRNA. Scale bars, 10 μm. E, quantifications of EEA1-immunoreactive puncta in the somata of DIV 14 neurons expressing either the negative control or the PI3K-C3-specific miRNA. Bars correspond to counts on somata (100-μm2 area) of 10 individual neurons per condition from three independent transfection experiments. F, quantifications of EEA1 immunoreactive puncta in dendritic segments of DIV 14 neurons expressing either the negative control or the PI3K-C3-specific miRNA. Bars correspond to counts on randomly selected dendrites of 10 individual neurons per condition from three independent transfection experiments. G, cultured hippocampal neurons were transfected at DIV 4 with a cDNA encoding the GFP-tagged negative control miRNA (top panels) or the miRNA specific for rat PI3K-C3 (bottom panels). At DIV 8, the cultures were treated for 2 h either with DMSO only (left) or with 50 μm PI3P-AM (right) in the imaging medium, fixed, and stained with a gephyrin-specific antibody. The corresponding boxed areas are shown at higher magnifications. Scale bars, 10 μm. H, quantifications of densities of gephyrin immunoreactive puncta per 40-μm dendritic length (top), and mean sizes of dendritic gephyrin clusters (bottom) in negative control miRNA- (black) and PI3K-C3 miRNA (green)-expressing neurons treated for 2 h with DMSO or 50 μm PI3P-AM, as indicated. Note the increase in the mean size, but not density, of gephyrin clusters in PI3K-C3 miRNA-expressing neurons upon PI3P-AM treatment. Bars correspond to counts on randomly selected dendrites of 16–17 individual neurons from three independent transfections.
FIGURE 8.
FIGURE 8.
hVPS34 (PI3K-C3) overexpression leads to an increase in the density and size of perisomatic gephyrin clusters in cultured neurons. A, cultured hippocampal neurons were transfected at DIV 7 with cDNAs encoding either GFP alone (left) or GFP-hVps34 (right). At DIV 14, the cultures were fixed and stained with a gephyrin-specific antibody. Note the increase in perisomatic gephyrin clusters in the neuron expressing GFP-hVps34, as compared with control. Top panels, endogenous gephyrin immunoreactivity; bottom panels, corresponding overlays. Scale bar, 10 μm. B, quantifications of perisomatic (left) and dendritic (right) gephyrin cluster densities and sizes in neurons expressing GFP or GFP-hVps34. Bars correspond to counts on somata (100 μm2 area) and randomly selected dendrites of 15 individual neurons per condition from three independent transfection experiments.
FIGURE 9.
FIGURE 9.
Overexpression of MTM1-CAAX or 72-5ptase affects gephyrin clustering in cultured neurons. A, cultured hippocampal neurons were transfected at DIV 8 with cDNAs encoding either mCherry alone (left), mCherry-MTM1-CAAX (center), or HA-72-5ptase (right). At DIV 10, the cultures were fixed and stained with a gephyrin-specific (green) and an HA-specific antibody (red in A, right). Top panels, endogenous gephyrin immunoreactivity; bottom panels, corresponding overlays. Scale bars, 10 μm. B–E, quantifications of perisomatic and dendritic gephyrin cluster densities (B and C) and sizes (D and E) in neurons expressing mCherry, mCherry-MTM1-CAAX, or HA-72-5ptase, as indicated. Bars correspond to counts on somata (100-μm2 area) and randomly selected dendrites (n = 29–45) of 16–30 individual neurons per condition from three independent transfection experiments.
FIGURE 10.
FIGURE 10.
Coapposition of GFP-2×FYVE and mRFP-gephyrin at inhibitory postsynapses. A, cultured hippocampal neurons were transfected at DIV 9 with cDNAs encoding GFP-2×FYVE and mRFP-gephyrin. At DIV 10, the cultures were fixed and stained with a VIAAT-specific antibody (blue). Arrows indicate synapses, in which GFP-2×FYVE and mRFP-gephyrin are coapposed to VIAAT. Scale bar, 10 μm. B, quantifications of mRFP-gephyrin, GFP-2×FYVE, and VIAAT puncta in the dendrites of transfected neurons, as indicated. Bars correspond to counts on randomly selected dendrites of 14 individual neurons collected from three independent transfection experiments. C, percentages of mRFP-gephyrin puncta apposed to 2×FYVE, VIAAT, or coapposed to both, as indicated. Bars correspond to counts on randomly selected dendrites of 14 individual neurons collected from three independent transfection experiments. D, hippocampal neurons were transfected as in A. At DIV 10, time-lapse imaging on a dendritic segment of a neuron expressing GFP-2×FYVE and mRFP-gephyrin was performed. Overlays of the time points 0 (top) and 30 min (center) are shown. The same dendritic segment was also imaged after fixation and post hoc VIAAT staining to visualize inhibitory presynaptic terminals (bottom). Scale bars, 4 μm. E, fluorescence intensity scans over the yellow lines in D, illustrating coapposition of GFP-2×FYVE and mRFP-gephyrin with VIAAT during time-lapse imaging. Black arrowheads in E correspond to the white arrowheads in D and indicate fluorescence intensity peaks of mRFP-gephyrin and GFP-2×FYVE puncta apposed to VIAAT.
FIGURE 11.
FIGURE 11.
Prolonged expression of GFP-2×FYVE inhibits clustering of endogenous gephyrin in cultured hippocampal neurons. A, cultures were transfected at DIV 4 with cDNAs encoding either GFP alone (top) or GFP-2×FYVE (bottom). At DIV 11, neurons were fixed and stained with a gephyrin-specific antibody. Note the reduction in gephyrin cluster density in the neuron expressing GFP-2×FYVE, as compared with the GFP-transfected neuron. Left panels, endogenous gephyrin immunoreactivity; right panels, corresponding overlays. Scale bar, 10 μm. B, quantifications of gephyrin clusters per 40 μm dendritic segments in untransfected neurons, neurons expressing GFP, or neurons expressing GFP-2×FYVE. Bars correspond to counts on randomly selected dendrites of 26 individual neurons per condition from three independent transfection experiments.
FIGURE 12.
FIGURE 12.
In HEK 293 cells, PI3P-AM stimulation of GFP-gephyrin clustering requires Cb. A, Flp-In T-Rex-GFP-gephyrin HEK 293 cells inducibly express GFP-gephyrin upon TET-induction (compare Tet-Off with Tet-On state in the 1st two panels). Transfection of the Myc-ΔSH3CbII cDNA (unstained) together with empty mCherry vector (to allow visualization of transfected cells) resulted in a redistribution of intracellular GFP-gephyrin aggregates into submembranous microclusters (3rd panel), as reported previously (43). Grayscale panels of the boxed areas displayed at higher magnification (right) demonstrate GFP-gephyrin distributions in the presence (top) or absence (bottom) of ΔSH3CbII. Scale bars, 10 μm. B, Flp-In T-Rex-GFP-gephyrin HEK 293 cells were cotransfected in their uninduced state with Myc-SH3(+)CbII and empty mCherry-vector to visualize transfected cells prior to immunocytochemistry. At 10 h post-transfection, GFP-gephyrin expression was induced for 4 h, and then the medium was replaced for 2 h with imaging medium (see “Experimental Procedures”) containing either DMSO only (top panels) or 50 μm PI3P-AM (bottom panels). Subsequently, cells were fixed and stained with a Myc-specific antibody. Grayscale panels of the boxed areas at higher magnifications (right) indicate the redistribution of GFP-gephyrin into numerous smaller clusters in Myc-SH3(+)CbII-expressing cells in the presence of PI3P-AM (bottom) but not DMSO only (top). Scale bars, 10 μm. C, quantifications of the numbers per cell (left) and the mean sizes (right) of GFP-gephyrin clusters in the presence (transfected) and absence (untransfected) of Myc-SH3(+)CbII in DMSO-treated (gray) and PI3P-AM-treated (green) cells. Bars correspond to counts of 21 individual cells per condition from three independent transfections.
FIGURE 13.
FIGURE 13.
Tentative model for the role of PI3P-containing early/sorting endosomes in the assembly of the gephyrin scaffold at postsynaptic membranes. A, intracellularly, gephyrin trimers bind to Cb in its closed conformation. At postsynaptic sites, the open conformation is achieved and maintained by the interaction of NL2, NL4, or the α2 subunit of GABAARs with the SH3 domain of Cb (7, 44, 59). In addition, Cb binds in its open conformation, via its PH domain, to PI3P and further PIPs located at the plasma membrane (9, 12, 15). B, particularly at early developmental stages and at extrasynaptic sites, GABAARs undergo constitutive endocytosis and are either rapidly recycled back to the cell surface or targeted to lysosomal degradation (5, 60). C, Cb (via its SH3 domain (59)) and gephyrin (5) interact with GABAARs also at extrasynaptic sites, thereby limiting their diffusion and facilitating their “trapping” to postsynaptic sites. D, at GABAAR-containing early/sorting endosomes, both interactions of gephyrin and Cb with GABAARs, as well as binding of Cb's PH domain to PI3P, induce the open conformational state of Cb, thereby increasing the rates of incorporation of receptor-associated scaffold to extrasynaptic or postsynaptic sites. At this stage, levels of gephyrin- and Cb-interacting proteins as well as of PI3K-C3 and additional kinases/phosphatases involved in the generation/degradation of PI3P might be crucial for determining PI3P levels and its interconversion rates and thereby the trafficking of Cb-gephyrin complexes toward the plasma membrane, where the latter might be stabilized through interactions with NL2 and NL4 (see text).

Similar articles

Cited by

References

    1. Balla T. (2013) Phosphoinositides: tiny lipids with giant impact on cell regulation. Physiol. Rev. 93, 1019–1137 - PMC - PubMed
    1. Raiborg C., Schink K. O., and Stenmark H. (2013) Class III phosphatidylinositol 3-kinase and its catalytic product PtdIns3P in regulation of endocytic membrane traffic. FEBS J. 280, 2730–2742 - PubMed
    1. Roth M. G. (2004) Phosphoinositides in constitutive membrane traffic. Physiol. Rev. 84, 699–730 - PubMed
    1. Wenk M. R., and De Camilli P. (2004) Protein-lipid interactions and phosphoinositide metabolism in membrane traffic: insights from vesicle recycling in nerve terminals. Proc. Natl. Acad. Sci. U.S.A. 101, 8262–8269 - PMC - PubMed
    1. Luscher B., Fuchs T., and Kilpatrick C. L. (2011) GABAA receptor trafficking-mediated plasticity of inhibitory synapses. Neuron 70, 385–409 - PMC - PubMed

Publication types

MeSH terms

LinkOut - more resources