. 2017 Jan 3;127(1):260-268.
doi: 10.1172/JCI89488. Epub 2016 Dec 12.

Targeting type I interferon-mediated activation restores immune function in chronic HIV infection

Targeting type I interferon-mediated activation restores immune function in chronic HIV infection

Anjie Zhen et al. J Clin Invest. .

Abstract

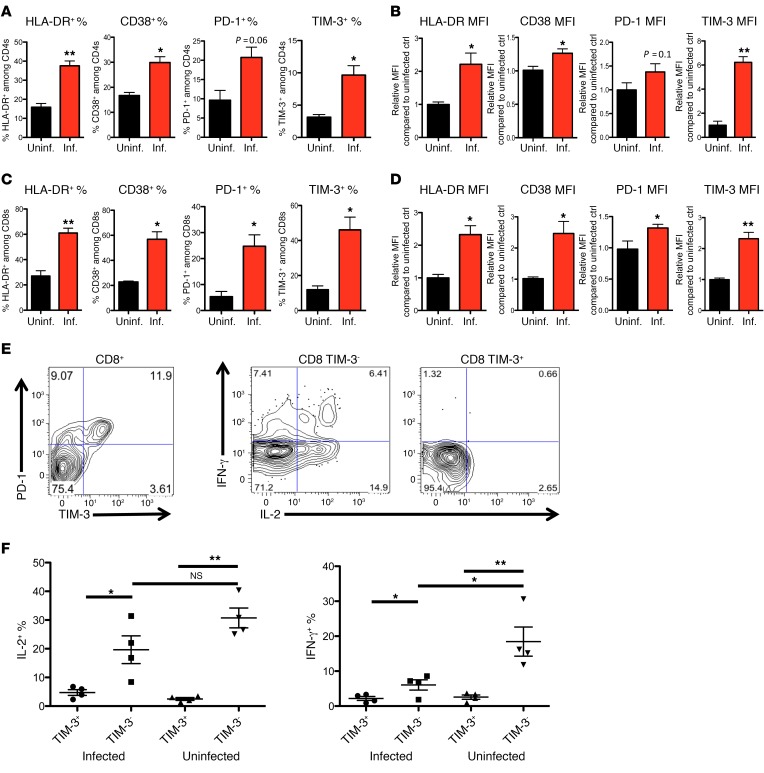
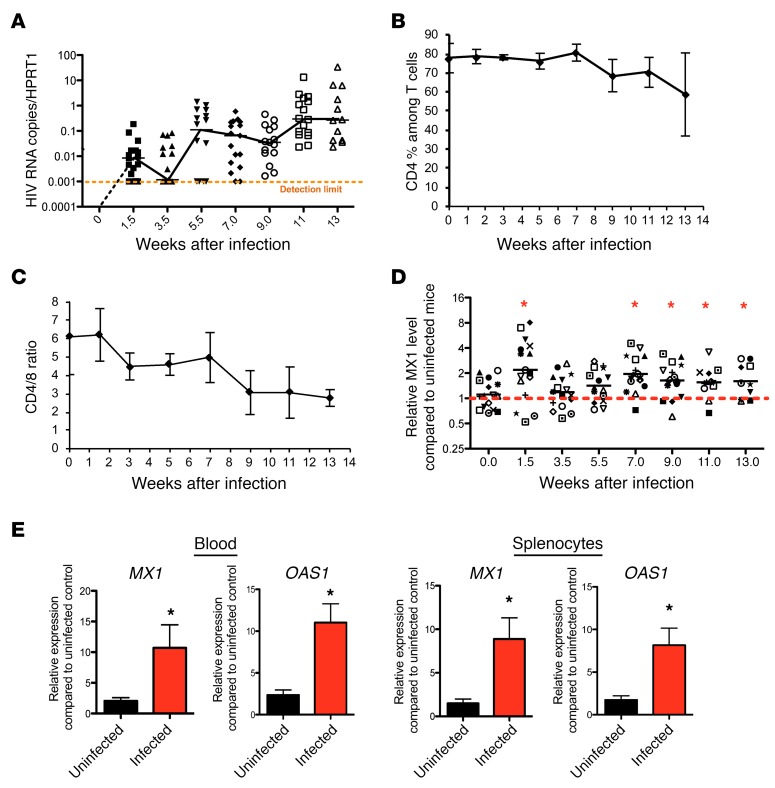
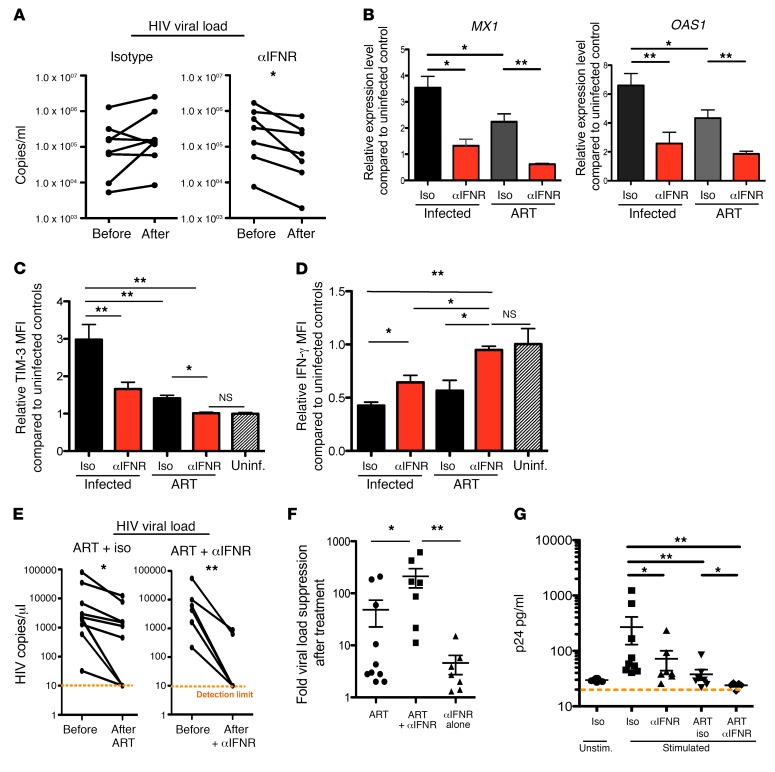
Chronic immune activation, immunosuppression, and T cell exhaustion are hallmarks of HIV infection, yet the mechanisms driving these processes are unclear. Chronic activation can be a driving force in immune exhaustion, and type I interferons (IFN-I) are emerging as critical components underlying ongoing activation in HIV infection. Here, we have tested the effect of blocking IFN-I signaling on T cell responses and virus replication in a murine model of chronic HIV infection. Using HIV-infected humanized mice, we demonstrated that in vivo blockade of IFN-I signaling during chronic HIV infection diminished HIV-driven immune activation, decreased T cell exhaustion marker expression, restored HIV-specific CD8 T cell function, and led to decreased viral replication. Antiretroviral therapy (ART) in combination with IFN-I blockade accelerated viral suppression, further decreased viral loads, and reduced the persistently infected HIV reservoir compared with ART treatment alone. Our data suggest that blocking IFN-I signaling in conjunction with ART treatment can restore immune function and may reduce viral reservoirs during chronic HIV infection, providing validation for IFN-I blockade as a potential therapy for HIV infection.


Conflict of interest statement

The authors have declared that no conflict of interest exists.

Figures

Figure 1
Figure 1. Chronic HIV infection results in elevated expression of activation and exhaustion markers and exhaustion of viral-specific CD8 cells.
NSG-BLT humanized mice were constructed by implantation of fetal liver and fetal thymus as well as hematopoietic stem cells into the NSG mice. After human immune reconstitution, mice were mock-infected or infected with HIVNL4-3. Thirteen weeks after infection, whole blood from each mouse was collected, and cells were stained with anti-human antibodies CD45, CD3, CD4, CD8, TIM-3, PD-1, and HLA-DR and analyzed by flow cytometry. (AD) Expression of HLA-DR, CD38, PD-1, and TIM-3 on human CD4 (A and B) and CD8 cells (C and D) was accessed by gating and by measurement of the percentage positive (A and C) and relative MFI (B and D) of marker expression (n = 3–5 mice per group and more than 1,000 events were acquired for each flow analysis). For relative MFI, data displayed are the mean relative MFI ± SEM of these markers as compared with the mean MFI of uninfected controls, showing differences between these populations. (E) Splenocytes from HIV-infected NSG mice were stimulated with mitogen for 6 hours with GolgiPlug and were stained for expression of CD8, TIM-3, PD-1, and intracellular expression of IL-2 and IFN-γ. More than 1,000 events were acquired for each flow analysis, and the experiment was repeated more than 3 times. (F) Summary and statistical analysis of the intracellular cytokine expression assay in E (n = 4–6 mice per group). The Mann-Whitney test was used to compare 2 groups (*P < 0.05, **P < 0.005) (AE), and the Kruskal-Wallis test was used for multiple comparisons (F, P < 0.05). Data represent mean ± SEM.
Figure 2
Figure 2. IFN-I signaling is chronically elevated during HIV-1 infection.
(A) Change of HIV cell–associated RNA levels in peripheral blood mononuclear cells (PBMCs) from BLT mice after HIV infection as compared with expression of the human housekeeping gene hypoxanthine phosphoribosyltransferase 1 (HPRT). Detection limit is shown by dashed orange line (n = 12–20). (B) CD4% among T cells in PBMCs from BLT mice after HIV infection (n = 12–20 per group). CD4%, percent of CD4+ cells among T cells in PBMCs. (C) CD4/CD8 ratio of T cells in PBMCs from BLT mice after HIV infection (n = 12–20 per group). (D) Expression levels of the MX1 gene in PBMCs throughout chronic HIV-1 infection in comparison with uninfected animals (n = 11–20 per group). Red dashed line defines the relative levels of MX1 gene expression in uninfected mice, which is equal to 1. (E) Expression level of MX1 and OAS1 in PBMCs and splenocytes from uninfected and infected mice as measured by reverse transcriptase PCR (RT-PCR) (n = 4–16 per group). *P < 0.05, Mann-Whitney U test. Data represent mean ± SEM.
Figure 3
Figure 3. IFNR blockade effectively lowers ISG expression levels and reverses immune exhaustion.
(A) Twelve weeks after infection, mice were treated with IFNR blocking antibody (αIFNR) or an isotype antibody control (iso) for 8 days. Expression levels of the ISGs MX1, OAS1, and IRF7 in human PBMCs from humanized BLT mice after treatment were measured by real-time RT-PCR (n = 3–5 per group). (B) PD-1, TIM-3, and CD38 expression as measured by flow cytometry (quantitatively by gating of percentages positive and relative MFIs ± SEM) on T cells from uninfected or infected mice that were treated with IFNR blocking antibody or isotype control (n = 3–7 per group). (C) Splenocytes from HIV-1–infected, isotype antibody–treated, or IFNR antibody–treated mice were stimulated with PMA/ionomycin for 6 hours, and IFN-γ and IL-2 production by CD8 cells was measured by flow cytometry (representative of n = 3 per group). (D) Summary of C as measured by relative MFI. (E) Splenocytes from HIV-1–infected, isotype-treated, or IFNR antibody–treated mice were stimulated with an HIV-1 clade B peptide pool (Pol, Gag, Env, and Nef), and production of IFN-γ by CD8 cells was measured by flow cytometry (representative of n = 3 per group). (F) Summary of the total percentage of IFN-γ+CD8+ cells after HIV peptide pool stimulation. (G) Summary of IFN-γ production by CD8+ cells as measured by relative MFI after HIV peptide pool stimulation. (H) Summary of IFN-γ+CD8+ cell numbers per million lymphocytes. (I) Summary of the relative HLA-DR MFI on CD4 T cells from infected mice treated with isotype or type I IFNR antibody (n = 4–6 per group). The Mann-Whitney test was used to compare 2 groups (*P < 0.05, **P < 0.005), and the Kruskal-Wallis test was used for multiple comparisons (A and B, both P < 0.05). Data represent mean ± SEM. Representative experiments were performed more than 3 times (C and E).
Figure 4
Figure 4. IFNR blockade treatment reduces viral load, and combination of ART and IFNR blockade promotes faster viral suppression and reduces viral reservoir.
(A) Changes of plasma viral load before and after isotype treatment or IFNR blockade. (B) MX1 and OAS1 expression levels from PBMCs in infected mice in different treatment groups as measured by real-time RT-PCR (n = 5–11 per group). (C) Relative TIM-3 expression level of CD8+ T cells in PBMCs from infected mice in different treatment groups as compared with uninfected mice (n = 5–11 per group). (D) Relative IFN-γ MFI of PMA/ionomycin–stimulated CD8+ T cells from infected mice in different treatment groups as compared with uninfected mice (n = 5–11 per group). (E) Changes of viral loads in HIV-1–infected NSG-BLT mice that were treated with ART or ART plus IFNR blockade (n = 7–10 per group). (F) Fold viral suppression after ART treatment, ART with IFNR blockade, or IFNR blockade alone (n = 7–10 per group). (G) HIV p24 production in the supernatant (as measured by ELISA collected from stimulated, sorted HSA cells following the indicated treatments; n = 4–9 per group). The Mann-Whitney U test was used to compare 2 groups (*P < 0.05, **P < 0.005), and the Kruskal-Wallis test was used for multiple comparisons (BD, F, and G; all have P < 0.05). Data represent mean ± SEM.

Comment in

  • Interfering with HIV therapy.
    Lund AW. Lund AW. Sci Transl Med. 2017 Jan 4;9(371):eaal4987. doi: 10.1126/scitranslmed.aal4987. Sci Transl Med. 2017. PMID: 28053154 No abstract available.

References

    1. Jones RB, et al. Tim-3 expression defines a novel population of dysfunctional T cells with highly elevated frequencies in progressive HIV-1 infection. J Exp Med. 2008;205(12):2763–2779. doi: 10.1084/jem.20081398. - DOI - PMC - PubMed
    1. McMichael AJ, Rowland-Jones SL. Cellular immune responses to HIV. Nature. 2001;410(6831):980–987. doi: 10.1038/35073658. - DOI - PubMed
    1. Jin HT, et al. Cooperation of Tim-3 and PD-1 in CD8 T-cell exhaustion during chronic viral infection. Proc Natl Acad Sci U S A. 2010;107(33):14733–14738. doi: 10.1073/pnas.1009731107. - DOI - PMC - PubMed
    1. Khaitan A, Unutmaz D. Revisiting immune exhaustion during HIV infection. Curr HIV/AIDS Rep. 2011;8(1):4–11. doi: 10.1007/s11904-010-0066-0. - DOI - PMC - PubMed
    1. Wilson EB, et al. Blockade of chronic type I interferon signaling to control persistent LCMV infection. Science. 2013;340(6129):202–207. doi: 10.1126/science.1235208. - DOI - PMC - PubMed

Publication types