. 2017 Jan 3;127(1):269-279.
doi: 10.1172/JCI90745. Epub 2016 Dec 12.

Blocking type I interferon signaling enhances T cell recovery and reduces HIV-1 reservoirs

Blocking type I interferon signaling enhances T cell recovery and reduces HIV-1 reservoirs

Liang Cheng et al. J Clin Invest. .

Abstract

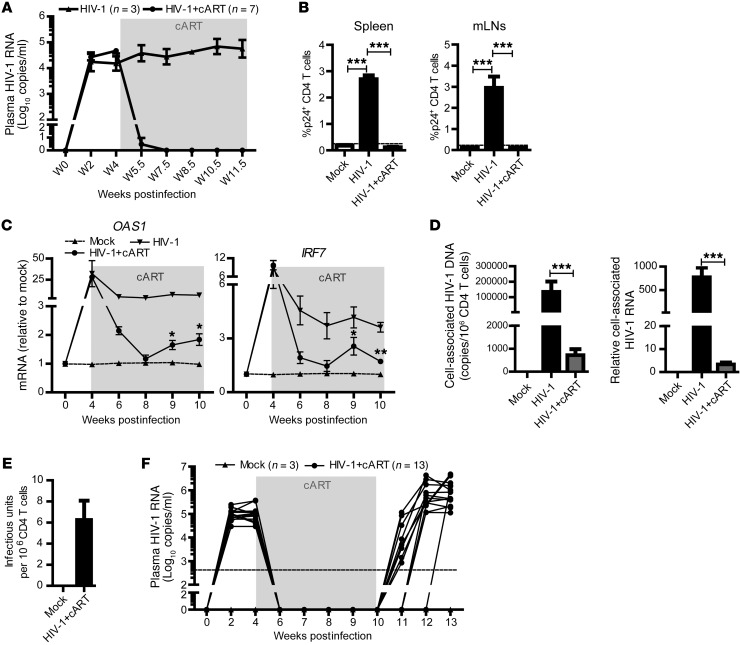
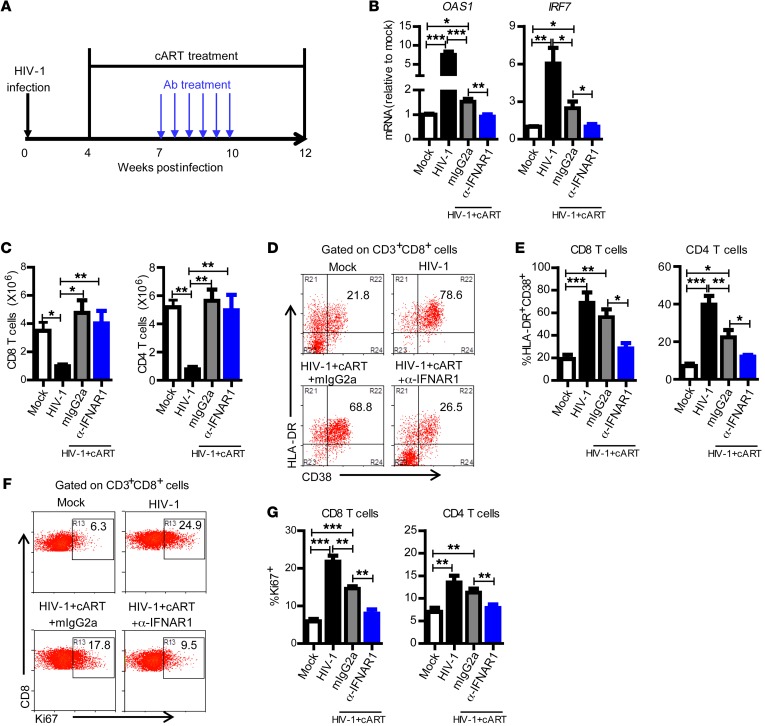
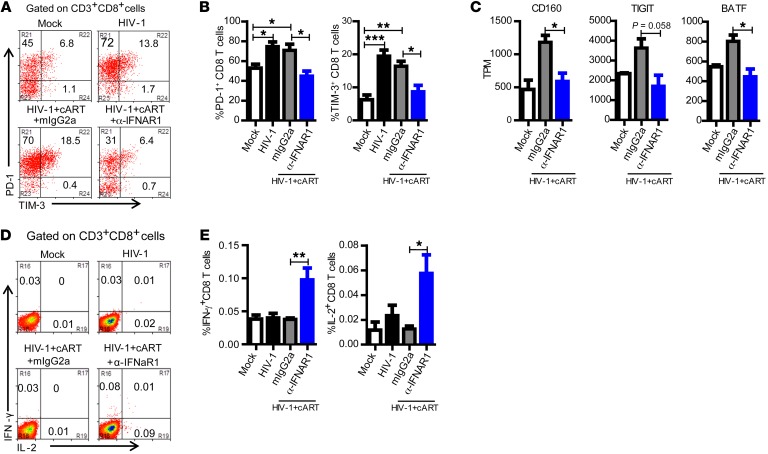
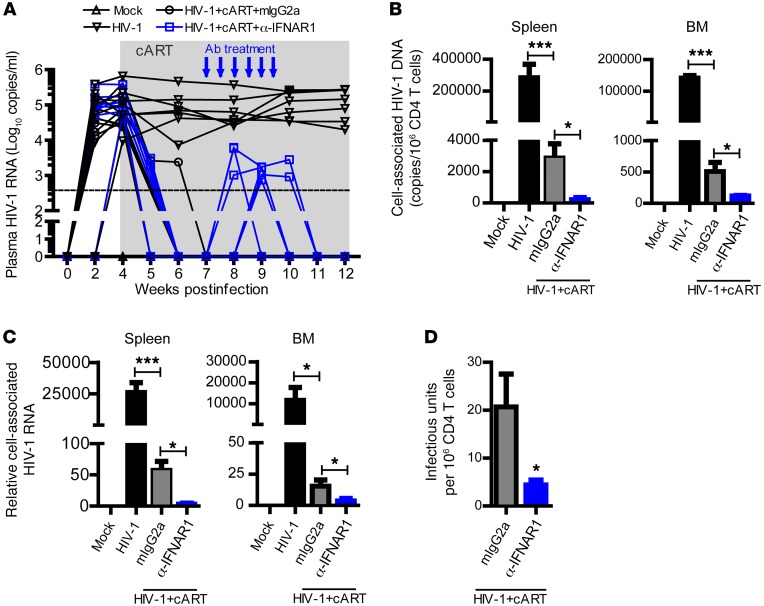
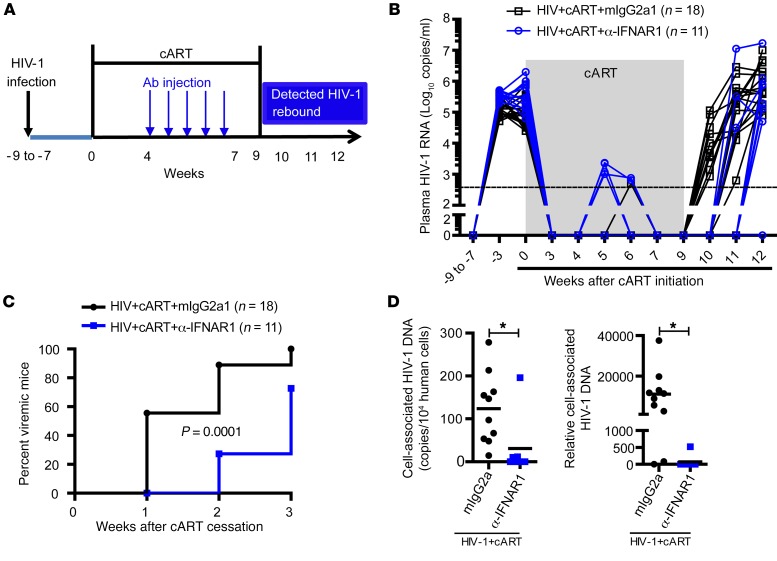
Despite the efficient suppression of HIV-1 replication that can be achieved with combined antiretroviral therapy (cART), low levels of type I interferon (IFN-I) signaling persist in some individuals. This sustained signaling may impede immune recovery and foster viral persistence. Here we report studies using a monoclonal antibody to block IFN-α/β receptor (IFNAR) signaling in humanized mice (hu-mice) that were persistently infected with HIV-1. We discovered that effective cART restored the number of human immune cells in HIV-1-infected hu-mice but did not rescue their immune hyperactivation and dysfunction. IFNAR blockade fully reversed HIV-1-induced immune hyperactivation and rescued anti-HIV-1 immune responses in T cells from HIV-1-infected hu-mice. Finally, we found that IFNAR blockade in the presence of cART reduced the size of HIV-1 reservoirs in lymphoid tissues and delayed HIV-1 rebound after cART cessation in the HIV-1-infected hu-mice. We conclude that low levels of IFN-I signaling contribute to HIV-1-associated immune dysfunction and foster HIV-1 persistence in cART-treated hosts. Our results suggest that blocking IFNAR may provide a potential strategy to enhance immune recovery and reduce HIV-1 reservoirs in individuals with sustained elevations in IFN-I signaling during suppressive cART.


Conflict of interest statement

The authors have declared that no conflict of interest exists.

Figures

Figure 1
Figure 1. cART efficiently inhibits HIV-1 replication but fails to reverse inflammation and clear HIV-1 reservoirs in hu-mice.
(A and B) Hu-mice infected with HIV-1 were treated with cART from 4.5 to 11.5 weeks postinfection (wpi). (A) HIV-1 RNA levels in the plasma of HIV-1–infected (n = 3) and HIV-1–infected, cART-treated mice (n = 7) at indicated time points. (B) Percentage of p24+ CD4 T cells was determined by FACS. Shown are representative data of 3 independent experiments (mock, n = 9; HIV-1, n = 9; HIV-1+cART, n = 15 in total) from n = 4 (mock), n = 3 (HIV-1), or n = 7 (HIV-1+cART) hu-mice per group. (C) Hu-mice infected with HIV-1 were treated with cART from 4 to 10 wpi. Relative mRNA levels of OAS1 and IRF7 in PBMCs are shown at indicated time points. Unpaired, 2-tailed Student’s t test was performed to compare between mock and HIV-1+cART group at each single time point. *P < 0.05, **P < 0.01. Shown are combined data from 2 independent experiments with mean values ± SEM (mock, n = 7; HIV-1, n = 7; HIV-1+cART, n = 8). (D) Cell-associated HIV-1 DNA and relative level of cell-associated HIV-1 RNA to human CD4 mRNA in human cells from spleen were quantified by PCR. (E) Replication-competent HIV-1 viruses from spleen were detected by the quantitative virus outgrowth assay. Shown are representative data (D and E) from n = 4 (mock), n = 4 (HIV-1), and n = 4 (HIV-1+cART) hu-mice per group of 2 independent experiments. ***P < 0.001. One-way ANOVA and Bonferroni’s post hoc test was performed. (F) Hu-mice infected with HIV-1 were treated with cART from 4 to 10 wpi. cART was discontinued at week 10. HIV-1 RNA levels in the plasma of each mouse are shown. The broken horizontal line in F indicates the limit of detection of the assay.
Figure 2
Figure 2. IFNAR blockade during cART-suppressed HIV-1 infection completely reverses aberrant immune activation.
(A) Schematic diagram of the experimental design. Hu-mice infected with HIV-1 were treated with cART from 4 to 12 wpi. From 7 to 10 wpi, the cART-treated mice were injected with α-IFNAR1 antibody or isotype control mIgG2a antibody twice a week. (B) Relative mRNA levels of OAS1 and IRF7 in PBMCs at 9 wpi. (C) Mice were sacrificed at 12 wpi. Summarized data show numbers of human CD8 and CD4 T cells in spleens. (D) Representative dot plots show percentage HLA-DR+CD38+ of CD8 T cells from spleens. (E) Summarized data show percentage HLA-DR+CD38+ of CD8 and CD4 T cells from spleens. (F) Representative dot plots show percentage Ki67+ of CD8 T cells from spleens. (G) Summarized data show percentage Ki67+ of CD8 and CD4 T cells from spleens. Shown are combined data from 2 independent experiments with mean values ± SEM (mock, n = 7; HIV-1, n = 7; HIV-1+cART+mIgG2a, n = 8; HIV-1+cART+α-IFNAR1, n = 8). *P < 0.05, **P < 0.01, ***P < 0.001, by 1-way ANOVA and Bonferroni’s post hoc test.
Figure 3
Figure 3. IFNAR blockade during cART-suppressed HIV-1 infection reverses the exhaustion phenotype of CD8 T cells and restores anti–HIV-1 T cell function.
Hu-mice were treated as in Figure 2. (A) Representative dot plots show percentage PD-1+ and TIM-3+ of CD8 T cells from spleens. (B) Summarized data show percentage PD-1+ and TIM-3+ of CD8 T cells from spleens. (C) RNA sequencing was performed with purified CD8 T cells from spleens. Shown is expression of CD160, TIGIT, and BATF in CD8 T cells from mock-treated (n = 2), HIV-1+cART+mIgG2a–treated (n = 3), and HIV-1+cART+α-IFNAR1–treated (n = 3) hu-mice. Transcripts per kilobase million (TPM) indicates the relative abundance of transcripts. Unpaired, 2-tailed Student’s t test was performed to compare between groups (C). (D and E) Splenocytes were stimulated ex vivo with HIV-1 Gag peptide pools for 8 hours (Brefeldin A added at 3 hours) followed by intracellular cytokine staining. Representative dot plots (D) and summarized data (E) show percentages of IFN-γ– and IL-2–producing CD8 T cells. Shown are combined data from 2 independent experiments (A, B, D, and E) with mean values ± SEM (mock, n = 7; HIV-1, n = 7; HIV-1+cART+mIgG2a, n = 8; HIV-1+cART+α-IFNAR1, n = 8). *P < 0.05, **P < 0.01, ***P < 0.001, by 1-way ANOVA and Bonferroni’s post hoc test.
Figure 4
Figure 4. IFNAR blockade during cART reduces cART-resistant HIV-1 reservoirs.
Hu-mice infected with HIV-1 were treated with cART from 4 to 12 wpi. From 7 to 10 wpi, the cART-treated mice were injected with α-IFNAR1 antibody or isotype control mIgG2a antibody. (A) HIV-1 RNA levels in the plasma. The broken horizontal line indicates the limit of detection (400 copies/ml). (B) Cell-associated HIV-1 DNA in human cells from spleen and bone marrow was quantified by PCR. (C) Relative levels of cell-associated HIV-1 RNA in human cells from spleens and bone marrow were quantified by PCR. (D) Replication-competent HIV-1 viruses from spleens were detected by the quantitative virus outgrowth assay. Shown are combined data from 2 independent experiments with mean values ± SEM (mock, n = 7; HIV-1, n = 7; HIV-1+cART+mIgG2a, n = 8; HIV-1+cART+α-IFNAR1, n = 8). *P < 0.05, ***P < 0.001, by 1-way ANOVA and Bonferroni’s post hoc test.
Figure 5
Figure 5. IFNAR blockade during cART delays HIV-1 rebound after cART cessation.
(A) Schematic diagram of the experimental design. Hu-mice infected with HIV-1 for 7–9 weeks were treated with cART. The mice were then injected with α-IFNAR1 mAb or isotype control mIgG2a antibody 5 times (twice a week) starting from week 4 after cART. cART was maintained for an additional 2.5 weeks after the last antibody treatment. Virus rebound was detected by PCR weekly after cART cessation. (B) Plasma HIV-1 viremia in mice treated with cART plus α-IFNAR1 mAb or control mIgG2a. The broken horizontal line indicates the detection limit. (C) Kinetic analysis of HIV-1 rebound after cART cessation. (D) Cell-associated HIV-1 DNA and RNA in PBMCs at 2 weeks after cART cessation. Shown are combined data of 3 independent experiments (B and C) (HIV-1+cART+mIgG2a, n = 18; HIV-1+cART+α-IFNAR1, n = 11) or 2 independent experiments (D) (HIV-1+cART+mIgG2a, n = 10; HIV-1+cART+α-IFNAR1, n = 7) with mean values ± SEM. *P < 0.05. Gehan-Breslow-Wilcoxon test (C) or unpaired, 2-tailed Student’s t test (D) was performed.

Comment in

  • Interfering with HIV therapy.
    Lund AW. Lund AW. Sci Transl Med. 2017 Jan 4;9(371):eaal4987. doi: 10.1126/scitranslmed.aal4987. Sci Transl Med. 2017. PMID: 28053154 No abstract available.

References

    1. Zuniga EI, Hahm B, Oldstone MB. Type I interferon during viral infections: multiple triggers for a multifunctional mediator. Curr Top Microbiol Immunol. 2007;316:337–357. - PubMed
    1. Schoggins JW, et al. A diverse range of gene products are effectors of the type I interferon antiviral response. Nature. 2011;472(7344):481–485. doi: 10.1038/nature09907. - DOI - PMC - PubMed
    1. Wilson EB, et al. Blockade of chronic type I interferon signaling to control persistent LCMV infection. Science. 2013;340(6129):202–207. doi: 10.1126/science.1235208. - DOI - PMC - PubMed
    1. Teijaro JR, et al. Persistent LCMV infection is controlled by blockade of type I interferon signaling. Science. 2013;340(6129):207–211. doi: 10.1126/science.1235214. - DOI - PMC - PubMed
    1. Doyle T, Goujon C, Malim MH. HIV-1 and interferons: who’s interfering with whom? Nat Rev Microbiol. 2015;13(7):403–413. doi: 10.1038/nrmicro3449. - DOI - PMC - PubMed

Publication types

MeSH terms

Substances