

Spatial Characteristics and Driving Factors of Provincial Wastewater Discharge in China
- PMID: 27941698
- PMCID: PMC5201362
- DOI: 10.3390/ijerph13121221
Spatial Characteristics and Driving Factors of Provincial Wastewater Discharge in China
Abstract
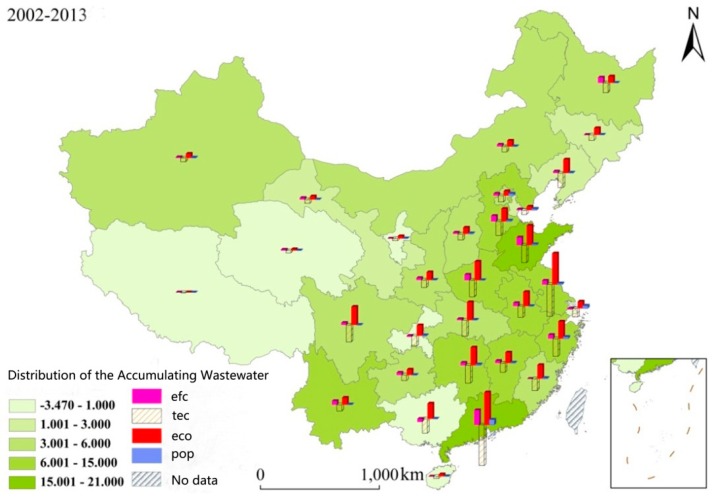
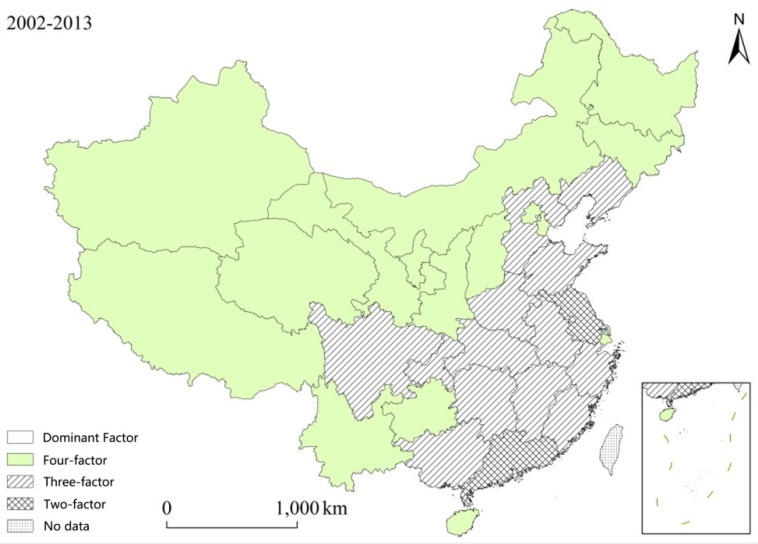
Based on the increasing pressure on the water environment, this study aims to clarify the overall status of wastewater discharge in China, including the spatio-temporal distribution characteristics of wastewater discharge and its driving factors, so as to provide reference for developing "emission reduction" strategies in China and discuss regional sustainable development and resources environment policies. We utilized the Exploratory Spatial Data Analysis (ESDA) method to analyze the characteristics of the spatio-temporal distribution of the total wastewater discharge among 31 provinces in China from 2002 to 2013. Then, we discussed about the driving factors, affected the wastewater discharge through the Logarithmic Mean Divisia Index (LMDI) method and classified those driving factors. Results indicate that: (1) the total wastewater discharge steadily increased, based on the social economic development, with an average growth rate of 5.3% per year; the domestic wastewater discharge is the main source of total wastewater discharge, and the amount of domestic wastewater discharge is larger than the industrial wastewater discharge. There are many spatial differences of wastewater discharge among provinces via the ESDA method. For example, provinces with high wastewater discharge are mainly the developed coastal provinces such as Jiangsu Province and Guangdong Province. Provinces and their surrounding areas with low wastewater discharge are mainly the undeveloped ones in Northwest China; (2) The dominant factors affecting wastewater discharge are the economy and technological advance; The secondary one is the efficiency of resource utilization, which brings about the unstable effect; population plays a less important role in wastewater discharge. The dominant driving factors affecting wastewater discharge among 31 provinces are divided into three types, including two-factor dominant type, three-factor leading type and four-factor antagonistic type. In addition, the proposals aimed at reducing the wastewater discharge are provided on the basis of these three types.
Keywords: ESDA; LMDI; driving factor; spatio-temporal evolution; wastewater discharge.
Conflict of interest statement
The authors declare no conflict of interest.
Figures


Similar articles
-
Quantification of industrial wastewater discharge from the major cities in Sichuan province, China.Environ Sci Pollut Res Int. 2022 Jul;29(34):51567-51577. doi: 10.1007/s11356-022-19316-6. Epub 2022 Mar 4. Environ Sci Pollut Res Int. 2022. PMID: 35244848
-
Analysis of the relationship between economic growth and industrial pollution in Zaozhuang, China-based on the hypothesis of the environmental Kuznets curve.Environ Sci Pollut Res Int. 2016 Aug;23(16):16349-58. doi: 10.1007/s11356-016-6803-1. Epub 2016 May 7. Environ Sci Pollut Res Int. 2016. PMID: 27155838
-
Spatiotemporal coupling measurement of industrial wastewater discharge and industrial economy in China.Environ Sci Pollut Res Int. 2021 Sep;28(34):46319-46333. doi: 10.1007/s11356-021-14743-3. Epub 2021 Aug 2. Environ Sci Pollut Res Int. 2021. PMID: 34341925
-
Spatial and temporal evolution and drivers of GHG emissions from urban domestic wastewater treatment in China: a review at the provincial level.Environ Sci Pollut Res Int. 2024 Mar;31(14):21028-21043. doi: 10.1007/s11356-024-32358-2. Epub 2024 Feb 21. Environ Sci Pollut Res Int. 2024. PMID: 38383929 Review.
-
Antibiotics in soil and water in China-a systematic review and source analysis.Environ Pollut. 2020 Nov;266(Pt 1):115147. doi: 10.1016/j.envpol.2020.115147. Epub 2020 Jul 2. Environ Pollut. 2020. PMID: 32673932
Cited by
-
Spatial Patterns of Urban Wastewater Discharge and Treatment Plants Efficiency in China.Int J Environ Res Public Health. 2018 Aug 31;15(9):1892. doi: 10.3390/ijerph15091892. Int J Environ Res Public Health. 2018. PMID: 30200356 Free PMC article.
-
Decomposition Analysis of Factors Affecting Changes in Industrial Wastewater Emission Intensity in China: Based on a SSBM-GMI Approach.Int J Environ Res Public Health. 2018 Dec 7;15(12):2779. doi: 10.3390/ijerph15122779. Int J Environ Res Public Health. 2018. PMID: 30544577 Free PMC article.
-
The Driving Forces of Point Source Wastewater Emission: Case Study of COD and NH4-N Discharges in Mainland China.Int J Environ Res Public Health. 2019 Jul 17;16(14):2556. doi: 10.3390/ijerph16142556. Int J Environ Res Public Health. 2019. PMID: 31319582 Free PMC article.
-
Spatial and Temporal Characteristics and Drivers of Agricultural Carbon Emissions in Jiangsu Province, China.Int J Environ Res Public Health. 2022 Sep 30;19(19):12463. doi: 10.3390/ijerph191912463. Int J Environ Res Public Health. 2022. PMID: 36231763 Free PMC article.
-
Spatial-temporal characteristics of China's industrial wastewater discharge at different scales.Environ Sci Pollut Res Int. 2020 Mar;27(8):8103-8118. doi: 10.1007/s11356-019-07488-7. Epub 2020 Jan 2. Environ Sci Pollut Res Int. 2020. PMID: 31897983
References
-
- Lee S., Oh D.W. Economic growth and the environment in China: Empirical evidence using prefecture level data. China Econ. Rev. 2015;36:73–85. doi: 10.1016/j.chieco.2015.08.009. - DOI
-
- Sieren F. The China Management Handbook. Palgrave Macmillan; London, UK: 2003. What Should a China Manager Know about China’s Economy, Politics and Society?
-
- Li Q., Song J., Wang E., Hu H., Zhang J., Wang Y. Economic growth and pollutant emissions in China: A spatial econometric analysis. Stoch. Environ. Res. Risk Assess. 2014;2:429–442. doi: 10.1007/s00477-013-0762-6. - DOI
-
- Ministry of Environmental Protection, P.R. China . China Environmental Quality Report. China Environmental Press; Beijing, China: 2011. (In Chinese)
-
- Tang Z., Gong P., Liu W., Li J. Sensitivity of Chinese industrial wastewater discharge reduction to direct input coefficients in an input-output context. Chin. Geogr. Sci. 2015;25:85–97. doi: 10.1007/s11769-014-0666-5. - DOI
MeSH terms
Substances
LinkOut - more resources
Full Text Sources
Other Literature Sources
