. 2017 Jan;23(1):100-106.
doi: 10.1038/nm.4242. Epub 2016 Dec 12.

Bone marrow-derived immature myeloid cells are a main source of circulating suPAR contributing to proteinuric kidney disease

Affiliations

Bone marrow-derived immature myeloid cells are a main source of circulating suPAR contributing to proteinuric kidney disease

Eunsil Hahm et al. Nat Med. 2017 Jan.

Abstract

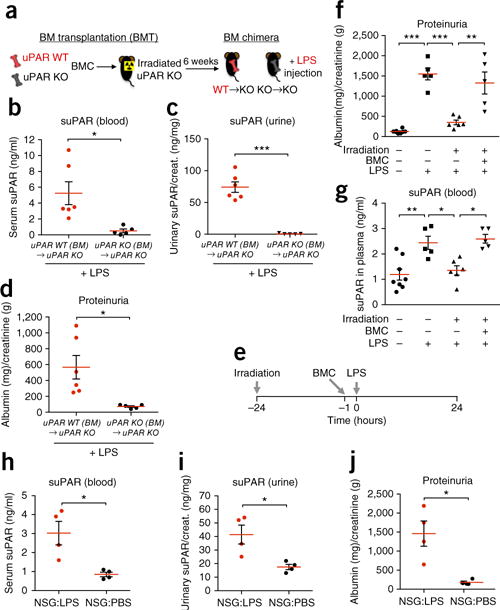
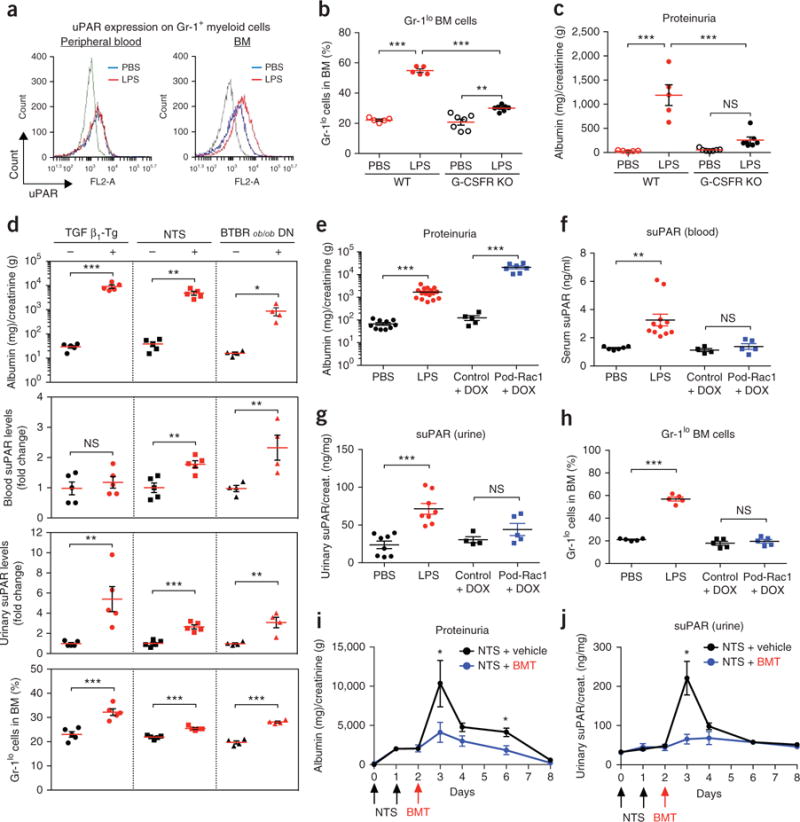
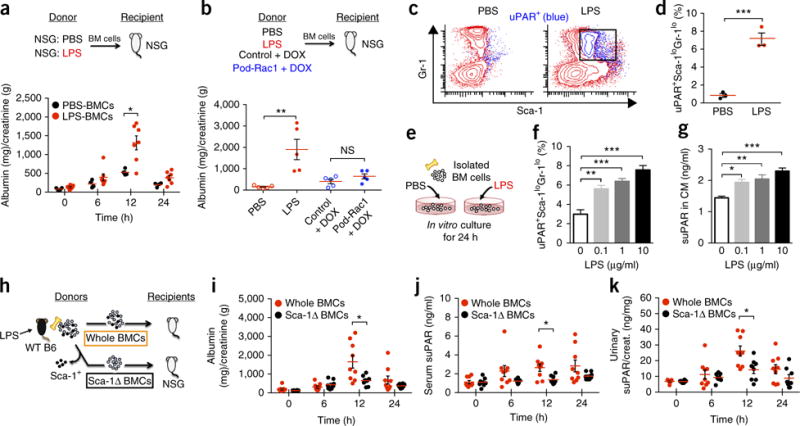
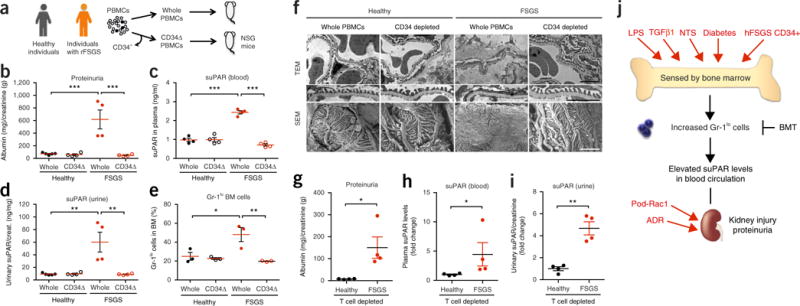
Excess levels of protein in urine (proteinuria) is a hallmark of kidney disease that typically occurs in conjunction with diabetes, hypertension, gene mutations, toxins or infections but may also be of unknown cause (idiopathic). Systemic soluble urokinase plasminogen activator receptor (suPAR) is a circulating factor implicated in the onset and progression of chronic kidney disease (CKD), such as focal segmental glomerulosclerosis (FSGS). The cellular source(s) of elevated suPAR associated with future and progressing kidney disease is unclear, but is likely extra-renal, as the pathological uPAR is circulating and FSGS can recur even after a damaged kidney is replaced with a healthy donor organ. Here we report that bone marrow (BM) Gr-1lo immature myeloid cells are responsible for the elevated, pathological levels of suPAR, as evidenced by BM chimera and BM ablation and cell transfer studies. A marked increase of Gr-1lo myeloid cells was commonly found in the BM of proteinuric animals having high suPAR, and these cells efficiently transmit proteinuria when transferred to healthy mice. In accordance with the results seen in suPAR-associated proteinuric animal models, in which kidney damage is caused not by local podocyte-selective injury but more likely by systemic insults, a humanized xenograft model of FSGS resulted in an expansion of Gr-1lo cells in the BM, leading to high plasma suPAR and proteinuric kidney disease. Together, these results identify suPAR as a functional connection between the BM and the kidney, and they implicate BM immature myeloid cells as a key contributor to glomerular dysfunction.


Conflict of interest statement

COMPETING FINANCIAL INTERESTS

The authors declare competing financial interests: details are available in the online version of the paper.

Figures

Figure 1
Figure 1
Hematopoietic cells are sufficient for suPAR-associated proteinuria. (a) Schematic diagram outlining the experimental design for BM chimera studies. (b–d) Examination of serum (b) and urinary (c) suPAR levels and proteinuria (d) in BM chimeric WT→KO (n = 6) and KO→KO (n = 5) mice that were injected with LPS. Urinary albumin-to-creatinine ratio (ACR) was calculated and used as a parameter to determine proteinuria. Data are shown as mean ± s.e.m.; unpaired two-tailed Student t-test, *P < 0.05, ***P < 0.001. (e) Schematic diagram outlining the experimental design for irradiation and BM reconstitution studies. (f,g) Proteinuria (f) and plasma suPAR levels (g) in BALB/c WT mice that were irradiated (+) or not (−), followed by injection of freshly isolated BMCs (+) or PBS (−), before LPS stimulation. The results are from two independent experiments (n = 8 for PBS, n = 5 for LPS and Irradiation + BMC + LPS, n = 6 for Irradiation + LPS). Data are shown as mean ± s.e.m. One-way ANOVA, followed up by Tukey’s multiple comparison test, *P < 0.05, **P < 0.01, ***P < 0.001. (h–j) Examination of serum (h) and urinary (i) suPAR levels and proteinuria (j) in NSG mice injected with either PBS or LPS (n = 4 per group from two independent experiments). Data are shown as mean ± s.e.m.; unpaired two-tailed Student t-test, *P < 0.05.
Figure 2
Figure 2
Expansion of Gr-1lo BM cells is involved in suPAR-associated proteinuria. (a) Representative overlay histograms of flow cytometric analysis showing the expression profiles of uPAR on the Gr-1+ myeloid cells isolated from the peripheral blood (left) and BM (right) of PBS-injected (n = 4) and LPS-injected (n = 5) mice. The results are representative of two independent experiments. Background fluorescence (gray line) was determined with an irrelevant isotype-matched antibody. Blue line, PBS; red line, LPS. (b,c) The percentages of Gr-1lo cells in BM (b) and the ACR (c) of C57BL/6 WT and G-CSFR KO mice that were injected with LPS or PBS. The results are from two independent experiments (n = 5 for WT PBS and WT LPS, n = 7 for KO PBS and KO LPS). Data are shown as mean ± s.e.m. One-way ANOVA, Tukey’s multiple comparison test, **P < 0.01, ***P < 0.001, NS, not significant. (d) Examination of proteinuria, suPAR levels, and the percentages of Gr-1lo cells in BM from three different animal models of proteinuria: (i) TGF β1-Tg mice (n = 5 per group), (ii) NTS-injected mice (n = 5 per group), and (iii) BTBR ob/ob DN mice (n = 4 per group). Their relevant controls were used as described in the Online Methods. Data are shown as mean ± s.e.m.; unpaired two-tailed Student t-test, *P < 0.05, **P < 0.01, ***P < 0.001, NS, not significant. (e–h) Examination of proteinuria (e), suPAR levels in the serum (f) and urine (g) and the percentages of Gr-1lo cells in BM (h) of LPS injected and Pod-Rac1 transgenic mice. Their relevant controls were used as described in the Online Methods. In e n = 10 for PBS, n = 16 for LPS, n = 5 for control+DOX, n = 7 for Pod-Rac1+DOX); in f n = 6 for PBS, n = 11 for LPS, n = 4 for control+DOX, n = 5 for Pod-Rac1+DOX; in g n = 8 for PBS, n = 8 for LPS, n = 4 for control+DOX, n = 5 for Pod-Rac1+DOX; in h n = 5 per group. Data are shown as mean ± s.e.m.; unpaired two-tailed Student t-test, **P < 0.01, ***P < 0.001, NS, not significant. (i,j) Proteinuria (i) and urinary suPAR levels (j) in the NTS-injected C57BL/6 mice receiving PBS (NTS + vehicle, n = 3) or BMT (NTS + BMT, n = 3). Data are shown as mean ± s.e.m.; unpaired two-tailed Student t-test, *P < 0.05.
Figure 3
Figure 3
BM immature myeloid cells have an ability to transfer disease. (a) Examination of proteinuria in recipient NSG mice before (0) and 6, 12, and 24 h after adoptive transfer of BM cells obtained from PBS- or LPS-injected NSG mice. The results are from two independent experiments (n = 4 for PBS-BMCs; n = 7 for LPS-BMCs). Data are shown as mean ± s.e.m.; unpaired two-tailed Student t-test, *P < 0.05. (b) Examination of proteinuria in recipient NSG mice 12 h following adoptive transfer of BM cells obtained from LPS-challenged C57BL/6 WT and Pod-Rac1 mice. n = 5 per group. Data are shown as mean ± s.e.m. One-way ANOVA, Tukey’s multiple comparison test, **P < 0.01, NS, not significant. (c) Representative dot plots (chosen from a total of three generated) of triple-color stained (uPAR/Sca-1/Gr-1) total BM cells (red) isolated from PBS- or LPS-injected C57BL/6 mice (n = 3 per group). uPAR+ cells (blue) were gated and shown in these dot plots. (d) Quantitation for uPAR-expressing immature myeloid cells (uPAR+Sca-1loGr-1lo) cells shown in c (n = 3 per group). Data are shown as mean ± s.e.m.; unpaired two-tailed Student t-test, ***P < 0.001. (eg) In vitro culture of total BM cells isolated from C57BL/6 WT mice with PBS or various concentrations of LPS (0.1, 1, and 10 μg/ml). (e) Experimental scheme. (f) In vitro induction of uPAR+Sca-1loGr-1lo cells determined by triple color-flow cytometric analysis. (g) suPAR secretion into culture medium (CM) measured by suPAR ELISA. Data are shown as mean ± s.e.m. One-way ANOVA, Tukey’s multiple comparison test, *P < 0.05, **P < 0.01, ***P < 0.001. (h) Schematic diagram outlining the experimental design of the BM cell transfer used in i–k. (i–k) Examination of proteinuria (i), serum (j) and urinary suPAR levels (k) in recipient NSG mice before (0) and 6, 12, and 24 h after adoptive transfer of either whole BM cells or Sca-1+ cell-depleted (Sca-1Δ) BM cells of LPS-challenged C57BL/6 WT mice. The results are from three independent experiments (n = 9 for whole BMCs; n = 8 for Sca-1ΔBMCs). Data are shown as mean ± s.e.m.; unpaired two-tailed Student t-test, *P < 0.05.
Figure 4
Figure 4
hFSGS CD34+ cells induce suPAR-associated proteinuria in mice. (a) Schematic diagram outlining the studies of humanized mice. rFSGS, recurrent FSGS. (b–e) Proteinuria (b), mouse suPAR levels in plasma (c) and in urine (d), percentages of Gr-1lo cells in BM (e) of the xenograft mice after 1012 weeks post-engraftment. The results are from two independent experiments. In bd, n = 4 per group, except n = 5 for healthy whole PBMCs; in e, n = 3 per group. Data are shown as mean ± s.e.m. One-way ANOVA, followed up by Tukey′s multiple comparison test, *P < 0.05, **P < 0.01, ***P < 0.001. (f) Transmission and scanning electron microscope (TEM, 10,000×, and SEM, 15,000×) analysis of kidney glomeruli of the xenograft mice. TEM images displaying podocyte foot processes were enlarged and highlighted. SEM images show a podocyte cell body, primary processes and interdigitating foot processes. Scale bars, 2 μm. (gi) T-cell-depleted PBMCs of individuals with recurrent FSGS or healthy donors were injected into NSG mice. Proteinuria (g), mouse suPAR levels in plasma (h) and in urine (i) of the xenograft mice after 16 weeks post-engraftment (n = 4 per group). Data are shown as mean ± s.e.m. Student’s t-test, *P < 0.05, **P < 0.01. (j) Model depicting a role for Gr-1lo BM immature myeloid cells in suPAR-driven podocyte injury and proteinuria. Systemic immunological proteinuric models—LPS, hFSGS xenograft, TGF β1 transgenic (fibrosing nephrotic syndrome), NTS (serum nephritis) and BTBR ob/ob (diabetic nephropathy)—converge at the expansion of Gr-1lo cells in BM and high blood suPAR levels.

Comment in

References

    1. Fogo AB. Mechanisms of progression of chronic kidney disease. Pediatr Nephrol. 2007;22:2011–2022. - PMC - PubMed
    1. Hayek SS, et al. Soluble urokinase receptor and chronic kidney disease. N Engl J Med. 2015;373:1916–1925. - PMC - PubMed
    1. Wei C, et al. Modification of kidney barrier function by the urokinase receptor. Nat Med. 2008;14:55–63. - PubMed
    1. Wei C, et al. Circulating urokinase receptor as a cause of focal segmental glomerulosclerosis. Nat Med. 2011;17:952–960. - PMC - PubMed
    1. Cravedi P, Kopp JB, Remuzzi G. Recent progress in the pathophysiology and treatment of FSGS recurrence. Am J Transplant. 2013;13:266–274. - PMC - PubMed

Publication types

Substances