. 2017 Jan;23(1):69-78.
doi: 10.1038/nm.4247. Epub 2016 Dec 12.

Loss of the histone methyltransferase EZH2 induces resistance to multiple drugs in acute myeloid leukemia

Affiliations

Loss of the histone methyltransferase EZH2 induces resistance to multiple drugs in acute myeloid leukemia

Stefanie Göllner et al. Nat Med. 2017 Jan.

Abstract

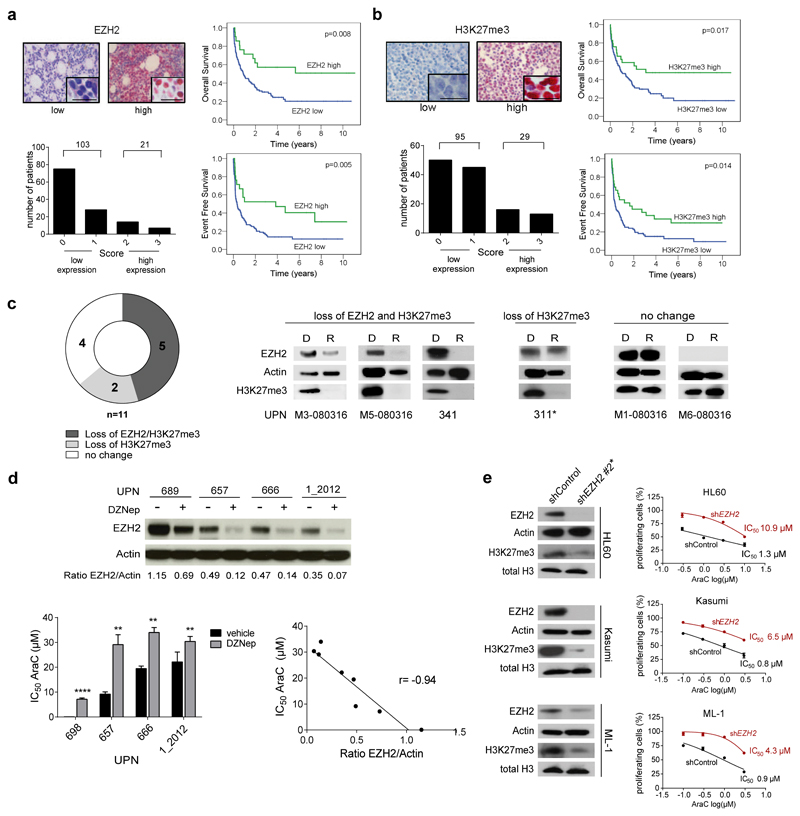
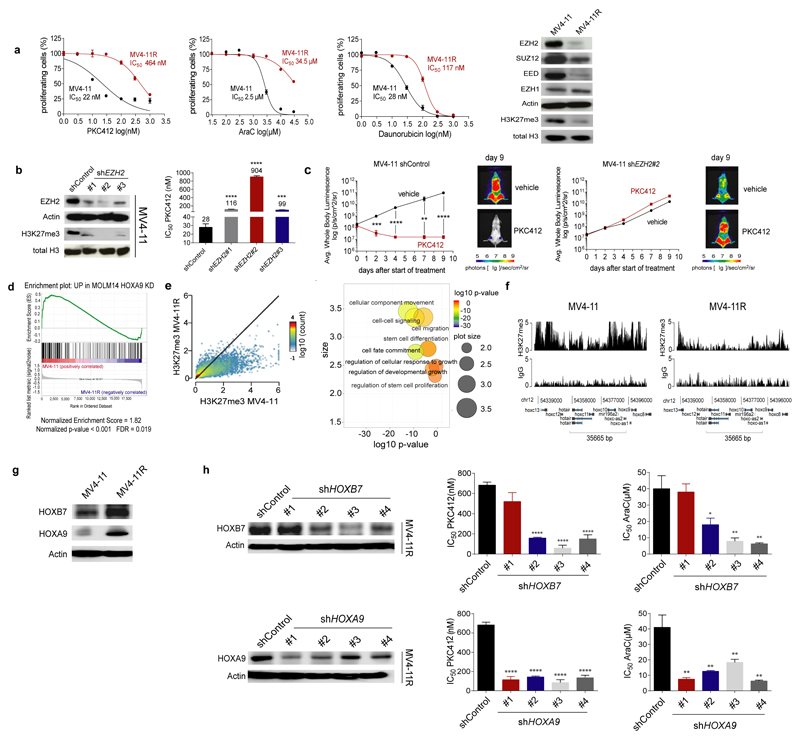
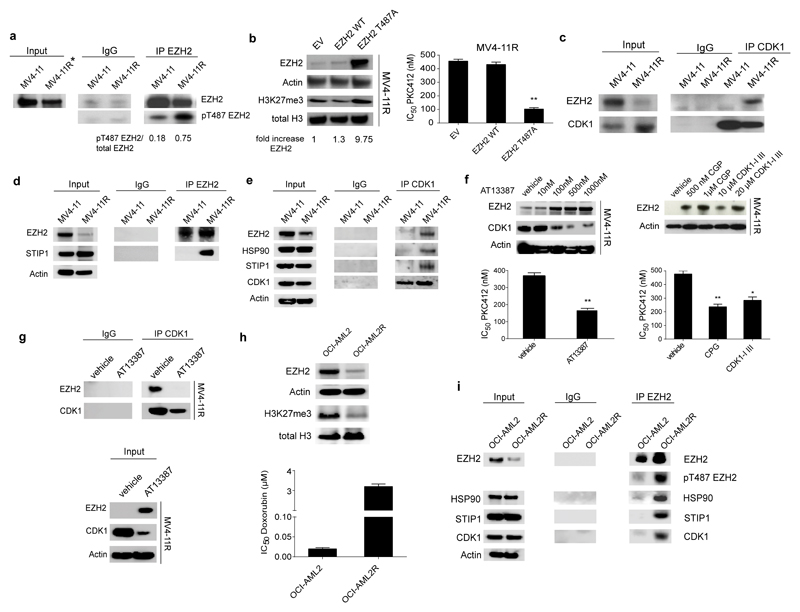
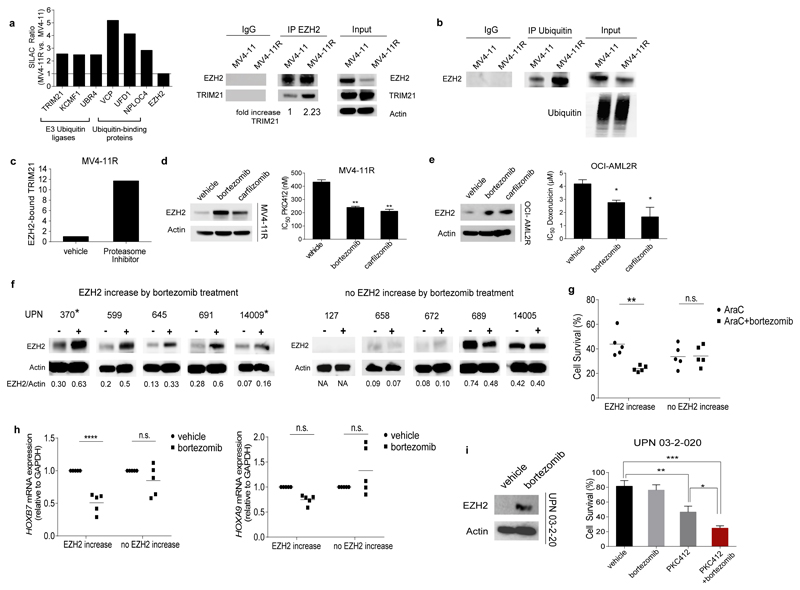
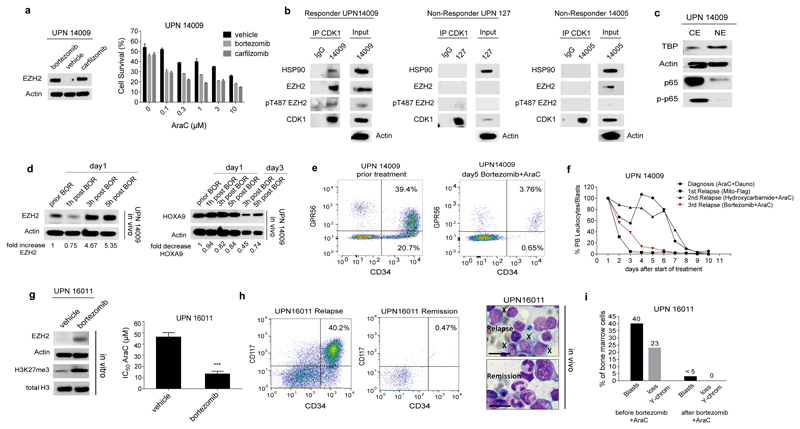
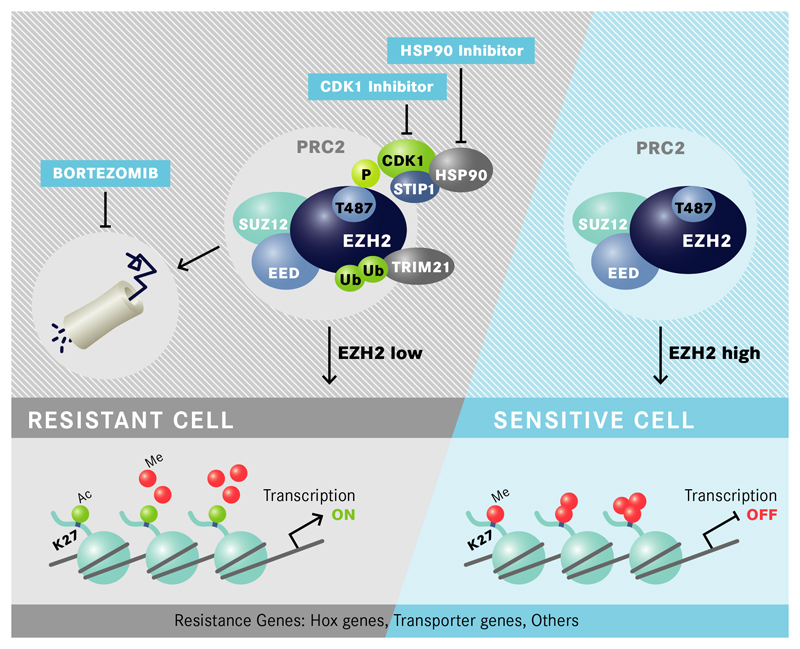
In acute myeloid leukemia (AML), therapy resistance frequently occurs, leading to high mortality among patients. However, the mechanisms that render leukemic cells drug resistant remain largely undefined. Here, we identified loss of the histone methyltransferase EZH2 and subsequent reduction of histone H3K27 trimethylation as a novel pathway of acquired resistance to tyrosine kinase inhibitors (TKIs) and cytotoxic drugs in AML. Low EZH2 protein levels correlated with poor prognosis in AML patients. Suppression of EZH2 protein expression induced chemoresistance of AML cell lines and primary cells in vitro and in vivo. Low EZH2 levels resulted in derepression of HOX genes, and knockdown of HOXB7 and HOXA9 in the resistant cells was sufficient to improve sensitivity to TKIs and cytotoxic drugs. The endogenous loss of EZH2 expression in resistant cells and primary blasts from a subset of relapsed AML patients resulted from enhanced CDK1-dependent phosphorylation of EZH2 at Thr487. This interaction was stabilized by heat shock protein 90 (HSP90) and followed by proteasomal degradation of EZH2 in drug-resistant cells. Accordingly, inhibitors of HSP90, CDK1 and the proteasome prevented EZH2 degradation, decreased HOX gene expression and restored drug sensitivity. Finally, patients with reduced EZH2 levels at progression to standard therapy responded to the combination of bortezomib and cytarabine, concomitant with the re-establishment of EZH2 expression and blast clearance. These data suggest restoration of EZH2 protein as a viable approach to overcome treatment resistance in this AML patient population.


Conflict of interest statement

Competing financial interests

The authors declare no competing financial interests.

Figures

Figure 1
Figure 1. Loss of EZH2 associates with poor prognosis and chemoresistance in AML
(a) EZH2 and b) H3K27me3 immunohistochemistry staining of bone marrow biopsies from 124 AML patients at time of diagnosis. Clinical data are provided in Supplementary Table 1. Nuclear staining of AML blasts was assessed using Remmele´s Immunoreactive Score (IRS). Representative positive and negative stainings are shown. Scale bars indicate 20 µm. Insets show high-magnification images (top left). The number of patients with low or high EZH2 or H3K27me3 protein expression, respectively, is given (bottom left). Kaplan-Meyer Plots for overall survival (OS) and event free survival (EFS) are given for patients with low and high EZH2 or H3K27me3 protein levels (log-rank test) (right). (c) Frequency of EZH2 and H3K27me3 loss at relapse. Protein extracts were prepared from matched patients blasts at diagnosis and subsequent relapse (n=11 pairs). Immunoblots were performed probing membranes with anti-EZH2, anti-beta Actin and anti-H3K27me3 antibodies. Representative Western Blots for each group are given. For remaining diagnosis-relapse pairs see Suppl. Fig. 1g. UPN= unique patient number, D= Diagnosis, R= Relapse. The asterisk indicates samples with ASXL1 mutation at relapse. Mutation data of 54 genes of a myeloid panel are provided for diagnosis and relapse samples in Suppl. Table 3. For all western blot images full length blots have been cropped for better presentation of results. For full length blots see Supplementary Information. (d) Primary AML cells from patients with normal karyotype (NK) were exposed to vehicle or 1 µM of the methyltransferase inhibitor DZNep for 24 hours. EZH2 protein levels were analyzed by western blot (top). AML blasts were treated with vehicle (-) or DZNep (+) for 24 hours and subsequently exposed to increasing concentrations of cytarabine (AraC). IC50 values for AraC were determined. Means ± s.d. are shown for three technical replicates (bottom left). EZH2/Actin ratios as calculated from western blots using densitometry (see top panel) and AraC IC50 values (see bottom left panel) determined for blasts from all four AML patients with and without DZNep exposure were plotted. An inverse correlation was observed (r= -0.94, p= 0.0005) (bottom right). UPN= unique patient number. Patients characteristics are given in Suppl. Table 4. (e) EZH2 suppression by shRNAs. Three different shRNAs were initially tested of which shEZH2 #2 conferred the strongest knockdown (see Fig. 2b) and was chosen for further experiments. EZH2 and H3K27me3 protein expression was analyzed in HL60, Kasumi-1 and ML-1 cells transduced with either shControl or shEZH2 #2 (left). Data are representative for two independent experiments. HL60-, Kasumi- and ML-1 shControl and shEZH2 #2 cells were exposed to increasing concentrations of AraC for 72 hours. MTS assays were performed to determine the percentage of proliferating cells. Means ± s.d. are shown for three independent experiments (right).
Figure 2
Figure 2. Loss of EZH2 induces dysregulation of HOX genes in resistant AML cells
(a) Sensitive and drug-resistant MV4-11 (termed MV4-11R) cells were exposed to increasing concentrations of PKC412, AraC or daunorubicin for 72 hours. MTS assays were performed to determine the percentage of viable, proliferating cells. Means are given for three independent experiments ± s.d. IC50 values were calculated by nonlinear-regression analysis of inhibitor versus normalized response and are indicated (left). Immunoblotting of protein extracts from MV4-11 and MV4-11R was performed to detect PRC2 proteins and H3K27me3. Blots are representative for three independent experiments (right). (b) Sensitive parental MV4-11 cells were lentivirally transduced with shRNAs targeting EZH2. Protein extracts of MV4-11 shControl and shEZH2 cells were analyzed for EZH2 and H3K27me3 protein expression. Data are representative for two independent experiments (left). MV4-11 shControl and shEZH2 cells were exposed to increasing concentrations of PKC412 for 72 hours. MTS assays were performed to determine the percentage of viable, proliferating cells and IC50 values were calculated as described. Means are indicated for three independent experiments ± s.d. (*** p= 0.0002, **** p< 0.0001) (right). (c) 5×10⁶ MV4-11 shControl-luc or MV4-11 shEZH2 #2-luc cells were injected i.v. into NSG mice. Three days after tumour cell injection mice were treated with vehicle or PKC412 (75 mg/kg/d) by oral gavaging once daily for 9 consecutive days starting at day 3 post-transplantation. Leukemic bone marrow infiltration was monitored by noninvasive luciferase imaging. Means ± s.d. are given for each group (** p=0.0022, *** p=0.001, **** p< 0.001) (n=6 for PKC412 treatment groups, n=4 for vehicle groups). (d) Gene Set Enrichment Analysis (GSEA) showed significant enrichment of upregulated genes in sensitive MV4-11 with genes upregulated in Molm14 HOXA9 knockdown cells (Normalized Enrichment Score (NES) of 1.82 (p <0.001, false discovery rate [FDR] = 0.019). (e) ChIP-Seq revealed significant loss of H3K27me3 at multiple loci in MV4-11R cells. Depicted are H3K27me3 positive loci in sensitive and resistant cells (n=11472, r=0.584) (left). Gene Ontology (GO)- pathways analysis was performed for all genes with reduced H3K27me3 in MV4-11R cells. GO- IDs were visualized using RVIGO (Reduce and Visualize Gene Ontology). Representative, significantly overrepresented biological process pathways are shown (right). (f) ChIP-Seq of H3K27me3 levels at HOX gene loci in MV4-11 and MV4-11R cells are shown. ChIP DNA from three independent experiments was pooled and sequenced. (g) HOXB7 and HOXA9 protein expression was determined in MV4-11 and MV4-11R cells by western blotting. Blots are representative for two independent experiments. (h) MV4-11R cells were lentivirally transduced with different shRNAs targeting HOXB7 or HOXA9, respectively, and protein extracts were analyzed for HOXB7 and HOXA9 expression. Data are representative for two independent replicates (left). Control cells, HOXB7- and HOXA9- knockdown cells were exposed to increasing concentrations of PKC412 and AraC respectively, for 72 hours. MTS assays were performed to determine the percentage of viable, proliferating cells. Means of IC50 values ± s.d. are shown for three independent experiments (* p= 0.0131, ** p < 0.009, **** p< 0.0001) (right).
Figure 3
Figure 3. CDK1- mediated T487 phosphorylation of EZH2 associates with drug resistance in AML cells
(a) Protein extracts from MV4-11 and MV4-11R cells were immunoprecipitated using anti-EZH2 antibody. Precipitated proteins were immunoblotted and analyzed with an EZH2 antibody recognizing a different epitope of EZH2 as well as anti-phosphoT487 EZH2 antibody. Results are representative for two independent experiments. For IP experiments a 5-fold excess of resistant IP-lysate was used to normalize IPs for reduced EZH2 levels in resistant cells. The asterisk marks a 5-fold excess of lysate in Input. IP using an IgG antibody served as negative control. (b) MV4-11R cells were lentivirally transduced with Empty Vector (EV), EZH2 WT or EZH2 T487A mutant. Protein lysates were analyzed for expression of EZH2 and H3K27me3. Results represent data from two independent experiments (left). Resistant cells with EV, EZH2 WT or EZH2 T487A, respectively, were treated with increasing concentrations of PKC412 for 72 hours. MTS assays were performed to determine the percentage of viable, proliferating cells. IC50 values are indicated. Means ± s.d. are shown for three independent experiments (right). (c) Protein lysates from MV4-11 and MV4-11R cells were prepared and CDK1-bound proteins were pulled-down by anti-CDK1 antibody using 500 µg of protein. Enriched proteins were immunoblotted and probed with anti-CDK1 and anti-EZH2 antibody. Results are representative for two independent experiments. (d) Protein extracts from MV4-11 and MV4-11R cells were immunoprecipitated using anti-EZH2 antibody. A 5-fold excess of resistant IP-lysate was used to normalize IPs for reduced EZH2 levels in resistant cells. Precipitated proteins were immunoblotted and analyzed with anti-STIP1 antibody. Results are representative for two independent experiments. (e) Protein extracts from MV4-11 and MV4-11R cells were immunoprecipitated using anti-CDK1 antibody. Precipitated proteins were immunoblotted and analyzed with anti-STIP1, anti-HSP90, anti-EZH2 and anti-CDK1 antibody. Results are representative for two independent experiments. (f) MV4-11R cells were treated with indicated concentrations of the HSP90 inhibitor AT13387 (left) or with the CDK1 inhibitors CGP74514A (CGP) and CDK1-Inhibitor III (CDK1-I III) (right) for 24 hours. Protein lysates were analyzed for expression of EZH2, CDK1 and Actin by western blot. Blots are representative for two independent experiments (top). Resistant cells were pretreated with 500 nM AT13387, 1µM CGP or 20µM CDK1-I III for 6 hours and proliferation of cells was analyzed in the presence of increasing concentrations of PKC412 after 48 hours by MTS assay. IC50 values are given. Means ± s.d. are shown for three independent experiments (** p< 0.008, * p=0.015) (bottom). (g) MV4-11R cells were either treated with vehicle or 500nM of the HSP90 inhibitor AT13387 for 24 hours. Protein lysates were prepared and 1000 µg of total protein was immunoprecipitated using anti-CDK1 antibody. Precipitated proteins were immunoblotted and analyzed with anti-EZH2 and anti-CDK1 antibody. IP using an IgG antibody is provided as negative control (top). Input is shown using 20 µg of total protein (bottom). Results are representative for two independent experiments. (h) Immunoblotting of protein extracts from OCI-AML2 and OCI-AML2R was performed to detect EZH2, Actin, H3K27me3 and total H3. Blots are representative for two independent experiments (top). Sensitive OCI-AML2 and doxorubicin-resistant OCI-AML2R cells were exposed to increasing concentrations of doxorubicin for 72 hours. MTS assays were performed to determine the IC50 of doxorubicin. Means are given for three biological replicates ± s.d. (bottom). (i) Protein extracts from OCI-AML2 and OCI-AML2R cells were immunoprecipitated using anti-CDK1 antibody. Precipitated proteins were immunoblotted and analyzed with anti-STIP1, anti-HSP90, anti-EZH2, anti-pT487 EZH2 and anti-CDK1 antibodies. Results are representative for two independent experiments.
Figure 4
Figure 4. EZH2 is degraded by the proteasome in resistant cells and proteasome inhibitors restore EZH2 protein levels and drug sensitivity
(a) Ubiquitin degradation pathway-associated proteins bind preferentially to EZH2 in resistant cells. Enrichment is represented by the SILAC Ratio ((H/L normalized MV4-11R) / (H/L normalized MV4-11)). H= heavy isotope, L= light isotope. Protein names are indicated at bottom of bars (left). Protein extracts from MV4-11 and MV4-11R cells were immunoprecipitated using anti-EZH2 antibody. A 5-fold excess of resistant IP-lysate was used to normalize IPs for reduced EZH2 levels in resistant cells. Precipitated proteins were immunoblotted and analyzed with anti-TRIM21 and anti-EZH2 antibody. Results are representative for two independent experiments. IP using an IgG antibody is provided as negative control (right). (b) Immunoprecipitation using anti-Ubiquitin antibody and subsequent immunoblot for EZH2 in MV4-11 and MV4-11R cells. A 5-fold excess of resistant IP-lysate was used to normalize IPs for reduced EZH2 levels in resistant cells. Results are representative for two independent experiments (c) Enrichment of EZH2-bound TRIM21 in MV4-11R and MV4-11R treated with Proteasome Inhibitors was calculated from the SILAC Ratio ((H/L normalized MV4-11R+Proteasome Inhibitor) / (H/L normalized MV4-11R)) and standardized to EZH2 levels. (d) MV4-11R cells were exposed to 10 nM bortezomib or carfilzomib for 24 hours. Protein lysates were analyzed for expression of EZH2 by western blot. Data represent two independent experiments (left). MV4-11R cells were pretreated with 10 nM bortezomib or carfilzomib, respectively, for 6 hours and proliferation of cells was analyzed in the presence of increasing concentrations of PKC412 after 48 hours by MTS assay. Means of IC50 values ± s.d. are shown for three independent experiments (** p< 0.01) (right). (e) OCI-AML2R cells were incubated with 10nM bortezomib or carfilzomib for 24 hours. Protein lysates were analyzed for the expression of EZH2. Data are representative for two independent experiments (left). OCI-AML2R cells were pretreated for 6 hours with 10nM bortezomib or carfilzomib and proliferation of cells was analyzed in the presence of increasing concentrations of doxorubicin after 72 hours by MTS assay. Means of IC50 values ± s.d. are shown for three independent experiments (* < 0.05) (right). (f) Samples from AML patients with normal karyotype and low to intermediate EZH2 levels were cultured in vitro and exposed to 10nM bortezomib for 6 hours. EZH2/Actin ratios are indicated. Samples from relapsed patients are marked by asterisks. (-) indicates exposure to vehicle, (+) indicates exposure to bortezomib. Clinical characteristics for all patients are listed in Suppl. Table 15. Patients 370, 599 and 689 possess FLT3-ITD mutation. (g) Treatment response of AML patients blasts with and without EZH2 increase after bortezomib exposure. Blasts were pretreated for 6 hours with 10nM of bortezomib and subsequently exposed to AraC for 48 hours. Data are analyzed by two-way ANOVA with Sidaks post-hoc test (** p< 0.005). (h) HOXB7 (left) and HOXA9 (right) mRNA expression of AML patients with and without EZH2 increase after bortezomib exposure. The expression of vehicle-treated samples was set at 1 as reference. Data are analyzed by two-way ANOVA with Sidaks post-hoc test (**** p<0.0001). (i) Primary AML cells from a relapsed AML patient with FLT3-ITD mutation (UPN 03-2-020) were exposed to vehicle or 10 nM bortezomib for 6 hours. EZH2 protein levels were analyzed by western blot (left). Vehicle- or bortezomib-pretreated AML blasts were exposed to 10nM of PKC412. Cell survival was determined by Acridin Orange/PI staining and cell counting from three technical replicates (* p= 0.0122, ** p= 0.0056, *** p= 0.0003) (right).
Figure 5
Figure 5. Bortezomib- induced EZH2 increase in AML patients and therapy response
(a) In vitro treatment of primary cells from the 3rd relapse of patient UPN14009 with bortezomib or the 2nd generation proteasome inhibitor carfilzomib. EZH2 protein levels after 6-hour- treatment are shown (left). Pretreated cells were exposed to increasing concentrations of AraC and cell survival was determined by trypan blue exclusion and cell counting from three technical replicates (right). (b) Co-IPs were performed for patient samples from which sufficient material was available (UPN 14009, 127 and 14005). Protein extracts were prepared from 5 x10⁷ blast cells and immunoprecipitated using anti-CDK1 antibody. Precipitated proteins were immunoblotted and analyzed with anti-CDK1, anti-EZH2, anti-pT487EZH2 and anti-HSP90 antibodies. Bortezomib Responders and Non-Responders are indicated. (c) Cytoplasmic (CE) and nuclear extracts (NE) were prepared from Ficoll enriched bone marrow (BM) blasts of patient UPN14009 and analyzed for protein expression of total and phosphorylated p65. Expression of Actin was used as loading control for cytoplasmic extracts. Expression of TATA-Box Binding Protein (TBP) was used as loading control for nuclear extracts. Data are representative for two independent experiments. (d) Subsequent to in vitro efficacy testing AML relapse patient UPN14009 was treated with bortezomib and AraC. Ficoll-enriched blasts from peripheral blood (PB) were analyzed at indicated time points for EZH2 protein expression (left) and HOXA9 protein expression (right). EZH2 and HOXA9 levels, respectively, were normalized to Actin using densitometry and EZH2 fold change was calculated for different time points after bortezomib application. The EZH2 protein level before bortezomib application was set at 1 as reference. BOR= bortezomib (e) Flow Cytometry analysis of CD34 and GPR56 expression was performed on blasts of patient UPN14009 during the course of treatment. 10.000 CD45-positive events were analyzed per time point. (f) Decline of leukocytes is indicated during treatment course of diagnosis, first, second and third relapse of patient UPN14009. Bortezomib+AraC treatment is marked in red. Dosage of each treatment is provided in Suppl. Table 16. (g) Blasts of patient 16011 were cultured in vitro and exposed to 10nM bortezomib for 24 hours. EZH2 protein levels were analyzed by western blot (left). Blasts were pretreated with 10nM bortezomib for 6 hours and proliferation of cells was analyzed in the presence of increasing concentrations of AraC after 48 hours by MTS assay and IC50 values were calculated. Data represent mean ± s.d. from three technical replicates (*** p= 0.0002) (right). (h) Flow Cytometry analysis of CD34 and CD17 expression was performed on blasts of patient UPN16011 at relapse and upon remission after bortezomib+AraC treatment (left). About 40% blast cells (marked by X) were present in bone marrow at the time of relapse. After therapy with bortezomib and AraC, remission was achieved with differentiating hematopoiesis and absence of leukemic blasts as demonstrated by hematoxylin-eosin staining. Scale bar indicates 10 µm (right). (i) Results of the bone marrow analysis before and after relapse treatment with bortezomib and AraC. Shown are the fraction of blast cells (<5% indicates remission) and the fraction of bone marrow cells with loss of Y-chromosome in Fluorescence in situ hybridization (500 cells counted). Loss of Y-chromosome was used as the cytogenetic marker for the leukemia cells of this patient.
Figure 6
Figure 6. Proposed Model for EZH2- controlled drug resistance in AML cells
In resistant cells EZH2 is phosphorylated at T487 by CDK1 which is stabilized by STIP1/HSP90 proteins. Phosphorylation of T487 leads to enhanced binding/activity of E3 ubiquitin-protein ligases such as TRIM21, ubiquitination of EZH2 and degradation by the proteasome. EZH2 does no longer introduce H3K27me3 at promoters of resistance genes such as HOXB7, HOXA9 or ABCC1 which become transcriptionally active. EZH2 degradation can be inhibited by proteasome inhibitors as well as HSP90 or CDK1 inhibitors which increase EZH2 protein levels, inactivate expression of resistance genes and restore drug sensitivity (P= phosphorylation, Ub= ubiquitination).

Similar articles

Cited by

References

    1. Roboz GJ. Novel approaches to the treatment of acute myeloid leukemia. Hematology Am Soc Hematol Educ Program. 2011;2011:43–50. - PubMed
    1. Schenk T, et al. Inhibition of the LSD1 (KDM1A) demethylase reactivates the all-trans-retinoic acid differentiation pathway in acute myeloid leukemia. Nat Med. 2012;18:605–611. - PMC - PubMed
    1. Krug U, Buchner T, Berdel WE, Muller-Tidow C. The treatment of elderly patients with acute myeloid leukemia. Dtsch Arztebl Int. 2011;108:863–870. - PMC - PubMed
    1. Knoechel B, et al. An epigenetic mechanism of resistance to targeted therapy in T cell acute lymphoblastic leukemia. Nat Genet. 2014;46:364–370. - PMC - PubMed
    1. Sharma SV, et al. A chromatin-mediated reversible drug-tolerant state in cancer cell subpopulations. Cell. 2010;141:69–80. - PMC - PubMed

MeSH terms