

Nuclear Factor Erythroid 2-related Factor 2 Deficiency Exacerbates Lupus Nephritis in B6/lpr mice by Regulating Th17 Cell Function
- PMID: 27941837
- PMCID: PMC5150244
- DOI: 10.1038/srep38619
Nuclear Factor Erythroid 2-related Factor 2 Deficiency Exacerbates Lupus Nephritis in B6/lpr mice by Regulating Th17 Cell Function
Abstract
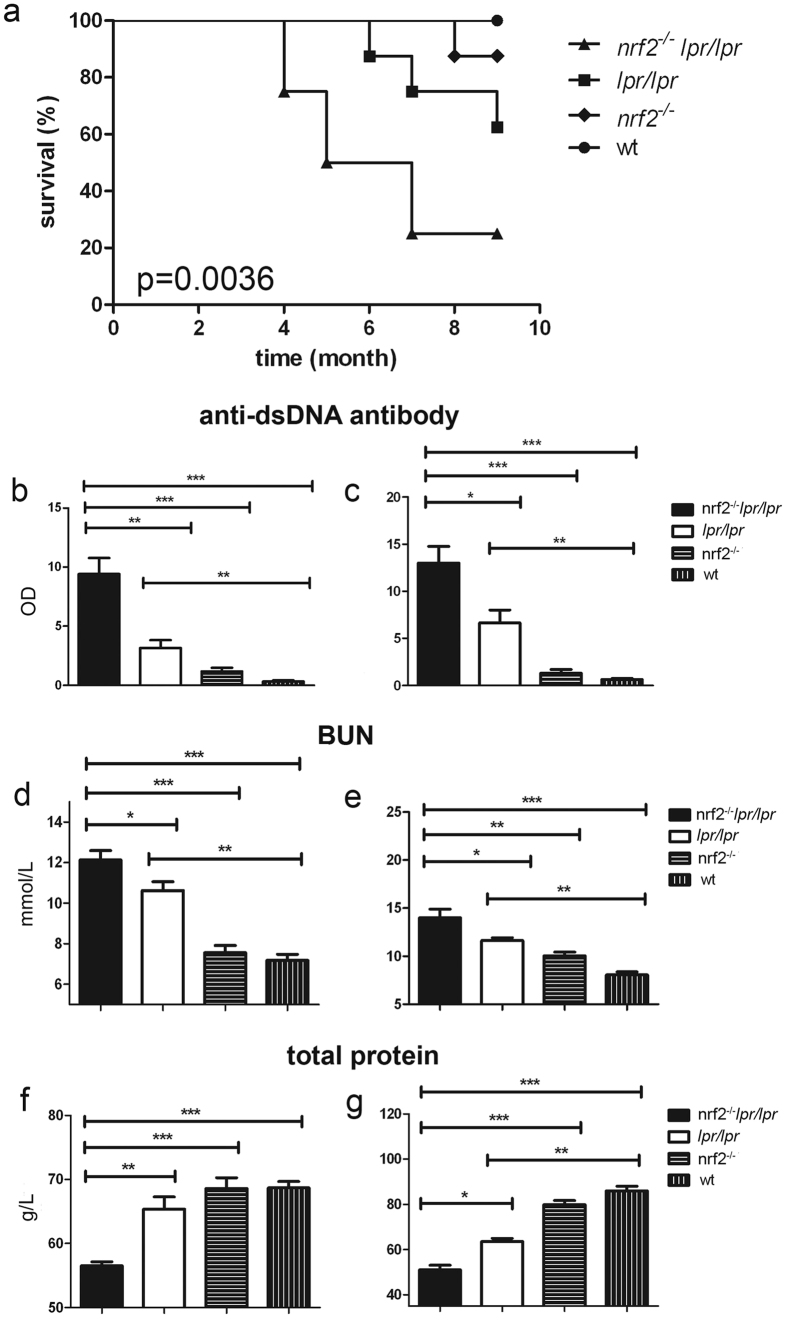
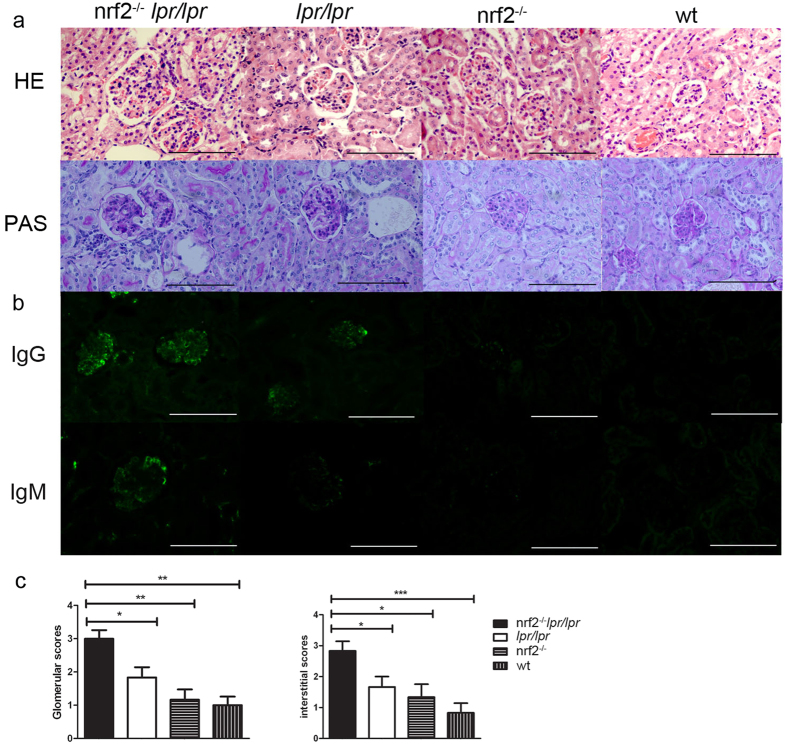
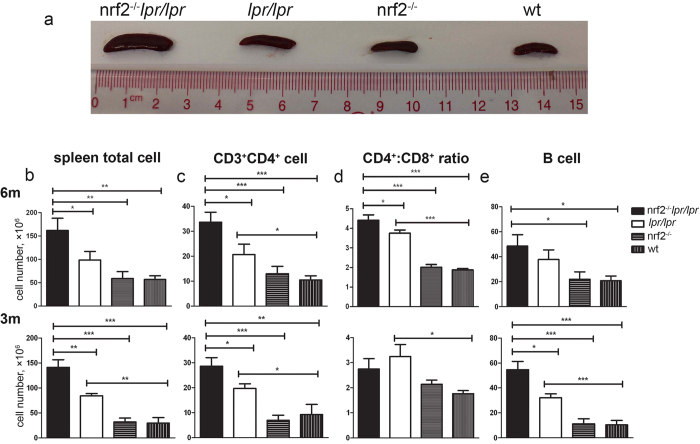
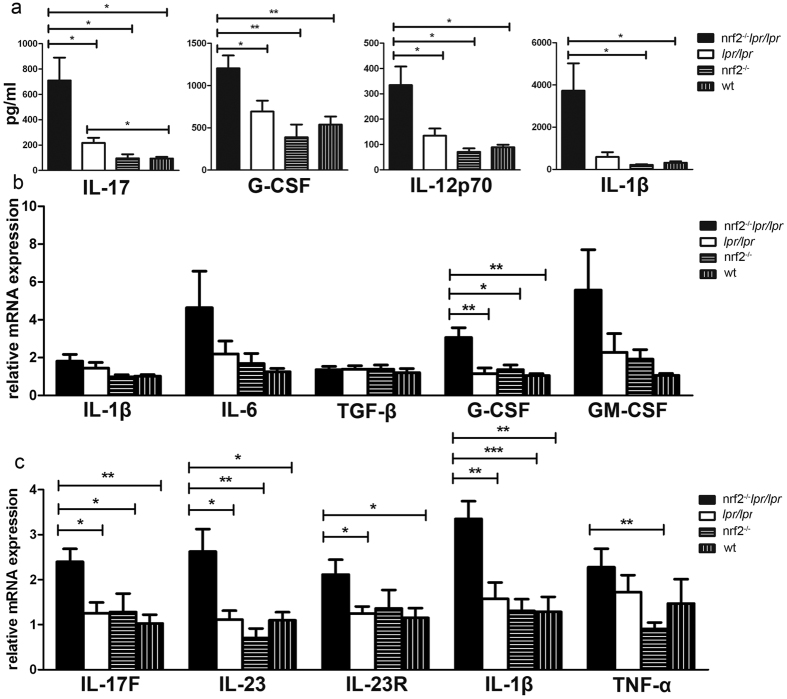
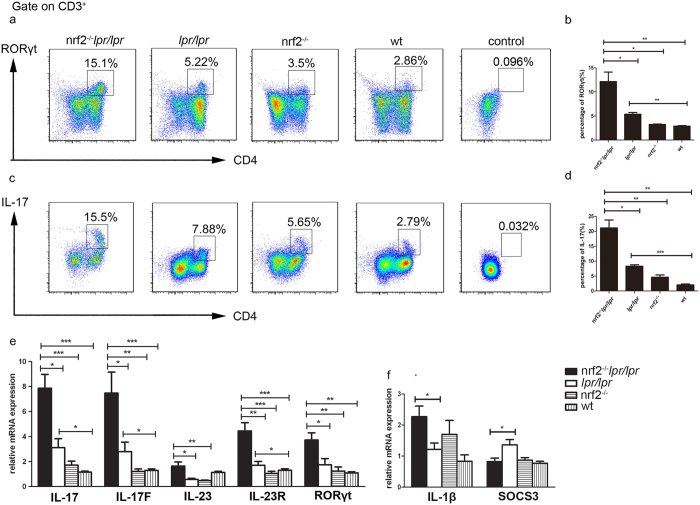
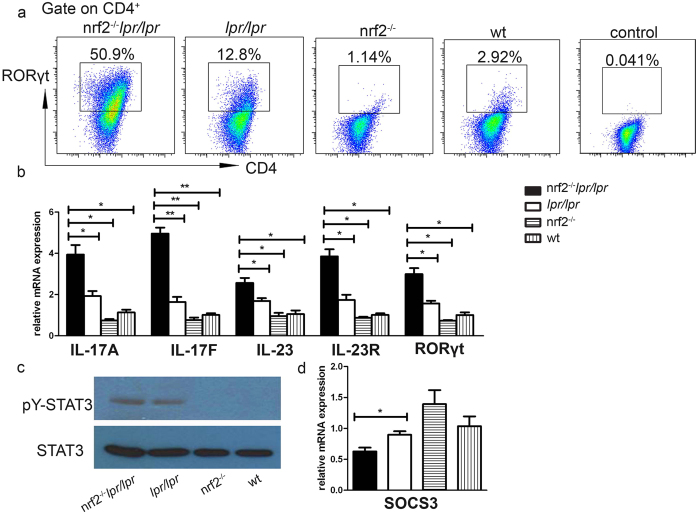
Lupus nephritis (LN) is the major clinical manifestation of systemic lupus erythematosus. LN is promoted by T helper 17 (Th17) cells, which are the major pro-inflammatory T cell subset contributing to autoimmunity regulation. Nuclear factor erythroid 2-related factor 2 (NRF2) is critical for suppressing reactive oxygen species (ROS) and relieving oxidant stress by regulating antioxidant gene expression. Previous studies have demonstrated that Nrf2 deficiency promotes drug-induced or spontaneous LN. However, whether NRF2 regulates Th17 function during LN development is still unclear. In this study, we introduced Nrf2 deficiency into a well-known LN model, the B6/lpr mouse strain, and found that it promoted early-stage LN with altered Th17 activation. Th17 cells and their relevant cytokines were dramatically increased in these double-mutant mice. We also demonstrated that naïve T cells from the double-mutant mice showed significantly increased differentiation into Th17 cells in vitro, with decreased expression of the Th17 differentiation suppressor Socs3 and increased phosphorylation of STAT3. Our results demonstrated that Nrf2 deficiency promoted Th17 differentiation and function during LN development. Moreover, our results suggested that the regulation of Th17 differentiation via NRF2 could be a therapeutic target for the treatment of subclinical LN patients.
Conflict of interest statement
The authors declare no competing financial interests.
Figures
Similar articles
-
Administration of activated lymphocyte-derived DNA accelerates and aggravates lupus nephritis in B6/lpr mice: a new approach to modify a lupus murine model.Clin Exp Immunol. 2018 Sep;193(3):302-312. doi: 10.1111/cei.13147. Epub 2018 Jul 23. Clin Exp Immunol. 2018. PMID: 29704464 Free PMC article.
-
Interleukin-22 From Type 3 Innate Lymphoid Cells Aggravates Lupus Nephritis by Promoting Macrophage Infiltration in Lupus-Prone Mice.Front Immunol. 2021 Feb 26;12:584414. doi: 10.3389/fimmu.2021.584414. eCollection 2021. Front Immunol. 2021. PMID: 33717066 Free PMC article.
-
Potential regulatory role of the Nrf2/HMGB1/TLR4/NF-κB signaling pathway in lupus nephritis.Pediatr Rheumatol Online J. 2023 Oct 23;21(1):130. doi: 10.1186/s12969-023-00909-5. Pediatr Rheumatol Online J. 2023. PMID: 37872565 Free PMC article.
-
Th subset balance in lupus nephritis.J Biomed Biotechnol. 2011;2011:980286. doi: 10.1155/2011/980286. Epub 2011 Aug 28. J Biomed Biotechnol. 2011. PMID: 21904445 Free PMC article. Review.
-
The role of cytokine in the lupus nephritis.J Biomed Biotechnol. 2011;2011:594809. doi: 10.1155/2011/594809. Epub 2011 Oct 18. J Biomed Biotechnol. 2011. PMID: 22028590 Free PMC article. Review.
Cited by
-
Nrf2 Lowers the Risk of Lung Injury via Modulating the Airway Innate Immune Response Induced by Diesel Exhaust in Mice.Biomedicines. 2020 Oct 21;8(10):443. doi: 10.3390/biomedicines8100443. Biomedicines. 2020. PMID: 33096811 Free PMC article.
-
The Potential of Nrf2 Activation as a Therapeutic Target in Systemic Lupus Erythematosus.Metabolites. 2022 Feb 6;12(2):151. doi: 10.3390/metabo12020151. Metabolites. 2022. PMID: 35208225 Free PMC article. Review.
-
Exercise Cuts Both Ways with ROS in Remodifying Innate and Adaptive Responses: Rewiring the Redox Mechanism of the Immune System during Exercise.Antioxidants (Basel). 2021 Nov 21;10(11):1846. doi: 10.3390/antiox10111846. Antioxidants (Basel). 2021. PMID: 34829717 Free PMC article. Review.
-
The Role of Reactive Oxygen Species in Regulating T Cell-mediated Immunity and Disease.Immune Netw. 2018 Feb 22;18(1):e14. doi: 10.4110/in.2018.18.e14. eCollection 2018 Feb. Immune Netw. 2018. PMID: 29503744 Free PMC article. Review.
-
Immune imbalance in Lupus Nephritis: The intersection of T-Cell and ferroptosis.Front Immunol. 2024 Dec 12;15:1520570. doi: 10.3389/fimmu.2024.1520570. eCollection 2024. Front Immunol. 2024. PMID: 39726588 Free PMC article. Review.
References
-
- Munoz L. E. et al.. SLE–a disease of clearance deficiency? Rheumatology (Oxford) 44, 1101–1107 (2005). - PubMed
Publication types
MeSH terms
Substances
LinkOut - more resources
Full Text Sources
Other Literature Sources
Miscellaneous
