. 2016 Dec 12:2:16238.
doi: 10.1038/nmicrobiol.2016.238.

Lactate signalling regulates fungal β-glucan masking and immune evasion

Affiliations

Lactate signalling regulates fungal β-glucan masking and immune evasion

Elizabeth R Ballou et al. Nat Microbiol. .

Abstract

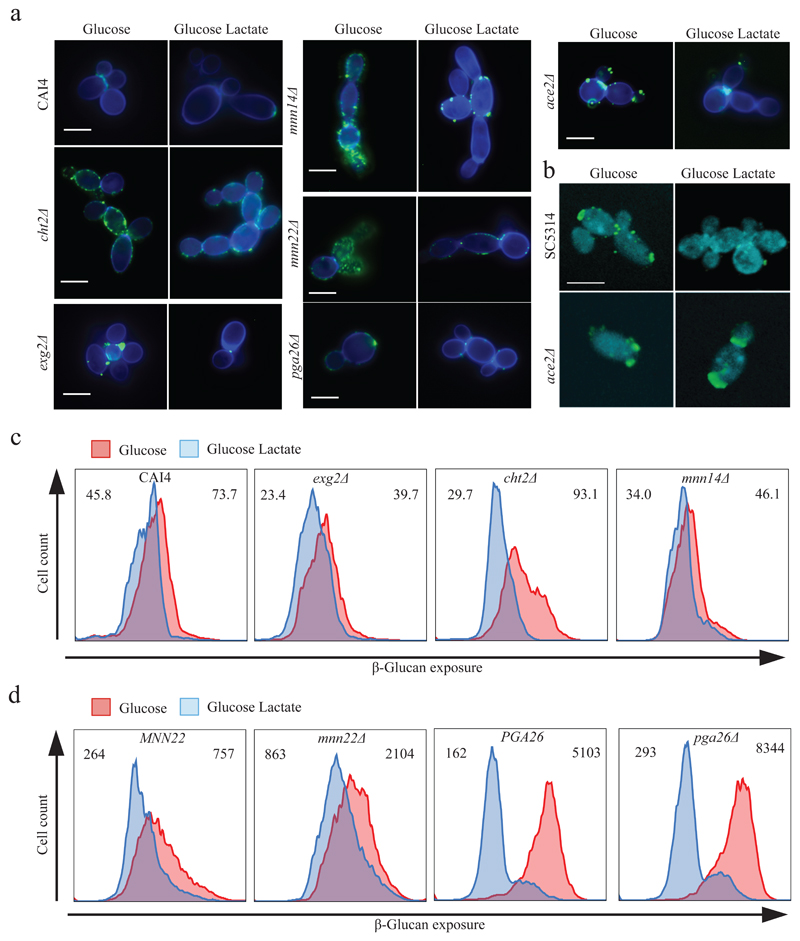
As they proliferate, fungi expose antigens at their cell surface that are potent stimulators of the innate immune response, and yet the commensal fungus Candida albicans is able to colonize immuno competent individuals. We show that C. albicans may evade immune detection by presenting a moving immunological target. We report that the exposure of β-glucan, a key pathogen-associated molecular pattern (PAMP) located at the cell surface of C. albicans and other pathogenic Candida species, is modulated in response to changes in the carbon source. Exposure to lactate induces β-glucan masking in C. albicans via a signalling pathway that has recruited an evolutionarily conserved receptor (Gpr1) and transcriptional factor (Crz1) from other well-characterized pathways. In response to lactate, these regulators control the expression of cell-wall-related genes that contribute to β-glucan masking. This represents the first description of active PAMP masking by a Candida species, a process that reduces the visibility of the fungus to the immune system.


Figures

Figure 1
Figure 1. Lactate activates β-glucan masking in Candida an attenuates phagocytic response.
(a) Flow cytometry analysis of β-glucan exposure. Wild-type Candida albicans, C. dubliniensis, C. lusitaniae, C. parapsilosis, C. glabrata, and Saccharomyces cerevisiae were grown in glucose or lactate and examined for β-glucan masking. The plots and Median Fluorescence Intensities (MFI) are shown for glucose-grown cells (red; MFI value in top right of each panel) and lactate-grown cells (blue; MFI value, top left). β-glucan masking was defined as a >50% decrease in MFI. Plots are representative of data collected in two independent replicate experiments. (b) β-glucan exposure for C. albicans cells grown in glucose (red) or glucose + lactate (purple). (c) Percentage of glucose- or lactate-grown C. albicans cells phagocytosed by murine BMD-macrophages; n=4 donor mice; measurements were performed in triplicate per mouse per condition and analysed using the Mann-Whitney U test; errors bars = 95%CI. (d) Percentage of neutrophils recruited to the site of injection in BALB/c mice intraperitoneally infected with wild-type C. albicans pre-grown on glucose or lactate. For each group, n=6 mice; data were analysed using the Mann-Whitney U test; error bars = 95%CI. (e) TNF-α and (f) MIP1α responses from human M1-activated monocyte-derived macrophages to glucose- and lactate-grown cells; n=4 donors were exposed to triplicate independent samples of Candida cells for each condition; the data were analyzed using Friedman test for matched non-parametric data; error bars = 95%CI.
Figure 2
Figure 2. Lactate-induced β-glucan masking is specific, physiologically relevant, and mediated by Gpr1.
(a) β-glucan exposure for wild-type C. albicans cells grown in glucose (red), and glucose plus 2% D-lactate (blue, top panel) or glucose plus 2% L-lactate (blue, bottom panel). Median Fluorescence Intensities (MFI) are indicated at the top of each panel, the value for glucose on the right, and for lactate on the left. Plots are representative of three independent replicate experiments. (b) β-glucan exposure for C. albicans cells incubated for 6 h in fresh (red; MFI right) or spent (blue; MFI left) culture medium from J774.1 macrophages (36 h, top panel) or Lactobacillus reuteri (overnight culture, bottom panel). Plots are representative of two independent replicate experiments. (c) β-glucan exposure in C. albicans cells grown on glucose (red; MFI, top right) or lactate (blue; MFI, top left) for gpr1Δ gpa2Δ cells (top); GPR1 GPA2 wild-type cells (bottom); gpr1Δ cells (top); GPR1 wild-type cells (bottom); clinical isolate S20175.016 containing pACT1-GPR1-GFP (top); S20175.016 containing the control pACT1-GFP vector (bottom). Plots are representative of data collected in three independent replicate experiments. (d) Micrographs showing Gpr1-GFP internalization in C. albicans wild-type cells (SC5314) expressing Gpr1-GFP following 1 hr exposure to glucose, lactate, or methionine at the indicated concentration Micrographs are representative of three replicate experiments: scale bar = 10 μm. (e) Gpr1-GFP localization after 1 hr of exposure to 100 mM of the indicated ligand. Micrographs are representative of three replicate experiments: scale bar = 10 μm. (f) Dose response curves showing β-glucan exposure for C. albicans cells grown for 4 hours in buffered YNB plus the indicated ligand at 2 mM (lactate only), 10 mM, 100 mM, or 150 mM. Values were normalized against 0 mM for each condition: n=3; error bars = 95%CI. (g,h) Mannan (ConA, red) and β-glucan (Fc-Dectin1, green) exposure for (g) wild-type and (h) gpr1Δ gpa2Δ cells. Micrographs are representative of two replicate experiments: scale bar = 5 μm.
Figure 3
Figure 3. Lactate-induced β-glucan masking is dependent on Crz1, but not calcineurin.
(a) Cytometric analysis of β-glucan exposure in C. albicans cells grown on glucose (red) or glucose plus lactate (blue): CRZ1 wild-type; crz1Δ mutant; crz1Δ + CRZ1 reconstituted strain; cna1Δ; cnb1Δ; wild-type cells exposed to 3.12 μg/ml FK506. Median Fluorescence Intensities (MFI) are indicated at the top of each panel, the value for glucose on the right, and for lactate or FK506 on the left. Plots are representative of data collected in three independent replicate experiments. (b) Micrographs showing the localization of GFP-Crz1 in wild-type (CAI4+CIp10), cnb1Δ, and gpr1Δ gpa2Δ cells grown in or glucose alone (control), glucose and exposed to 100 μM CaCl2 (1 h), or glucose plus 2% lactate (4 h). Micrographs are representative of three replicate experiments: scale bar = 5 μm. (c) Micrographs showing mannan (ConA, red) and β-glucan (Fc-Dectin1, green) exposure in wild-type and crz1Δ cells following growth in glucose or glucose plus lactate. Micrographs are representative of two replicate experiments: scale bar = 5 μm.
Figure 4
Figure 4. Role of lactate-regulated genes in lactate-dependent β-glucan masking.
(a) Fluorescent micrographs for wild-type (CAI4), mnn14Δ, mnn22Δ, exg2Δ, cht2Δ, pga26Δ, and aceΔ cells stained for chitin (Calcofluor White, blue) and β-glucan (Fc-Dectin1, green). Micrographs are representative of two replicate experiments: scale bar = 5 μm. (b) Confocal 3D rendered micrographs showing mannan (ConA, blue) and β-glucan (Fc-Dectin1, green) exposure in wild-type (SC5314) and ace2Δ cells. Micrographs are representative of two replicate experiments: scale bar = 5 μm. (c) β-glucan exposure for C. albicans wild-type parent (CAI4), exg2Δ, cht2Δ, mnn14Δ cells grown on glucose (red) or glucose plus lactate (blue). Median Fluorescence Intensities (MFI) are indicated at the top of each panel, the value for glucose on the right, and for lactate on the left. Data were acquired using a FACSCalibur flow cytometer. Plots are representative of data collected in two independent replicate experiments. (d) β-glucan exposure for MNN22 parent, mnn22Δ, PGA26 parent and pga26Δ cells grown on glucose (red) or glucose plus lactate (blue). Median Fluorescence Intensities (MFI) are indicated at the top of each panel, the value for glucose on the right, and for lactate on the left. Data were acquired using a BD Fortessa flow cytometer. Plots are representative of data collected in two independent replicate experiments.
Figure 5
Figure 5. Regulation of β-glucan masking in C. albicans.
(a) A Crz1 network contributes to lactate-induced gene regulation. Differentially regulated genes are displayed as nodes and classified as either cell wall related (blue) or other (grey), based on their GO annotation. Lactate- and Crz1-regulated clusters are based on the RNA sequencing dataset, and the Ace2 cluster represents genes bound at their promoters by Ace2. The data used to generate this network in Cytoscape 3.2.1 are presented in Supplementary Table S3. A core set of six genes are regulated by lactate, Crz1 and Ace2, and three of these execute cell wall or cell surface-related functions (MNN22, FET3, HGT10). (b) Model of β-glucan masking in C. albicans. L-lactate is detected by Gpr1, which in turn signals to Crz1 in a calcineurin independent manner. With the help of Ace2, Crz1 regulates a polygenic response resulting in masking of β-glucan on the C. albicans cell surface.

Comment in

References

    1. Brown GD, Gordon S. Immune recognition. A new receptor for beta-glucans. Nature. 2001;413:36–37. doi: 10.1038/35092620. - DOI - PubMed
    1. Hardison SE, Brown GD. C-type lectin receptors orchestrate antifungal immunity. Nature immunology. 2012;13:817–822. doi: 10.1038/ni.2369. - DOI - PMC - PubMed
    1. O'Meara TR, Alspaugh JA. The Cryptococcus neoformans capsule: a sword and a shield. Clin Microbiol Rev. 2012;25:387–408. doi: 10.1128/CMR.00001-12. - DOI - PMC - PubMed
    1. Carrion SdJ, et al. The RodA hydrophobin on Aspergillus fumigatus spores masks dectin-1- and dectin-2-dependent responses and enhances fungal survival in vivo. Journal of Immunology (Baltimore, Md : 1950) 2013;191:2581–2588. doi: 10.4049/jimmunol.1300748. - DOI - PMC - PubMed
    1. Gow NAR, Hube B. Importance of the Candida albicans cell wall during commensalism and infection. Current Opinion in Microbiology. 2012;15:1–7. doi: 10.1016/j.mib.2012.04.005. - DOI - PubMed

LinkOut - more resources