. 2016 Dec 12:6:38845.
doi: 10.1038/srep38845.

Adaptive use of interaction torque during arm reaching movement from the optimal control viewpoint

Affiliations

Adaptive use of interaction torque during arm reaching movement from the optimal control viewpoint

Van Hoan Vu et al. Sci Rep. .

Abstract

The study aimed at investigating the extent to which the brain adaptively exploits or compensates interaction torque (IT) during movement control in various velocity and load conditions. Participants performed arm pointing movements toward a horizontal plane without a prescribed reach endpoint at slow, neutral and rapid speeds and with/without load attached to the forearm. Experimental results indicated that IT overall contributed to net torque (NT) to assist the movement, and that such contribution increased with limb inertia and instructed speed and led to hand trajectory variations. We interpreted these results within the (inverse) optimal control framework, assuming that the empirical arm trajectories derive from the minimization of a certain, possibly composite, cost function. Results indicated that mixing kinematic, energetic and dynamic costs was necessary to replicate the participants' adaptive behavior at both kinematic and dynamic levels. Furthermore, the larger contribution of IT to NT was associated with an overall decrease of the kinematic cost contribution and an increase of its dynamic/energetic counterparts. Altogether, these results suggest that the adaptive use of IT might be tightly linked to the optimization of a composite cost which implicitly favors more the kinematic or kinetic aspects of movement depending on load and speed.


Figures

Figure 1
Figure 1. Illustration of the experimental paradigm.
Fixed initial arm position and horizontal target plane were tested, therefore defining a free reach-endpoint motor task. A 4-DoF model of arm was examined (3 DoFs at the shoulder and 1 DoF at the elbow). Three speed and two load conditions were tested. At the two bottom panels displayed the arm posture at the initial time with no load (left) and with a load (right) approximately attached to the center of mass of the forearm. The average fingertip trajectories of a representative subject were drawn in thick, thin and dotted lines for the three speeds (slow, natural, fast, denoted by S, N, F) respectively. The two top panels display the reach endpoint positions across trials for this subject for the three speed condition, and no-load (left) and load (right) conditions. The 95% confidence ellipses of the reach endpoints are drawn. Note that along the antero-posterior (AP axis), the position of reach endpoint positions tended to get closer to the shoulder position when movement speed increased or when the load was attached to the forearm.
Figure 2
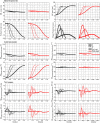
Figure 2. Hand, joint and torque profiles for the representative subject of Fig. 1.
For the hand kinematics, displacements along the AP, ML and vertical axes are depicted as well as the Cartesian hand velocity (average and standard deviation shown as a shaded area) for the 3 speeds and two load conditions (black is for no-load and red for with-load). For the joint kinematics, the angular displacements for the 4 degrees of freedom are depicted. For the joint torques, we depicted the net torque acting at each degree of freedom.
Figure 3
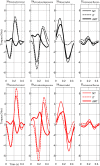
Figure 3. Torque profiles (averaged across trials) of the representative subject at N speed for the no-load (top panel) and load (bottom panel) conditions.
From left to right, the four torque profiles are for the shoulder internal/external, elevation/depression, ulnar/radial and elbow extension/flexion DoFs, respectively. The dynamic muscle torque (defined as muscle torque deprived of gravity torque, denoted by dMT), interaction torque (denoted by IT) and net torque (denoted by NT) are plotted.
Figure 4
Figure 4. Global interaction torque indexes (ITg), averaged across all subjects, and displayed for the three speed and two load conditions (with standard errors indicated by error bars).
It is visible that the ITg index increased whenever movements sped up or a load was attached to the arm. In addition, its values were always positive, thus indicating that the IT positively contributed to the NT to some extent. Note that horizontal bars with stars indicate the results of post-hoc analysis for the speed condition. One, two, three stars stand for p < 0.05, p < 0.01 and p < 0.001 respectively.
Figure 5
Figure 5. Local interaction torque indexes (ITl), averaged across all the subjects, displayed for the three speed and two load conditions.
From left to right: ITl of elbow extension/flexion, shoulder ulnar/radial, elevation/depression, internal/external, respectively. Noticeably, compared with shoulder-related DoFs, the ITl indexes at the elbow extension/flexion were considerably smaller. Between the three DoFs at the shoulder, the ITl indexes of shoulder ulnar/radial were smaller than the others. Statistical analyses showed significant effects of speed/load on the ITl index for these three DoFs, as indicated by horizontal bars
Figure 6
Figure 6. Bin analysis of interaction torque exploitation.
From left to right: average interaction torque indexes (across subjects) for bin 1, bin 2, bin 3 and bin4 respectively. Note that these four bins were defined by dividing movement duration into a series of 4 intervals based on the acceleration profile (see Methods). Note that IT index values were smaller for bins 1 and 4, while it was larger for middle bins (2 and 3). For each bin, statistical significance of post-hoc tests is reported.
Figure 7
Figure 7. Component analysis of interaction torque exploitation.
The IT indexes, averaged across subjects, are displayed for the three speed and two load conditions for the two components of IT. Left: velocity-related component (ITvel); Right: acceleration-related component (ITacc). It is visible that ITacc was always greater than ITvel. Statistical analyses showed significant effects of speed and load on the IT index for both IT components.
Figure 8
Figure 8. Reconstruction errors in joint space (EJoint, left panel) and Cartesian space (ECart, right panel) for the best-fitting composite cost and each of the three cost elements taken separately.
Error values were averaged across speeds, loads and then across subjects (with standard errors indicated by error bars). Noticeably, in terms of both joint and Cartesian errors, the composite (Comp) and kinematic (Kine) costs performed better than the dynamic (Dyna) and energetic (Ener) costs.
Figure 9
Figure 9. Torque profiles predicted by the identified composite cost (top panels) and the kinematic cost (bottom panels) for the representative subject at N speed and in no load condition.
It is visible that the composite cost tends to let ITs contribute to NTs in order to get smaller dMTs while it is the opposite for the kinematic cost.
Figure 10
Figure 10. Reconstruction errors for some relevant parameters (EIT, EKspeed, EKmass) for the composite and kinematic costs.
Error values were averaged across speeds, loads and then across subjects for EIT while averaged only across subjects for EKspeed/EKmass. Noticeably, in terms of EIT and EKspeed/EKmass errors, the composite cost performed much better than the kinematic cost, yielding to a conclusion that only composite cost could predict relatively well the IT index and its speed/mass dependencies as observed in the experimental movement.
Figure 11
Figure 11. Cost contribution analyses.
The contribution of elementary cost to the composite cost, averaged across all the subjects, is reported for the three speed and two load conditions. Left: cost contribution of kinematic cost; Right: cost contribution of dynamic cost. It is visible that the contribution of kinematic cost tended to decreased while those of dynamic cost increased with respect to the increase of movement speed and load.

Similar articles

Cited by

References

    1. Ghez C. & Sainburg R. Proprioceptive control of interjoint coordination. Can J Physiol Pharmacol 73(2), 273–284, Feb (1995). - PMC - PubMed
    1. Buhrmann T. & Di Paolo E. A. Spinal circuits can accommodate interaction torques during multijoint limb movements. Front Comput Neurosci 8, 144 (2014). - PMC - PubMed
    1. Hollerbach M. J. & Flash T. Dynamic interactions between limb segments during planar arm movement. Biol Cybern 44(1), 67–77 (1982). - PubMed
    1. Sainburg R. L., Ghilardi M. F., Poizner H. & Ghez C. Control of limb dynamics in normal subjects and patients without proprioception. J Neurophysiol 73(2), 820–835, Feb (1995). - PMC - PubMed
    1. Sainburg R. L., Ghez C. & Kalakanis D. Intersegmental dynamics are controlled by sequential anticipatory, error correction, and postural mechanisms. J Neurophysiol 81(3), 1045–1056, Mar (1999). - PMC - PubMed

Publication types