. 2016 Dec 12;11(12):e0167755.
doi: 10.1371/journal.pone.0167755. eCollection 2016.

Biophysical Studies of the Induced Dimerization of Human VEGF Receptor 1 Binding Domain by Divalent Metals Competing with VEGF-A

Affiliations

Biophysical Studies of the Induced Dimerization of Human VEGF Receptor 1 Binding Domain by Divalent Metals Competing with VEGF-A

Jean-François Gaucher et al. PLoS One. .

Abstract

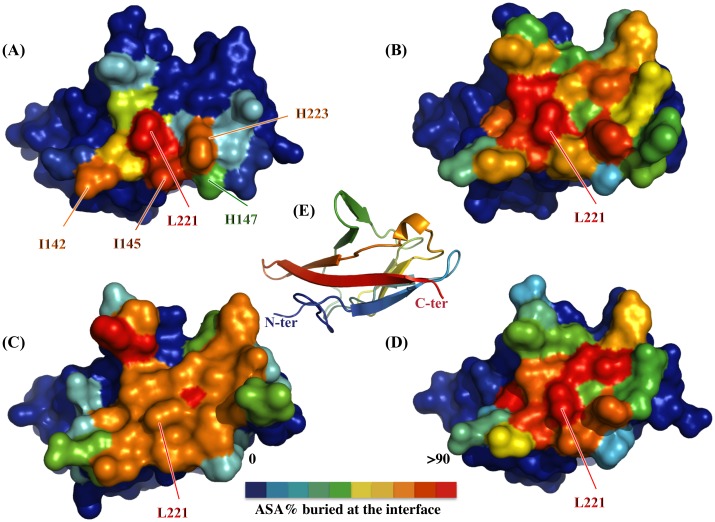
Angiogenesis is tightly regulated through the binding of vascular endothelial growth factors (VEGFs) to their receptors (VEGFRs). In this context, we showed that human VEGFR1 domain 2 crystallizes in the presence of Zn2+, Co2+ or Cu2+ as a dimer that forms via metal-ion interactions and interlocked hydrophobic surfaces. SAXS, NMR and size exclusion chromatography analyses confirm the formation of this dimer in solution in the presence of Co2+, Cd2+ or Cu2+. Since the metal-induced dimerization masks the VEGFs binding surface, we investigated the ability of metal ions to displace the VEGF-A binding to hVEGFR1: using a competition assay, we evidenced that the metals displaced the VEGF-A binding to hVEGFR1 extracellular domain binding at micromolar level.


Conflict of interest statement

The authors have declared that no competing interests exist.

Figures

Fig 1
Fig 1. Crystal structure of hVEGFR1d2 homodimers.
Zn2+-dimer (light blue and green) (4CKV), the Co2+-dimer (salmon and magenta) (4CL7) and the Cu2+-dimer (orange and purp(A) Interface of the Zn2+-induced dimer. The hVEGFR1d2 buried side chains from one monomer are represented as stick surrounded by a dot surface. The second monomer is represented by its surface conventionally colored according to the electrostatic potential. (B) The crystal le) (5ABD) were superimposed on one of the two molecules (domain2). The second molecule of the three dimers are represented on the right side: Zn2+-domain2-sym is rotated by 7° and translated by 1.1 Å in regard to Co2+-domain2-sym. The Zn2+-domain2-sym is rotated by 12° and translated by 2.4 Å in regard to Cu2+-domain2-sym. However, the residues in contact at the interface remain unchanged and their side chains are shown as sticks. (C) Metal coordination for Zn2+, Co2+ and Cu2+.
Fig 2
Fig 2. The hVEGFR1d2 dimerization interface overlapped the VEGF binding site.
hVEGFR1d2 surface colored as a function of the buried surface area calculated by the program PISA, within several complexes: (A) homodimer hVEGFR1d2/hVEGFR1d2 (4CKV), (B) hVEGFR1d2/tVEGF-A (1FLT), (C) hVEGFR1d2/VEGF-B (2XAC), (D) hVEGFR1d2/PlGF (1RV6); (E) ribbon representation of the hVEGFR1d2 in the identical orientation. The homodimer interaction surface (A) mimics an important part of the hVEGFR1-ligand interaction surface (B, C, D), with a major contribution of Leu221.
Fig 3
Fig 3. SAXS analysis of hVEGFR1d2 in the absence (A, B) and presence (C, D) of CoCl2.
(A) and (C): scattering intensities with the CRYSOL and DAMMIF fit, and pair-distribution function (P(r)); (B) and (D): corresponding SAXS ab initio DAMMIF shapes. The cobalt ion is shown as a black sphere on (D).
Fig 4
Fig 4. 1H-15N-TROSY NMR spectra of the hVEGFR1d2 domain.
(A) Overlay of the TROSY spectra of the hVEGFR1d2 at the concentration of 150 μM in the absence (red) and presence (black) of cadmium (1.8 eq). The full spectra are shown except for residues Phe135 and Trp186, with resonances at 5.6 ppm and 10.5 ppm, respectively. A general line broadening effect is observed following the addition of the divalent cation due to the dimerization of the hVEGFR1d2 and peaks of residues at the interface completely disappear due to the conformational exchange on an intermediate NMR timescale. (B) EDTA has been added (1.8 eq, 270 μM) to the precedent mixture. EDTA chelates cadmium ions, leading to the disruption of the dimer and the reemergence of the previously missing resonances characterizing the interface.
Fig 5
Fig 5. Peak volume evolution of the 1H-15N TROSY with increasing concentrations of CdCl2.
The cadmium concentration was increased from 0 to 1.8 equivalents. The peak volumes are normalized against the highest peak volume in the TROSY experiment without cadmium. No bar indicates either the presence of proline or a residue (Asn212) that could not be unambiguously identified on the spectrum. Extremely perturbed peaks following cadmium addition identify three principal regions potentially involved in dimerization: Tyr139-Gly151, Ala197-Leu204 and Leu221-Thr226.
Fig 6
Fig 6. hVEGFR1-d2d3 structural modeling.
(A) hVEGFR1d2d3 model after MD simulation: two extreme conformers observed during the MD simulation are superimposed on domain 2 to illustrate the 40° hinge motion. (B) Top: crystal structure of the VEGFR2-d2d3/VEGF-E complex (3V6B). Bottom: Zn2+-dimerized hVEGFR1d2d3 model after MD simulation. The Zn2+ ion is shown as an orange sphere. Equivalent orientations of domain 3 are shown in identical colors (red or green).
Fig 7
Fig 7. Size-exclusion chromatography reveals the Cu2+ induced hVEGFR1d2 dimerization.
(A) hVEGFR1d2 eluted either in the presence of either 1 mM EDTA (Purple curve) or 1 mM CuSO4 (Green curve). The chromatogram revealed a single peak in the presence of 1 mM EDTA (d), and two major peaks corresponding to the monomer (b) and the dimer (a) in the presence of Cu2+. A third peak (c) consisting in Cu2+ ions eluted near the total volume. (B) SDS page of loaded samples and eluted peaks. hVEGFR1-d2 + CuCl2 (Green): Loaded sample (ls), Ve = 11.3 ml (a), Ve = 14.1 ml (b); hVEGFR1-d2 + EDTA (Purple): Loaded sample (ls), Ve = 17.3 ml (c), Ve = 14.0 ml (d).

Similar articles

Cited by

References

    1. Hanahan D, Weinberg RA. Hallmarks of cancer: the next generation. Cell. 2011;144(5):646–74. 10.1016/j.cell.2011.02.013 - DOI - PubMed
    1. DiSalvo J, Bayne ML, Conn G, Kwok PW, Trivedi PG, Soderman DD, et al. Purification and characterization of a naturally occurring vascular endothelial growth factor.placenta growth factor heterodimer. J Biol Chem. 1995;270(13):7717–23. Epub 1995/03/31. - PubMed
    1. Koch S, Claesson-Welsh L. Signal transduction by vascular endothelial growth factor receptors. Cold Spring Harb Perspect Med. 2012;2(7):a006502 Epub 2012/07/05. 10.1101/cshperspect.a006502 - DOI - PMC - PubMed
    1. Kendall RL, Thomas KA. Inhibition of vascular endothelial cell growth factor activity by an endogenously encoded soluble receptor. Proc Natl Acad Sci U S A. 1993;90(22):10705–9. Epub 1993/11/15. - PMC - PubMed
    1. Saghiri MA, Asatourian A, Orangi J, Sorenson CM, Sheibani N. Functional role of inorganic trace elements in angiogenesis-Part II: Cr, Si, Zn, Cu, and S. Crit Rev Oncol Hematol. 2015;96(1):143–55. 10.1016/j.critrevonc.2015.05.011 - DOI - PubMed

MeSH terms

Substances

LinkOut - more resources