. 2016 Dec 12;12(12):e1006088.
doi: 10.1371/journal.ppat.1006088. eCollection 2016 Dec.

MTOR-Driven Metabolic Reprogramming Regulates Legionella pneumophila Intracellular Niche Homeostasis

Affiliations

MTOR-Driven Metabolic Reprogramming Regulates Legionella pneumophila Intracellular Niche Homeostasis

Camille F Abshire et al. PLoS Pathog. .

Abstract

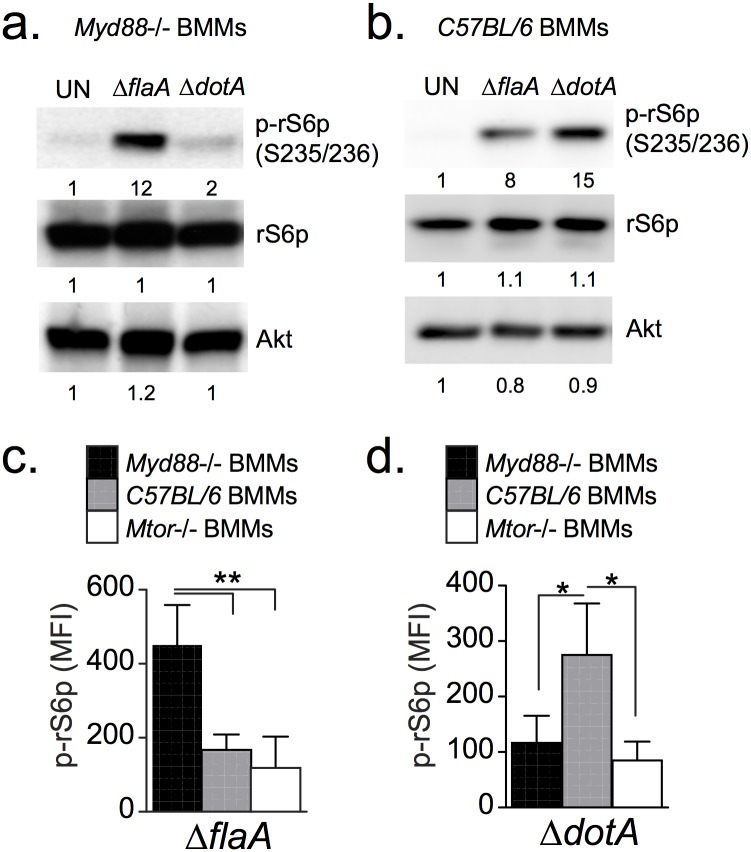
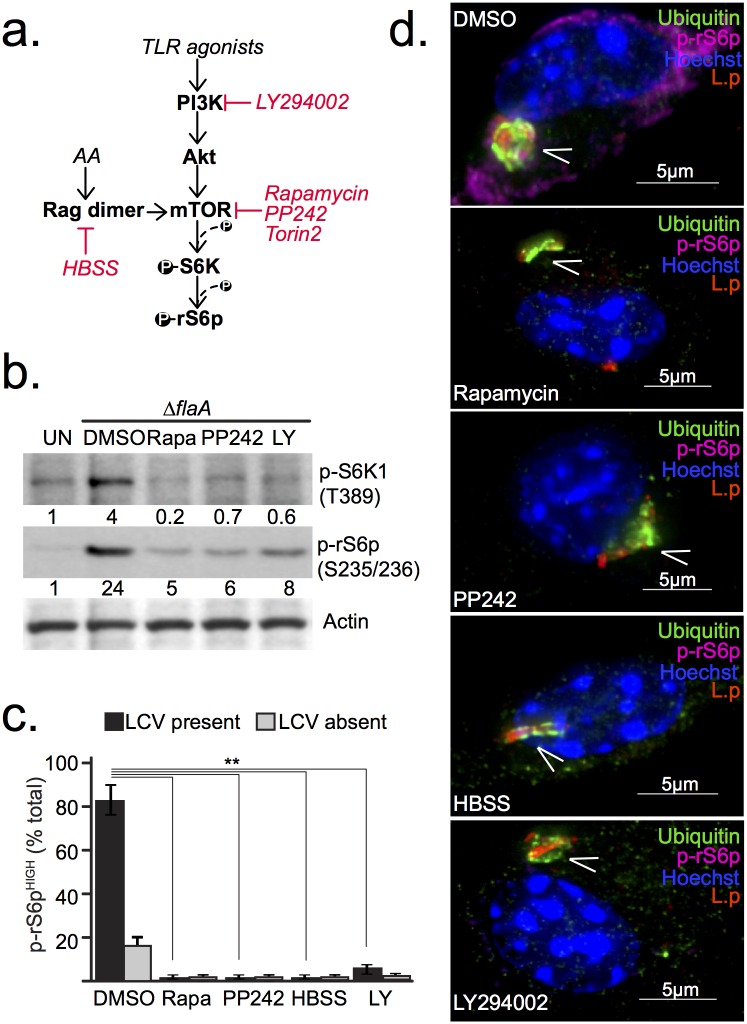
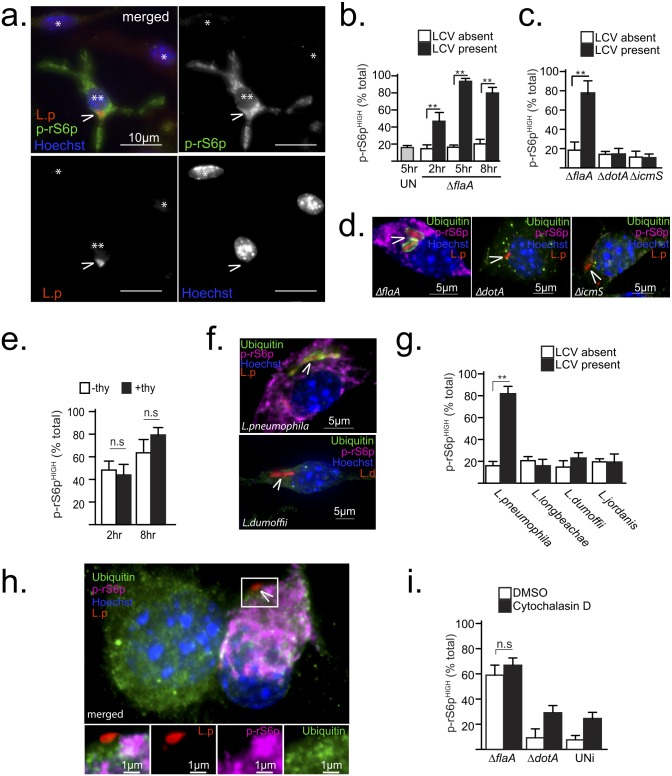
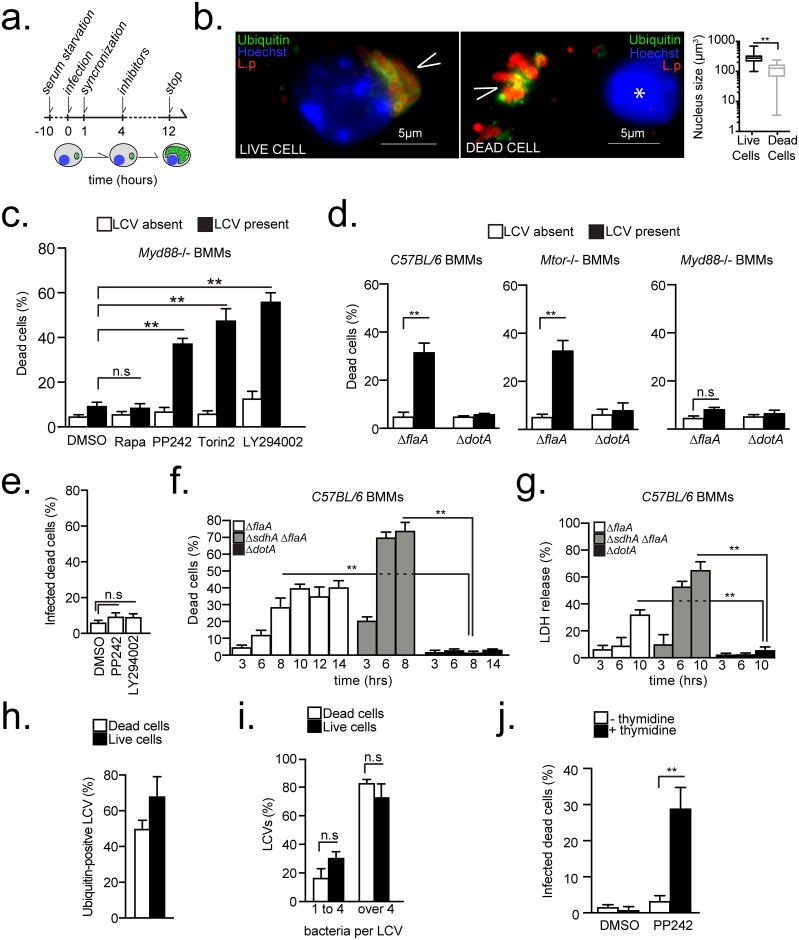
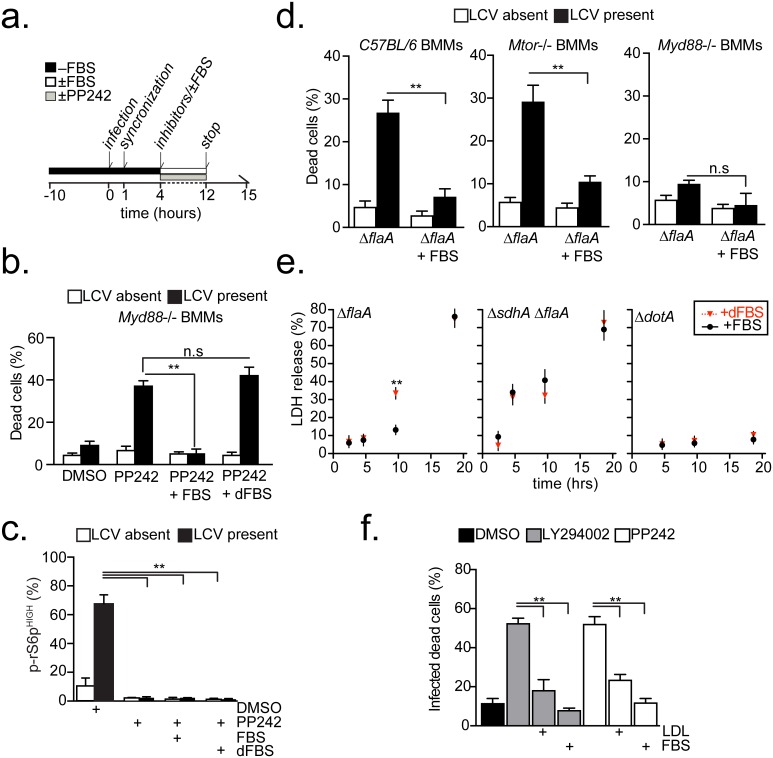
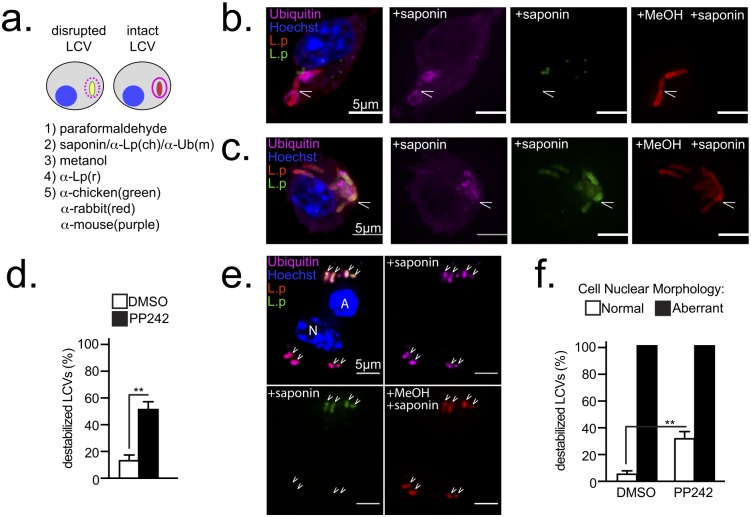
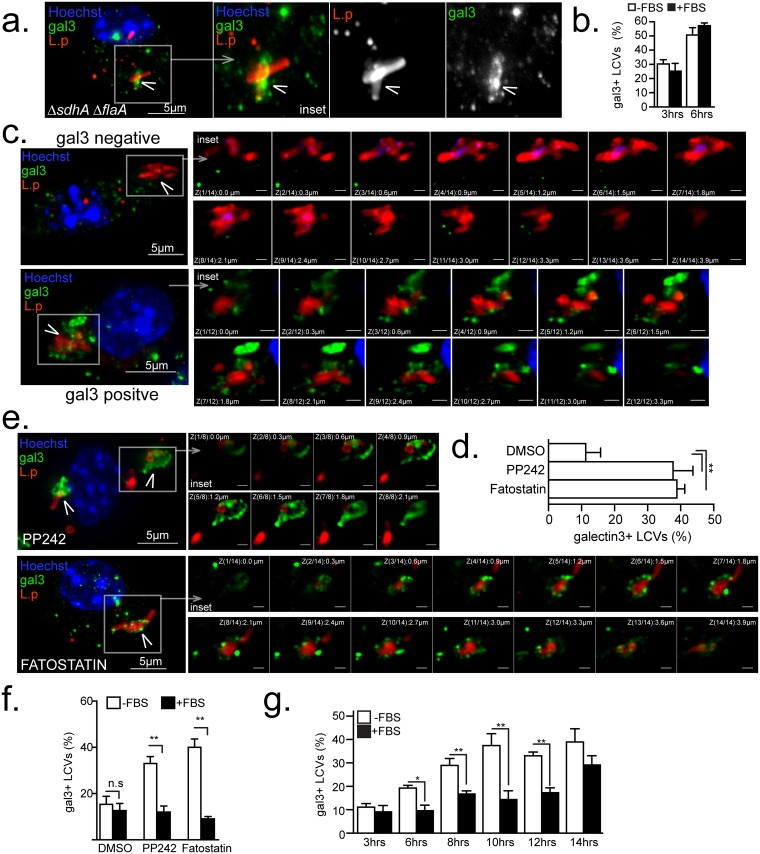
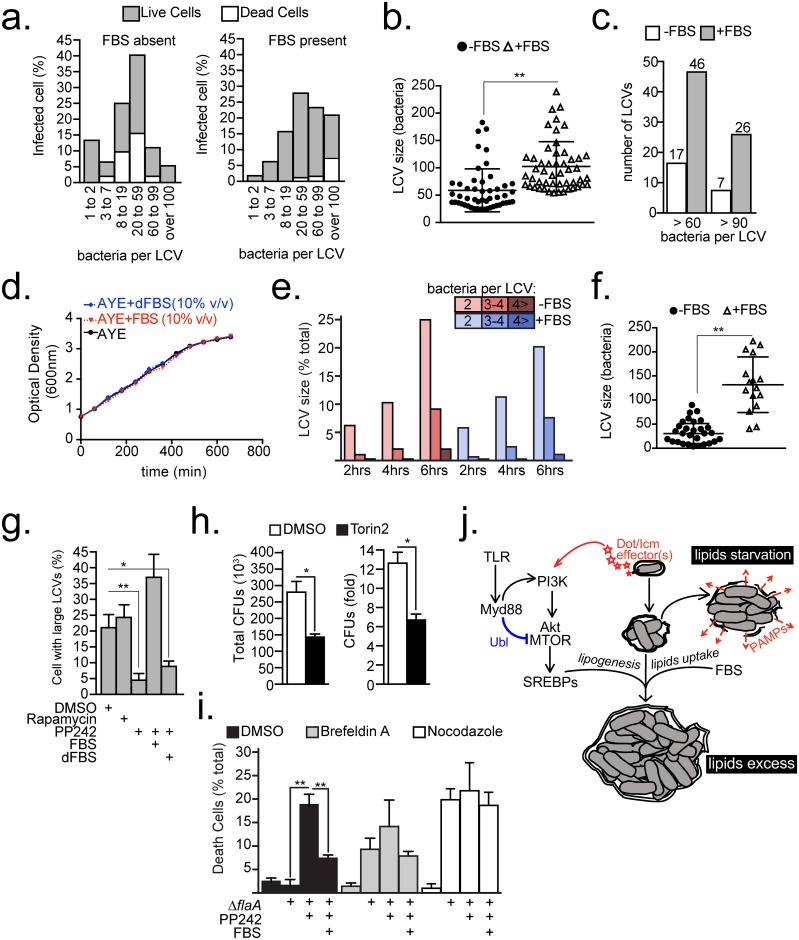
Vacuolar bacterial pathogens are sheltered within unique membrane-bound organelles that expand over time to support bacterial replication. These compartments sequester bacterial molecules away from host cytosolic immunosurveillance pathways that induce antimicrobial responses. The mechanisms by which the human pulmonary pathogen Legionella pneumophila maintains niche homeostasis are poorly understood. We uncovered that the Legionella-containing vacuole (LCV) required a sustained supply of host lipids during expansion. Lipids shortage resulted in LCV rupture and initiation of a host cell death response, whereas excess of host lipids increased LCVs size and housing capacity. We found that lipids uptake from serum and de novo lipogenesis are distinct redundant supply mechanisms for membrane biogenesis in Legionella-infected macrophages. During infection, the metabolic checkpoint kinase Mechanistic Target of Rapamycin (MTOR) controlled lipogenesis through the Serum Response Element Binding Protein 1 and 2 (SREBP1/2) transcription factors. In Legionella-infected macrophages a host-driven response that required the Toll-like receptors (TLRs) adaptor protein Myeloid differentiation primary response gene 88 (Myd88) dampened MTOR signaling which in turn destabilized LCVs under serum starvation. Inactivation of the host MTOR-suppression pathway revealed that L. pneumophila sustained MTOR signaling throughout its intracellular infection cycle by a process that required the upstream regulator Phosphatidylinositol-4,5-bisphosphate 3-kinase (PI3K) and one or more Dot/Icm effector proteins. Legionella-sustained MTOR signaling facilitated LCV expansion and inhibition of the PI3K-MTOR-SREPB1/2 axis through pharmacological or genetic interference or by activation of the host MTOR-suppression response destabilized expanding LCVs, which in turn triggered cell death of infected macrophages. Our work identified a host metabolic requirement for LCV homeostasis and demonstrated that L. pneumophila has evolved to manipulate MTOR-dependent lipogenesis for optimal intracellular replication.


Conflict of interest statement

The authors have declared that no competing interests exist.

Figures

Fig 1
Fig 1. Analysis of rS6p phosphorylation in bone marrow-derived macrophages.
Immunoblot analysis of cell lysates from Myd88-/- (a) or C57BL/6 (b) BMMs that were serum-starved and infected with Legionella (MOI = 20) for 4 hrs as indicated under serum-free conditions. Quantified band intensities are normalized to uninfected conditions (UN) and listed below each blot. Single-cell analysis of rS6p phosphorylation in serum-starved BMMs infected with either ΔflaA (c) of ΔdotA (d). Graph shows means and 95% confidence intervals of phospho-rS6p fluorescent intensity signal for at least 100 infected cells for each condition. * p<0.05, ** p<0.005 (one-way ANOVA). (a-d) A representative of three biological replicates is shown for each experiment.
Fig 2
Fig 2. Legionella-induced phosphorylation of rS6p requires MTOR and PI3K activity.
(a) Simplified schematics of the PI3K/MTOR signaling axis indicating the inhibitors used in this study. PI3K is inhibited by LY294002. Rapamycin, PP242 and Torin2 act on MTOR and Hanks' Balanced Salt Solution (HBSS) blocks MTOR by starving cells for amino acids. (b-d) Analyses of serum-starved Myd88-/- BMMs unstimulated or infected with ΔflaA (MOI = 20) for 5hrs under serum-free conditions. Inhibitors—Rapamycin (200nM), PP242 (5μM), LY294002 (10μM)—or HBSS were added at the time of infection synchronization at 60 min post infection. (b) Immunoblot analysis of S6K1 and rS6p phosphorylation from cell lysates showing quantified band intensities normalized to uninfected conditions (UN). (c) Single cell immunofluorescence analysis of phospho-rS6 positive (MFI>300) Myd88-/-macrophages exposed to ΔflaA (MOI = 20). Graphed are the means and standard deviations (s.d) of technical triplicates for the two distinct groups within the cell population—infected (LCV present) and uninfected (LCV absent) for each condition. At least 100 cells were analyzed for each condition. ** p<0.005 (one-way ANOVA) (d) Immunofluorescense micrographs of representative infected cells from each condition stained with anti-L. pneumophila (L.p), anti-p-rS6p (S235/236), anti-ubiquitinated proteins (FK2) antibodies and Hoechst 33342. Arrowheads indicate Legionella-containing vacuoles, Bar = 5μm. (b-d) A representative of three biological replicates is shown for each experiment.
Fig 3
Fig 3. Legionella-induced MTOR activation is a Dot/Icm effector-driven process independent of intracellular niche biogenesis.
(a-h) Show results from synchronized infections (MOI = 20) under serum-free conditions of serum-starved Myd88-/- BMMs treated as indicated. (a) Immonofluorescent micrograph of ΔflaA-infected (**) or neighboring uninfected (*) cells at 6 hrs post-infection stained with anti-L. pneumophila (L.p), anti-p-rS6p (S235/236) antibodies and Hoechst 33342. Arrowheads indicate Legionella-containing vacuoles, Bar = 10μm. (b-c and g) Single cell immunofluorescence analysis of phospho-rS6 positive (MFI>300) BMMs exposed to various Legionella strains for the indicated times (b) or for 8hrs (c and g). Means ± s.d of technical triplicates for the two distinct groups within the cell population—infected (LCV present) and uninfected (LCV absent) for each condition are shown. (d) Micrographs of cells infected with the indicated strains for 8hrs and stained with anti-L. pneumophila (L.p), anti-p-rS6p (S235/236), anti-ubiquitinated proteins (FK2) antibodies and Hoechst 33342. Arrowheads indicate intracellular bacteria, Bar = 5μm. (e) Quantitation of p-rS6p positive cells (MFI>300) in synchronized infections with a thyA ΔflaA strain in the presence (+thy) or absence (-thy) of thymidine for the indicated time periods. Means ± s.d of technical triplicates are shown. (f-g) Synchronized macrophages infections with different Legionella species are shown. (f) Representative micrographs of cells infected with L. pneumophila or L. dumoffii for 8hrs (MOI = 20) and stained as in (d), which are quantitated in (g). (h-i) Cells were treated with cytochalasin D (5μM) or vehicle (DMSO) for 15 min prior to and for the duration of infections (3hrs) with the indicated bacterial strains. (i) Quantitation of p-rS6p positive cells (MFI>300) in contact with bacteria (ΔflaA and ΔdotA) or uninfected cells (UNi). Means ± s.d of technical triplicates are shown. (h) Representative micrograph of macrophages treated with cytochalasin D (5μM) and infected with ΔflaA and stained as in (d). Arrowhead indicates a bacterium in contact with the macrophage, Bar = 1μm. At least 50 cells (i) or 100 cells (b, c, e and g) were analyzed for each condition. A representative of two (f-h) or three (a-g) biological replicates is shown for each experiment. (b, c, e, g and i) n.s—not significant, ** p<0.005 (unpaired T-test).
Fig 4
Fig 4. Loss of MTOR function triggers a host cell death response that requires bacterial replication.
(a) Experimental scheme for the results shown in (b-e and g-j). (b-j) BMMs were serum-starved and infected under serum-free conditions either at MOI = 20 (b-e and g-j) or MOI = 10 (f). (b) Micrographs showing representative of live and dead macrophages infected with Legionella for 12 hrs and stained with anti-L. pneumophila (L.p), anti-ubiquitinated proteins (FK2) antibodies and Hoechst 33342. Arrowheads indicate LCVs, Bar = 5μm. (*) marks the condensed nucleus of the dead cells. The mean nuclear volumes ± s.d of at least 100 live and 100 dead cells are graphed. (c-d) Quantitation of infected and neighboring uninfected Myd88-/- (c-d), C57BL/6 (d) and Mtor-/- (d) macrophages with condensed nuclei after infections with ΔflaA (c-d) or ΔdotA (d). Means ± s.d of technical replicates of dead cell as percentage of total cells in each condition are shown. (e) Quantitation of infected Myd88-/- BMMs with condensed nuclei after infection with L. dumoffii and treatment with inhibitors or vehicle as indicated. (f-g) Kinetics of the cell death response in C57BL/6 BMMs under serum starvation conditions infected as indicated. Quantitation of infected cells with condensed nuclei (f) and LDH released in the culture supernatants (g) are shown. (h-i) Analyses of ubiquitin recruitment (h) and LCV size (i) in live and dead Myd88-/- BMMs infected with ΔflaA and treated with PP242. (j) Cell death in infected Myd88-/- BMMs with thyA ΔflaA strain treated with vehicle (DMSO) or PP242 in the presence or absence of thymidine. (c, e, h-j) Rapamycin (250nM), PP242 (2.5μM), LY294002 (10μM), Torin2 (300nM). (c-j) Means ± s.d of technical triplicates for each condition are shown. At least 50 cells (e, h-j) or 200 cells (c-d) were analyzed for each condition. A representative of two (e-j) or three (c-d) biological replicates is shown for each experiment. (b-j) n.s—not significant, ** p<0.005 (unpaired T-test).
Fig 5
Fig 5. Legionella-dependent cell death triggered by MTOR suppression is blocked by lipids supplementation.
(a) Experimental scheme for the results shown in (b-d, f). (b-c) Myd88-/- BMMs with condensed nuclei (b) or positive for phospho-rS6p (MFI>300) (c) produced by infections with ΔflaA (MOI = 20) and the indicated treatments. Infected and neighboring uninfected cells were quantified for each category. (d) Infected and neighboring uninfected BMMs with condensed nuclei after infections with ΔflaA or ΔdotA (MOI = 20) in the presence/absence of FBS. (e) Kinetics of LDH release by C57BL/6 BMMs infected as indicated (MOI = 10) in the presence of FBS or dFBS. (f) Infected Myd88-/- BMMs with condensed nuclei produced by ΔflaA infection (MOI = 20) and the indicated treatments. (b-f) PP242 (2.5μM), LY294002 (10μM), FBS (10%), dFBS (10%), human LDL (10mg/ml). (b-f) Means ± s.d of technical triplicates for each condition are shown. At least 50 cells (c,f) or 100 cells (b,d) were analyzed for each condition. A representative of two (e-f) or three (b-d) biological replicates is shown for each experiment. (b-f) n.s—not significant, ** p<0.005 (unpaired T-test).
Fig 6
Fig 6. MTOR inhibition destabilizes LCVs.
(a) Schematic for detection of leaky LCVs by selective plasma membrane permeabilization of infected cells. Single-positive bacteria reside in stable LCVs; double-positive bacteria reside in disrupted LCVs (b-f) Serum-starved Myd88-/- macrophages infected with ΔflaA L. pneumophila (MOI = 20) for 7hrs. PP242 was added at the time of synchronization– 60min p.i. (b-c) Micrographs of representative stable (b) or leaky (c) LCVs are shown. Cells were stained as indicated in (a). Arrowheads indicate LCVs. Bar = 5μm (d) Quantitation of destabilized LCVs in cells treated as indicated. (e) Micrographs of representative destabilized LCVs (double-positive) in BMM with aberrant (A) nuclear morphology and stable LCVs (single-positive) in a neighboring cell with normal (N) nuclear morphology Bar = 5μm (f) Quantitation of destabilized LCVs in BMMs with normal or aberrant nuclear morphology. BMMs treated as indicated. (b-f) PP242 (2.5μM). (d-f) Means ± s.d of technical triplicates for each condition are shown. At least 100 LCVs were analyzed for each condition. (b-f) A representative of three biological replicates is shown. (d and f) ** p<0.005 (unpaired T-test).
Fig 7
Fig 7. Serum lipids, SREPB1/2 and MTOR regulate LCV stability.
Serum-starved Myd88-/- (a-f) or C57BL/6 (g) BMMs or were infected by the indicated strains (MOI = 20) in synchronized infections for 12 hrs (a-f) or for the indicated time periods (g) in the absence (a-g) or presence (f-g) of FBS. (a-b) Galectin 3 accumulation onto LCVs harboring ΔsdhA ΔflaA. (a) projection micrograph of a representative infected cell with the inset showing the LCV (b) Kinetic analysis of Galectin 3+ LCVs harboring ΔsdhA ΔflaA. (c,e) Representative projection micrographs of Galectin 3 positive (c,e) or negative (c) LCVs harboring ΔflaA after treatments with inhibitors (e) or vehicle alone (c). The insets show all individual planes of the projection image. Quantitation of Galectin 3+ LCVs after the indicated treatments in the absence (d and f) or presence (f) of FBS. (g) Kinetics of emergence of Galectin 3 positive LCV under serum starvation or replete conditions. (c-g) PP242 (2.5μM), fatostatin (4μM), FBS (10%). (b,d,f and g) Means ± s.d of technical triplicates for each condition are shown. At least 100 LCVs were analyzed for each condition. A representative of two (b, f-g) or three (a, c-e) biological replicates is shown for each experiment. (b, d, f and g) n.s—not significant, ** p<0.005 (unpaired T-test) (a, c and e) Cells were stained with anti-galectin3, anti-Legionella antibodies and Hoechst 33342. Arrowheads indicate the LCVs. Bar = 5μm.
Fig 8
Fig 8. Host lipids dictate the LCV housing capacity.
(a-c, f) Size analysis of LCVs harbored by C57BL/6 BMMs infected with ΔflaA bacteria (MOI = 20) for 15 hrs after 60 min synchronization. Cells were serum-starved prior to infection for 10hrs. LCV sizes were measured through 3D microscopy analysis of infected cells as detailed in S8 Fig. (a) Relative distributions of sizes of LCV harbored by live and dead cells produced by infections in the presence/absence of FBS. Live/dead distinction was determined morphologically by nuclear condensation. (b-c) Size analysis of the 50 largest LCVs produced by ΔflaA infections shown in (a). (d) Legionella growth in axenic cultures supplemented with FBS or delipidated FBS (dFBS) (10% v/v). (e) Kinetic analysis of LCVs that support bacterial replication in C57BL/6 BMMs infected with ΔflaA bacteria. FBS was added or omitted after the infection synchronization at 30min post infection. At least 200 LCVs were scored for each condition. (f) Size analysis of LCVs harbored by cells with condensed nucleus from (a). (g) Percentage of Myd88-/- BMMs harboring large LCVs (bacteria>20) produced by 12 hrs synchronized infections with ΔflaA bacteria. Cell treatments were initiated at 4 hrs post infection as indicated. (h) L. pneumophila intracellular growth in Acanthamoeba castellanii over 48hrs in the presence of DMSO or Torin2 (300 nM), MOI = 5. (i) Percentage of Myd88-/- BMMs with condensed nuclei uninfected or infected with ΔflaA bacteria for 9hrs. Infections were synchronized at 60min and various treatments were added at 6hrs as indicated. (j) Model for MTOR-dependent regulation of LCV homeostasis through the lipogenesis and serum-derived lipids. Abbreviations: ubiquitin ligase (UBL), pathogen-associated molecular patterns (PAMPs) (b, f-g, h-i) Means ± s.d of technical triplicates for each condition are shown. (a and g) At least 100 LCVs were analyzed for each condition. A representative of two (d, h-i) or three (a-c, e-g) biological replicates is shown for each experiment. (a, g and h) PP242 (2.5 μM), Brefeldin A (17.8 μM), Nocodazole (20 μM), FBS (10% v/v), dFBS (10% v/v) (b, f-i) * p<0.05, ** p<0.005 (unpaired T-test).

Comment in

Similar articles

Cited by

References

    1. Kumar Y, Valdivia RH. Leading a sheltered life: intracellular pathogens and maintenance of vacuolar compartments. Cell Host Microbe. 2009;5: 593–601. 10.1016/j.chom.2009.05.014 - DOI - PMC - PubMed
    1. Schulz F, Horn M. Intranuclear bacteria: inside the cellular control center of eukaryotes. Trends Cell Biol. 2015;25: 339–346. 10.1016/j.tcb.2015.01.002 - DOI - PubMed
    1. Manske C, Hilbi H. Metabolism of the vacuolar pathogen Legionella and implications for virulence. Front Cell Infect Microbiol. Frontiers; 2014;4: 125. - PMC - PubMed
    1. Isberg RR, O'Connor TJ, Heidtman M. The Legionella pneumophila replication vacuole: making a cosy niche inside host cells. Nat Rev Microbiol. 2009;7: 13–24. 10.1038/nrmicro1967 - DOI - PMC - PubMed
    1. Tilney LG, Harb OS, Connelly PS, Robinson CG, Roy CR. How the parasitic bacterium Legionella pneumophila modifies its phagosome and transforms it into rough ER: implications for conversion of plasma membrane to the ER membrane. J Cell Sci. 2001;114: 4637–4650. - PubMed

Substances