. 2016 Dec 8;1(20):e87446.
doi: 10.1172/jci.insight.87446.

Pentraxin-2 suppresses c-Jun/AP-1 signaling to inhibit progressive fibrotic disease

Affiliations

Pentraxin-2 suppresses c-Jun/AP-1 signaling to inhibit progressive fibrotic disease

Naoki Nakagawa et al. JCI Insight. .

Abstract

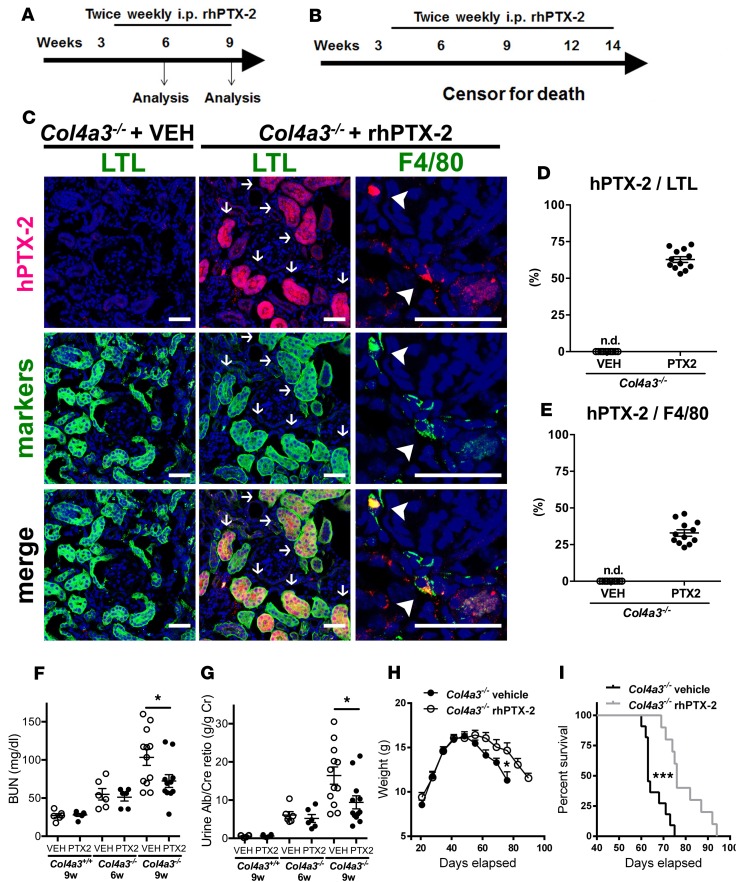
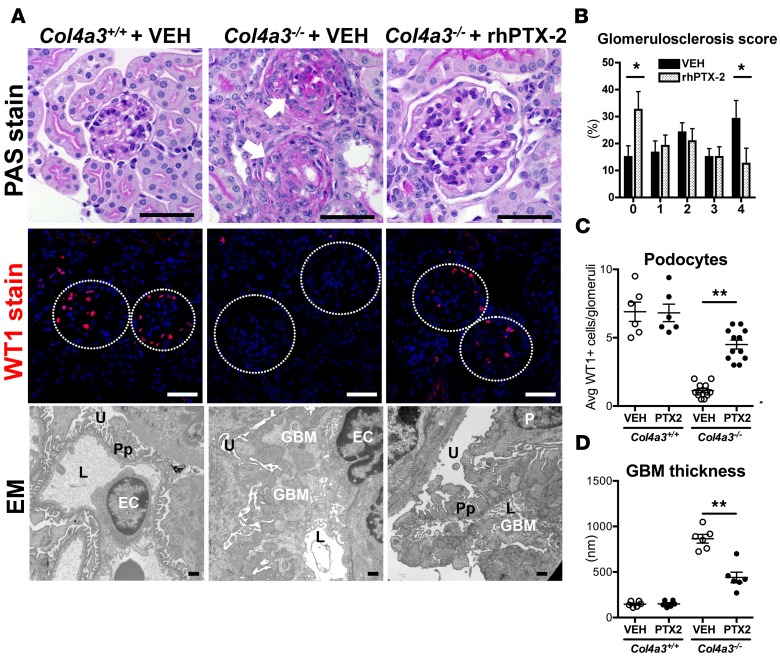
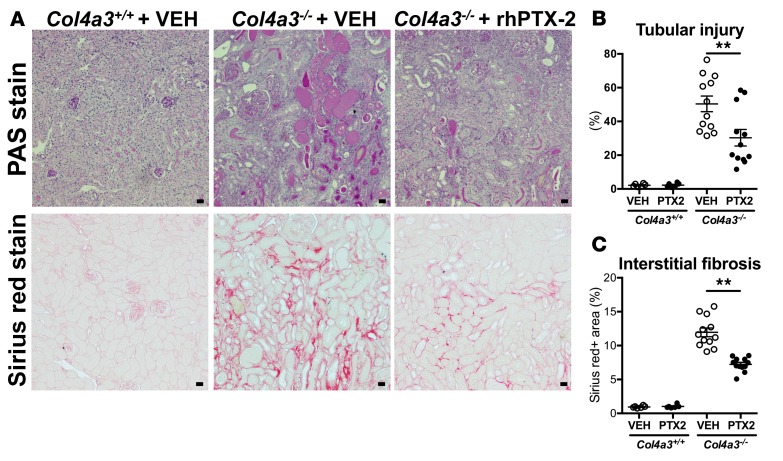
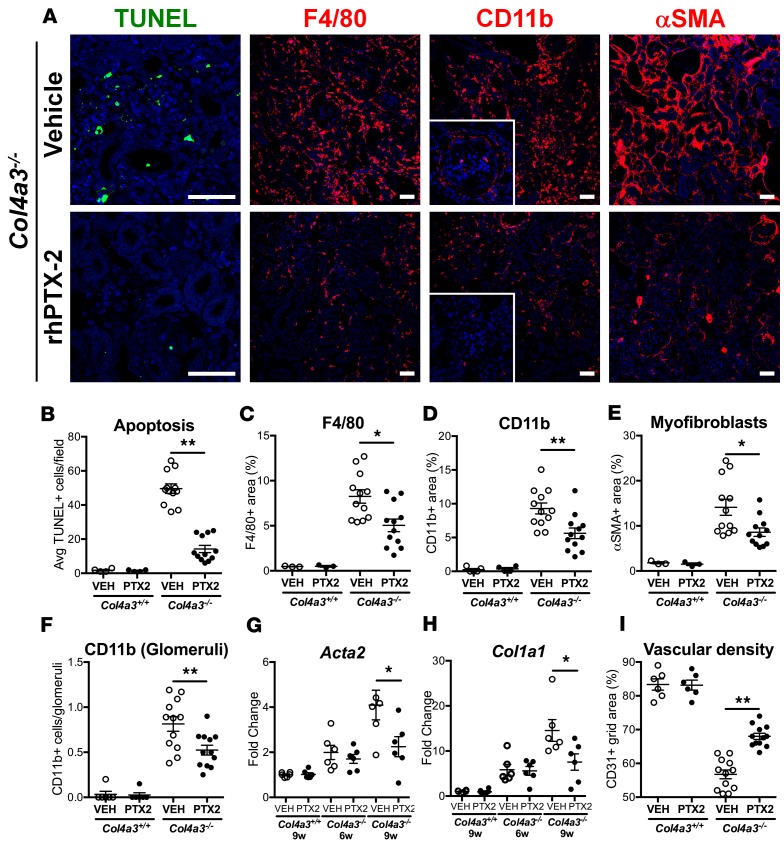
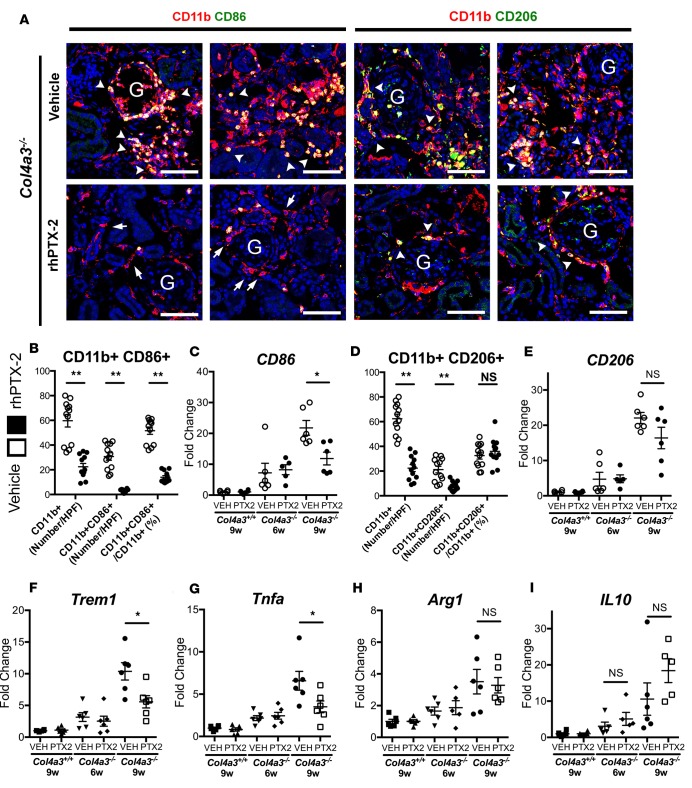
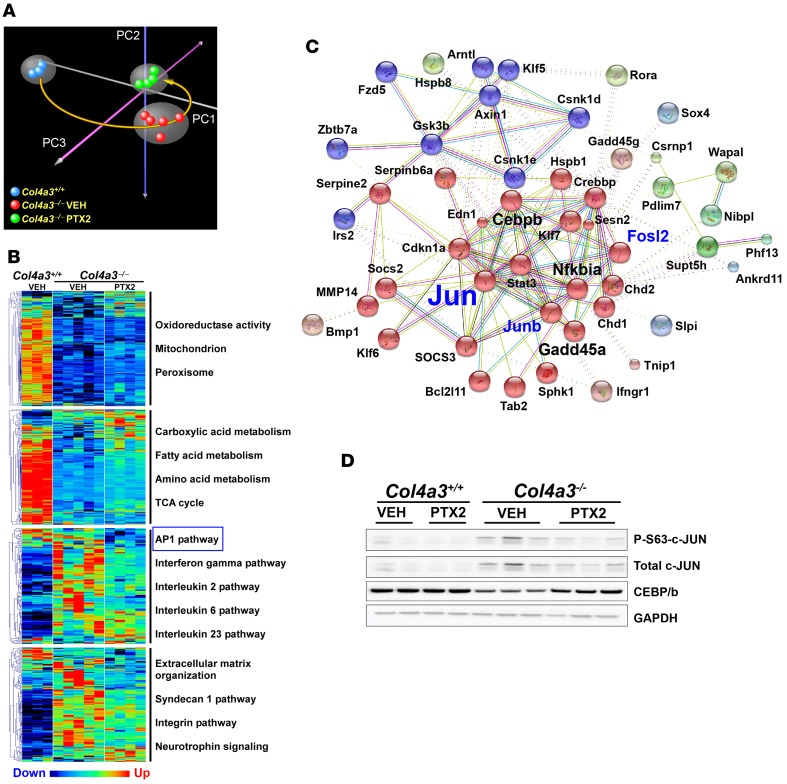
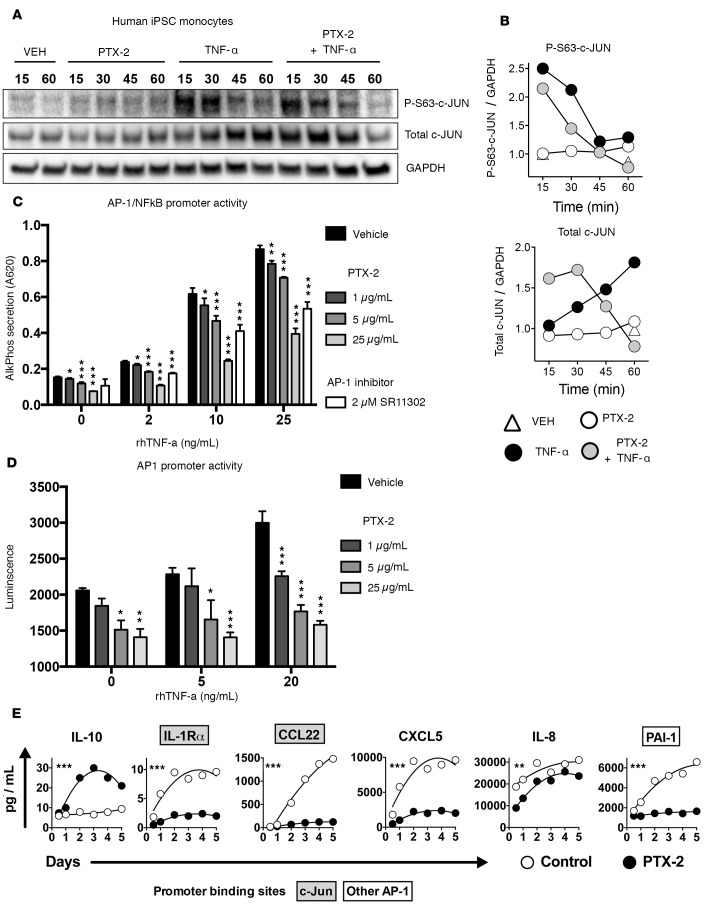
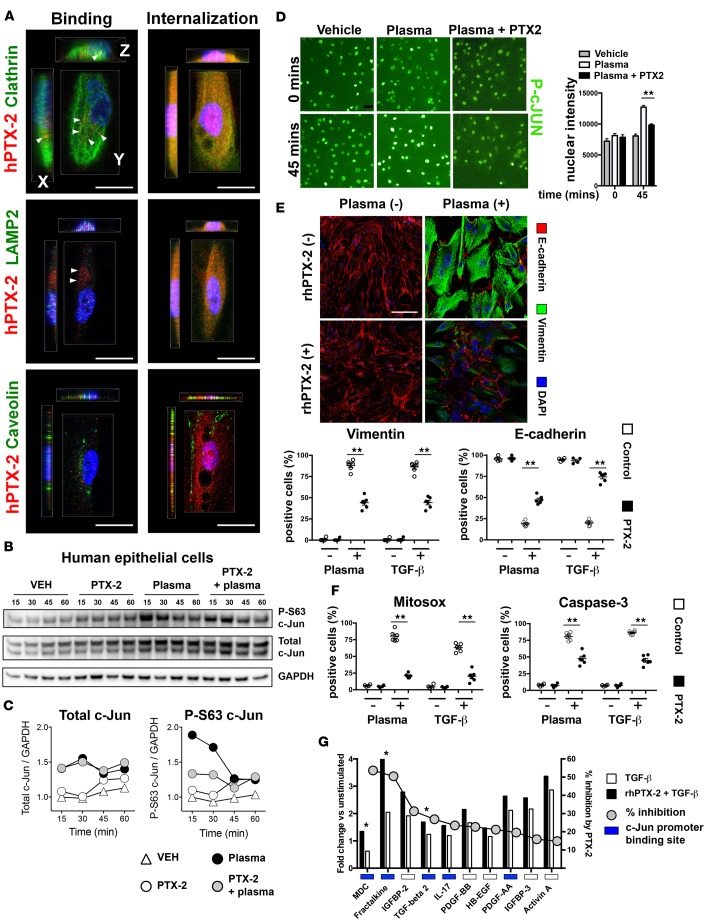
Pentraxin-2 (PTX-2), also known as serum amyloid P component (SAP/APCS), is a constitutive, antiinflammatory, innate immune plasma protein whose circulating level is decreased in chronic human fibrotic diseases. Here we show that recombinant human PTX-2 (rhPTX-2) retards progression of chronic kidney disease in Col4a3 mutant mice with Alport syndrome, reducing blood markers of kidney failure, enhancing lifespan by 20%, and improving histological signs of disease. Exogenously delivered rhPTX-2 was detected in macrophages but also in tubular epithelial cells, where it counteracted macrophage activation and was cytoprotective for the epithelium. Computational analysis of genes regulated by rhPTX-2 identified the transcriptional regulator c-Jun along with its activator protein-1 (AP-1) binding partners as a central target for the function of rhPTX-2. Accordingly, PTX-2 attenuates c-Jun and AP-1 activity, and reduces expression of AP-1-dependent inflammatory genes in both monocytes and epithelium. Our studies therefore identify rhPTX-2 as a potential therapy for chronic fibrotic disease of the kidney and an important inhibitor of pathological c-Jun signaling in this setting.


Conflict of interest statement

R.M. Jack is the CSO, COO, and President of Promedior Inc. M.L. Lupher Jr. is a former member of Promedior Inc. J.S. Duffield holds stock options in Promedior Inc.

Figures

Figure 1
Figure 1. rhPTX-2 localizes to interstitial macrophages and proximal epithelial cells and protects Col4a3–/– mice from kidney disease progression.
Experimental schema indicating rhPTX-2 delivery from 3.5 weeks after birth and (A) analysis at 42 days (6 weeks) and 63 days (9 weeks) or (B) continued to 94 days (14 weeks). (C) Split-panel confocal images of 9-week-old Col4a3–/– kidney cortex showing distribution of rhPTX-2 colocalized with proximal tubular epithelial cells (lotus lectin [LTL], arrows) and macrophages (F4/80, arrowheads). Scale bars: 50 μm. Proportions of (D) hPTX-2+LTL+ proximal tubular epithelial cells and (E) hPTX2+F4/80+ macrophages at 9 weeks after twice weekly i.p. injections of rhPTX-2. (F) Plasma BUN levels at 9 weeks. (G) Urine albumin concentration normalized to urine creatinine at 9 weeks. (H) Body weights from start of treatment to death. (I) Kaplan-Meier survival curve. n = 6–12/group. *P < 0.05, ***P < 0.001 (ANOVA with post hoc testing for multiple comparisons and Gehan-Breslow-Wilcoxon test for survival). VEH, vehicle; n.d., not detected.
Figure 2
Figure 2. rhPTX-2 prevents glomerulosclerosis, glomerular basement membrane accumulation, and podocyte loss.
(A) Representative images of kidney cortex at 9 weeks of age showing periodic acid–Schiff– stained (PAS-stained) images of glomeruli with glomerulosclerosis (white arrows); WT-1 immunofluorescence for podocytes within glomeruli (dotted lines); electron microscopy (EM) images of glomerular capillary loops showing severe glomerular basement membrane (GBM) thickening with humps, and podocyte effacement (loss of processes) in vehicle-treated Col4a3–/– mice. rhPTX-2–treated Col4a3–/– mice show areas of preserved basement membrane and partial foot process effacement, but small classical basement membrane humps persist. U, urinary space; P, podocyte; Pp, podocyte processes; L, capillary lumen; EC, endothelial cell. (B) Glomerulosclerosis score ranged from none (0) to >75% of glomeruli affected (4). (C) WT-1+ podocytes per glomerular cross-section. (D) GBM thickness. Scale bars: 50 μm (light) or 500 nm (EM). n = 6–12/group. *P < 0.05, **P < 0.01 (ANOVA with post hoc testing for multiple comparisons). VEH, vehicle.
Figure 3
Figure 3. rhPTX-2 prevents tubular epithelial injury and interstitial fibrosis in Col4a3–/– kidneys.
(A) PAS-stained and Sirius red–stained images of kidney cortex. Note severe tubular injury with proteinaceous casts and loss of polarity and brush border of epithelium in Col4a3–/– mice (upper center panel). These pathological features are much milder following rhPTX-2 treatment. (B) Tubular injury score (C) Morphometric analysis of interstitial fibrosis detected by Sirius red staining. Scale bars: 50 μm. n = 6–12/group. **P < 0.01 (ANOVA with post hoc testing for multiple comparisons). VEH, vehicle.
Figure 4
Figure 4. Epithelial cell death, myofibroblasts, and macrophage cell expansion are all attenuated by rhPTX-2.
(A) Images of apoptotic tubular epithelial cells (TUNEL+), macrophages (F4/80+), myeloid cells (CD11b+), and myofibroblasts (α-SMA+) in kidney at 9 weeks. Insets show a glomerulus labeled for CD11b expression. (B) Tubular apoptosis, (C) macrophages, (D) myeloid cells, and (E) myofibroblasts. (F) CD11b+ cells per glomerular tuft. (G and H) Q-PCR measuring Acta2 and Col1a1 transcripts in whole kidney tissue. (I) Quantification of peritubular capillary density. Scale bars: 50 μm. n = 6–12/group. *P < 0.05, **P < 0.01 (ANOVA with post hoc testing for multiple comparisons). Avg, average; VEH, vehicle.
Figure 5
Figure 5. rhPTX-2 reduces the population of M1-type activated macrophages in Col4a3–/– mice.
(A) Images of kidney M1 (CD86+) and M2 (CD206/mannose receptor+) macrophages at 9 weeks. G, glomerulus. (B and D) Numbers and percentages of CD86+ or CD206+ macrophages in tissue sections. (C and EI) Q-PCR measuring M1-type (CD86, Trem1, Tnfa) and M2-like (CD206, Arg1) markers, and Il10 in whole kidney. Scale bars: 50 μm. n = 6–12/group. *P < 0.05, **P < 0.01 (ANOVA with post hoc testing for multiple comparisons). VEH, vehicle.
Figure 6
Figure 6. Gene set enrichment analysis identifies attenuated c-Jun signaling as a direct and central consequence of PTX-2 treatment.
(A) Principal component analysis of kidney transcriptome. Treatment of Col4a3–/– mice with rhPTX-2 partly reverses separation from the uninjured Col4a3+/+ animals, indicating rhPTX-2 therapy reduced transcriptional perturbation. (B) Summary of pathway analysis (GSEA) depicted as heatmaps of individual leading-edge genes (rows) and individual mice (columns). Enriched gene sets fell into 4 broad functional categories induced by disease: mitochondrion/oxidoreductase activity, metabolism, inflammation/immunity, and tissue remodeling. Within each category, PTX-2 treatment of Col4a3–/– mice partly restored disease-induced gene expression changes to their unperturbed baseline. Note only AP-1 signaling (blue box) was suppressed below baseline levels by rhPTX-2. (C) Abbreviated protein-protein interaction network predicted by STRING analysis of the top 100 leading-edge genes identified by GSEA and downregulated by rhPTX-2 treatment. Line color denotes type of evidence: green: neighborhood, red: gene fusion, blue: co-occurrence, black: coexpression, purple: experiments, cyan: databases, yellow: text mining, and lilac: homology. (D) Western blots showing the effect of disease and PTX-2 treatment on p–S63-c-Jun, total c-Jun, and C/EBP in kidney tissue. VEH, vehicle.
Figure 7
Figure 7. rhPTX-2 directly attenuates c-Jun and AP-1 complex signaling in human monocytes.
(A and B) Time-course Western blots (A) and densitometry quantification (B) showing c-Jun phosphorylation (p–S63-c-Jun) and total c-Jun levels from 15 to 60 minutes after rhPTX-2 and/or TNF-α stimulation in human iPSC-derived monocytes, normalized to GAPDH. Note that rhPTX-2 attenuates both total and p–c-Jun in response to TNF-α. Data represent 3 experiments. (C) Effect of concentrations of PTX-2 or AP-1 inhibitor SR11302 on TNF-α–induced AP1/NF-κB promoter activity in human monocytes. (D) Effect of concentrations of PTX-2 on TNF-α–induced AP-1 promoter activity alone, in human monocytes. (E) rhPTX-2–induced changes in the secretion of factors associated with fibrosis by primary human monocytes cultured from 12 to 120 hours. Presence of c-Jun and AP-1 binding sites in the promoters of these genes is indicated, based on the GeneCards database. n = 3–8/group (*P < 0.05, **P < 0.01, ***P < 0.001 (ANOVA with post hoc testing for multiple comparisons). VEH, vehicle; AlkPhos, alkaline phosphatase.
Figure 8
Figure 8. rhPTX-2 binds to proximal tubule epithelial cell membrane, inhibits c-Jun signaling, and protects against cellular stress.
(A) 3D reconstructed confocal images of representative individual human PTECs stained for rhPTX-2 (red) and clathrin, LAMP-2, or caveolin (green) showing x, y, and z axes. The left panels indicate the surface distribution of hPTX-2 following rhPTX-2 incubation for 30 minutes on ice (arrowheads). The right panels show the distribution of internalized rhPTX-2 following incubation 30 minutes at 37°C. (B and C) Time-course Western blots showing c-Jun phosphorylation (P-S63 c-Jun) and total c-Jun levels from 15 to 60 minutes after rhPTX-2 and/or plasma shock in human fetal kidney proximal tubule epithelial cells, normalized to GAPDH. Data represent 3 experiments. (D) Images and graph quantifying nuclear p–c-JUN immunofluorescence staining intensity in human PTECs in response to plasma and PTX-2. (E) Images and quantification of E-cadherin and vimentin expression by human PTECs in resting culture conditions or in response to human plasma or TGF-β1 for 24 hours. Note that 1 hour pretreatment of rhPTX-2 markedly blocked these responses. (F) Quantification of mitochondrial dysfunction by MitoSOX (left) and apoptosis by activated caspase-3 (right) detection 24 hours after human PTECs were challenged with human plasma or TGF-β1, with or without 1-hour rhPTX-2 pretreatment. (G) Inhibitory effect of rhPTX-2 on factors secreted by human PTECs in response to TGF-β1 stimulation. Fold change versus vehicle-treated PTECs and percent inhibition by rhPTX-2 are shown, and presence of c-Jun binding sites in promoters are noted. Scale bars: 25 μm. n = 3–6/group. *P < 0.05, **P < 0.01 (ANOVA with post hoc testing for multiple comparisons). VEH, vehicle.

References

    1. Pilling D, Buckley CD, Salmon M, Gomer RH. Inhibition of fibrocyte differentiation by serum amyloid P. J Immunol. 2003;171(10):5537–5546. doi: 10.4049/jimmunol.171.10.5537. - DOI - PMC - PubMed
    1. Castaño AP, et al. Serum amyloid P inhibits fibrosis through Fc gamma R-dependent monocyte-macrophage regulation in vivo. Sci Transl Med. 2009;1(5):5ra13. - PMC - PubMed
    1. Duffield JS, Lupher ML. PRM-151 (recombinant human serum amyloid P/pentraxin 2) for the treatment of fibrosis. Drug News Perspect. 2010;23(5):305–315. doi: 10.1358/dnp.2010.23.5.1444206. - DOI - PubMed
    1. Botto M, et al. Amyloid deposition is delayed in mice with targeted deletion of the serum amyloid P component gene. Nat Med. 1997;3(8):855–859. doi: 10.1038/nm0897-855. - DOI - PubMed
    1. Bickerstaff MC, et al. Serum amyloid P component controls chromatin degradation and prevents antinuclear autoimmunity. Nat Med. 1999;5(6):694–697. doi: 10.1038/9544. - DOI - PubMed

Publication types