. 2016 Dec 8;1(20):e88242.
doi: 10.1172/jci.insight.88242.

Tissue distribution and clonal diversity of the T and B cell repertoire in type 1 diabetes

Affiliations

Tissue distribution and clonal diversity of the T and B cell repertoire in type 1 diabetes

Howard R Seay et al. JCI Insight. .

Abstract

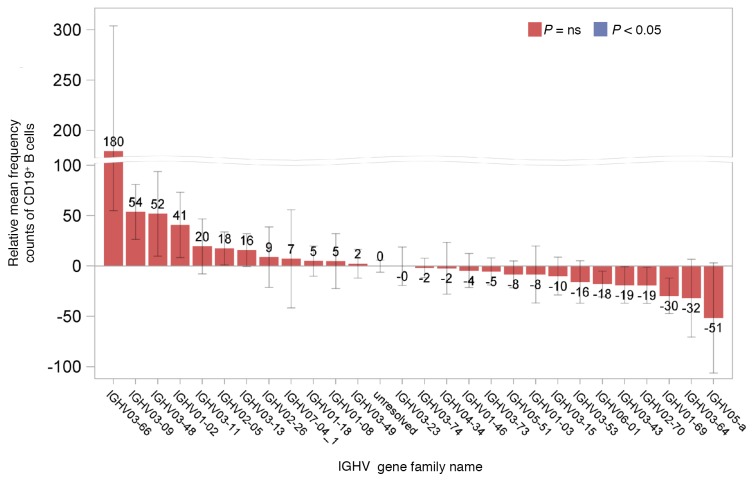
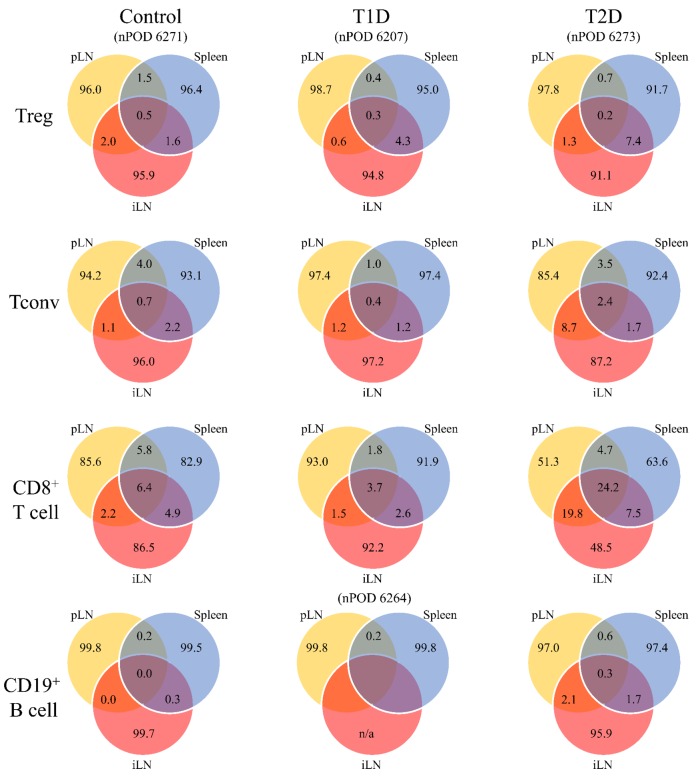
The adaptive immune repertoire plays a critical role in type 1 diabetes (T1D) pathogenesis. However, efforts to characterize B cell and T cell receptor (TCR) profiles in T1D subjects have been largely limited to peripheral blood sampling and restricted to known antigens. To address this, we collected pancreatic draining lymph nodes (pLN), "irrelevant" nonpancreatic draining lymph nodes, peripheral blood mononuclear cells (PBMC), and splenocytes from T1D subjects (n = 18) and control donors (n = 9) as well as pancreatic islets from 1 T1D patient; from these tissues, we collected purified CD4+ conventional T cells (Tconv), CD4+ Treg, CD8+ T cells, and B cells. By conducting high-throughput immunosequencing of the TCR β chain (TRB) and B cell receptor (BCR) immunoglobulin heavy chain (IGH) on these samples, we sought to analyze the molecular signature of the lymphocyte populations within these tissues and of T1D. Ultimately, we observed a highly tissue-restricted CD4+ repertoire, while up to 24% of CD8+ clones were shared among tissues. We surveyed our data set for previously described proinsulin- and glutamic acid decarboxylase 65-reactive (GAD65-reactive) receptors, and interestingly, we observed a TRB with homology to a known GAD65-reactive TCR (clone GAD4.13) present in 7 T1D donors (38.9%), representing >25% of all productive TRB within Tconv isolated from the pLN of 1 T1D subject. These data demonstrate diverse receptor signatures at the nucleotide level and enriched autoreactive clones at the amino acid level, supporting the utility of coupling immunosequencing data with knowledge of characterized autoreactive receptors.


Conflict of interest statement

M. Vignali, R.O. Emerson, and E. Yusko are employees of and have equity ownership in Adaptive Biotechnologies. H.S. Robins is an employee, has equity ownership, patents, and royalties with Adaptive Biotechnologies.

Figures

Figure 1
Figure 1. Productive clonality for donor samples showing unique T cell receptors (TRB) and B cell receptors (IgH) depicted by heatmap.
Organ donors are listed along the y axis according to Network for Pancreatic Organ Donors with Diabetes (nPOD) case number and disease status. FACS-isolated cell subsets and tissue source are listed on the x axis. This cohort analysis resulted in an average of 35,822 unique sequences per sample, totaling an average of 46,523 total templates per sample. Dark gray boxes indicate samples that were not available for immunosequencing. Heatmap values depict productive clonality ranging from 0 to 0.6, with red to blue coloring centered at 0.1 (indicated by a black line). Productive clonality is a normalized score based on diversity and sample entropy, with higher values (blue) representing enriched oligoclones (samples with fewer predominant rearrangements). Conversely, clonality values approaching 0 (red) represent samples with highly diverse repertoire. For nPOD 6323, intraislet CD4+ and CD8+ T cells were also available for immunosequencing. nPOD 6274 classification as T2D is based on a prior diagnosis, despite subsequent resumption of metabolic normalcy following gastric bypass surgery. pLN, pancreatic draining lymph node; iLN, “irrelevant” mesenteric and/or inguinal lymph node; PBMC, peripheral blood mononuclear cells; Tconv, conventional T cells; T1D, type 1 diabetes; T2D, type 2 diabetes; FDB, control, other/Flatbush diabetes; AAb+, autoantibody positive without diabetes.
Figure 2
Figure 2. Differences in T cell receptor β chain V (TRBV) gene family member usage in donors with type 1 diabetes (T1D) relative to control donors.
The mean frequency counts of TRBV gene family members of pancreatic draining lymph nodes (pLN) from T1D donors were divided by the mean frequency counts of TRBV gene family members of pLN from control donors (calculations are described in detail in the Methods). These relative mean frequency counts are shown for (A) CD8+ T cells, (B) Treg, and (C) CD4+ conventional T cells (Tconv). Error bars represent standard error of the estimated difference in abundance. P < 0.05 was considered significant, indicated by blue bars, and determined using the Welch’s 2-tailed t test, as necessary. Red bars indicate that the difference is not significant (P ≥ 0.05).
Figure 3
Figure 3. Differences in immunoglobulin heavy chain V (IGHV) gene family member usage in donors with type 1 diabetes (T1D) relative to control donors.
The mean frequency counts of IGHV gene family members of pancreatic draining lymph nodes (pLN) from T1D donors were divided by the mean frequency counts of IGHV gene family members of pLN from control donors (calculations are described in detail in the Methods). These relative mean frequency counts are shown for CD19+ B cells from pLN tissue. Error bars represent standard error of the estimated difference in abundance. P < 0.05 was considered significant and determined using the Welch’s 2-tailed t test, as necessary. Red bars indicate that the difference is not significant (P ≥ 0.05).
Figure 4
Figure 4. V and J gene usage and pairing for the top 30 T cell receptor β chain (TCRβ) V genes.
Average V and J gene usage within the pancreatic draining lymph node (pLN) of (A, C, and E) T1D and (B, D, and F) control organ donors. Prevalence of each V-J gene pair was not significantly different between T1D and control donors within (A and B) CD8+ T cells (CD8), (C and D) CD4+ conventional T cells (Tconv), or (E and F) CD4+ Treg (P = NS, unpaired t test).
Figure 5
Figure 5. V and J gene usage and pairing for the top 30 immunoglobulin heavy chain (IgH) V genes.
Average V and J gene usage within the pancreatic draining lymph node (pLN) of (A) T1D and (B) control organ donors. Prevalence of each V-J gene pair was not significantly different between T1D and control donors within B cells (IgH) (P = NS, unpaired t test).
Figure 6
Figure 6. Immune subsets display distinct receptor distributions among various tissues.
The percentage of unique T cell receptor β chain (TRB) and B cell receptor (BCR) immunoglobulin heavy chain (IGH) complementarity determining region 3 (CDR3) amino acid (AA) sequences shared across the pancreatic draining lymph node (pLN, yellow), spleen (blue), and “irrelevant” mesenteric and/or inguinal lymph node (iLN, red) is shown for representative donors (control [nPOD 6271], T1D [nPOD 6207], and T2D [nPOD 6273]) and donors within the Treg, CD4+ conventional T cell (Tconv), CD8+ T cell, and CD19+ B cell subsets. B cells were not available for the T1D donor. pLN and spleen B cells were compared for another T1D donor (nPOD 6264), and iLN B cells were also not available (n/a).
Figure 7
Figure 7. T cell receptor (TCR) sharing among intraislet and peripheral tissues.
Spleen, peripheral blood mononuclear cells (PBMC), pancreatic draining lymph node (pLN), and pancreatic islets harbor distinct adaptive immune repertoires in a 22-year-old organ donor (nPOD 6323) with type 1 diabetes (T1D) for 6 years. (A) The CD3+ insulitis lesion is evident by histology of insulin islets within the pancreas tail region (CD3, brown; glucagon, red; scale bar: 100 μm). Serial sections of the pancreatic tail region show two islets with (B) insulitis (CD3, brown; glucagon, red) and (C) residual insulin+ β cells (Ki67, brown; insulin, red; scale bar: 200 μm). (D) CD19+ B cells were also observed surrounding an islet within the pancreatic head region (CD19, brown, glucagon, red; scale bar: 100 μm). The Venn diagrams show the absolute number of unique (E) CD8+ T cells, (F) CD4+ conventional T cells (Tconv), and (G) Treg complementarity determining region 3 β chain (CDR3β) amino acid (AA) sequences shared across PBMC (blue), intraislet (green), pLN (red), and spleen (orange) samples. Within the intraislet region, no Treg were isolated, so only total CD4+ or CD8+ sequences were available for comparison. The numbers show the CDR3β AA sequence overlap between the indicated tissue and the islet sample calculated for each clone that is detected in both samples: number of shared templates/total templates in both samples. Additional histology is freely available for review at the nPOD Aperio database with login credentials (http://ahc-path-apr01.ahc.ufl.edu/Login.php, for which the password request form can be found at http://www.jdrfnpod.org/for-investigators/password-request-form/).
Figure 8
Figure 8. Lymphocyte repertoire diversity was comparable between donors with type 1 diabetes (T1D) and control donors.
Receptor repertoire diversity was calculated using the Shannon Diversity Index for CD8+ T cells (CD8), B cells (IGH), CD4+ T conventional cells (Tconv), and Treg isolated from (A) pancreatic draining lymph node (pLN), (B) spleen, and (C) “irrelevant” mesenteric and/or inguinal lymph node (iLN), and diversity scores were compared for T1D (gray) versus control (white) subjects (P = NS, all). Data are presented using box-and-whisker plots, with the points representing outliers defined as > (×1.5 IQR + Q3) or < (Q1-1.5 × IQR). T cell receptor (TCR) clones observed in the Treg (x axis) and Tconv (y axis) subsets within the pLN of representative (D) T1D (nPOD 6285), (E) type 2 diabetes (T2D; nPOD 6273), and (F) control (nPOD 6254) subjects are shown in scatter plots, with each point representing a unique clone and its position along the axes representing the clone’s frequency in either subset. Sequences present in only the Tconv subset are to the left of the vertical dotted line, while those detected only in the Treg subset are below the horizontal dotted line. T cell clones common to both subsets are shown in the top right quadrant above and to the right of the dotted lines. (G) Box-and-whisker plots depict the percentage of TCR clones shared between Tconv and Treg subsets within the pLN (median ± distribution, P = NS, Mann-Whitney U test).
Figure 9
Figure 9. Detection of a highly enriched T cell receptor β chain (TCRβ) complementarity determining region 3 (CDR3) identical to a known glutamic acid decarboxylase–reactive (GAD-reactive) clone in the pancreatic draining lymph node (pLN) of a subject with type 1 diabetes (T1D).
Heatmaps depict the (A) clone frequency and (B) clone rank of a TRB CDR3 region identical to that of the known GAD65-specific TCR clone GAD4.13 detected within the regulatory T cell (Treg), conventional T cell (Tconv), and CD8+ T cell (CD8) subsets in the spleen, pancreatic draining lymph node (pLN), and “irrelevant” mesenteric and/or inguinal lymph node (iLN) of type 1 diabetes (T1D; n = 7) and control (n = 1) organ donors. For nPOD 6323 (seventh row), intraislet T cells were expanded prior to sorting, which prevented distinction of Treg from Tconv, so total CD4+CD8 T cells are depicted. Dark gray boxes indicate samples that were not observed to contain the TCR clone. For both heatmaps (A and B), orange represents the abundant clones, while blue represents those present at lower abundance. The amino acid (AA) sequence of the CDR3 from GAD4.13 was the most abundant receptor in the pLN of T1D subject nPOD 6265 (sixth row), representing approximately 25.2% of all productive TCR clones within the Tconv cells isolated from the pLN. (C) The packed bubble plot (Tableau Software) depicts the frequency of the AA CDR3 from GAD4.13 (red circle, CASSLVGGPSSEAFF) in the nPOD 6265 pLN Tconv sample relative to all other sequences (blue circles).

References

    1. Atkinson MA, Eisenbarth GS, Michels AW. Type 1 diabetes. Lancet. 2014;383(9911):69–82. doi: 10.1016/S0140-6736(13)60591-7. - DOI - PMC - PubMed
    1. Roep BO, Peakman M. Diabetogenic T lymphocytes in human Type 1 diabetes. Curr Opin Immunol. 2011;23(6):746–753. doi: 10.1016/j.coi.2011.10.001. - DOI - PubMed
    1. Noble JA, Valdes AM. Genetics of the HLA region in the prediction of type 1 diabetes. Curr Diab Rep. 2011;11(6):533–542. doi: 10.1007/s11892-011-0223-x. - DOI - PMC - PubMed
    1. Lampeter EF, et al. Transfer of insulin-dependent diabetes between HLA-identical siblings by bone marrow transplantation. Lancet. 1993;341(8855):1243–1244. doi: 10.1016/0140-6736(93)91148-F. - DOI - PubMed
    1. Lampeter EF, McCann SR, Kolb H. Transfer of diabetes type 1 by bone-marrow transplantation. Lancet. 1998;351(9102):568–569. - PubMed

Publication types

MeSH terms

Substances