. 2016 Dec 8;1(20):e89173.
doi: 10.1172/jci.insight.89173.

Chorioretinal thinning in chronic kidney disease links to inflammation and endothelial dysfunction

Affiliations

Chorioretinal thinning in chronic kidney disease links to inflammation and endothelial dysfunction

Craig Balmforth et al. JCI Insight. .

Abstract

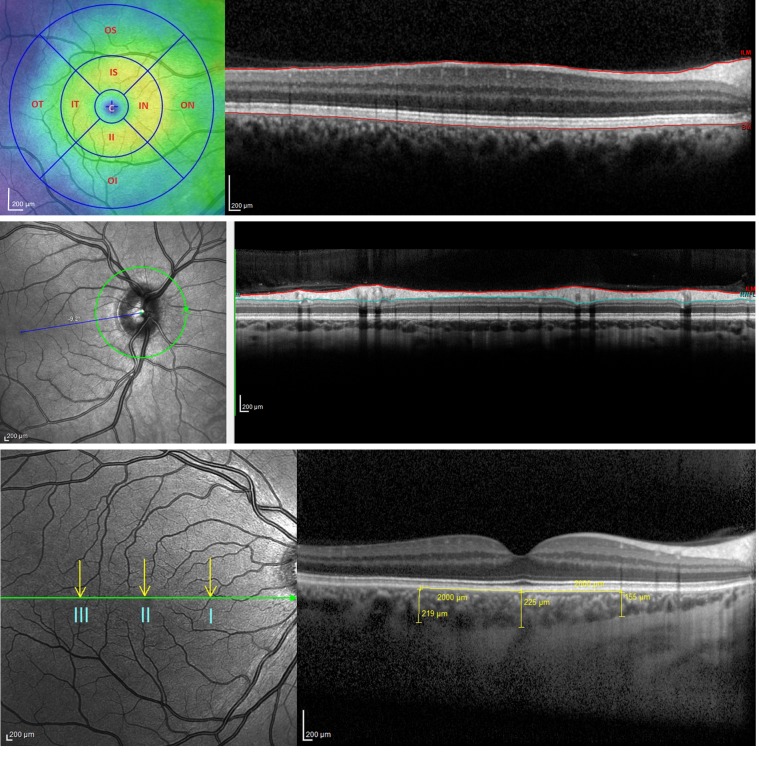
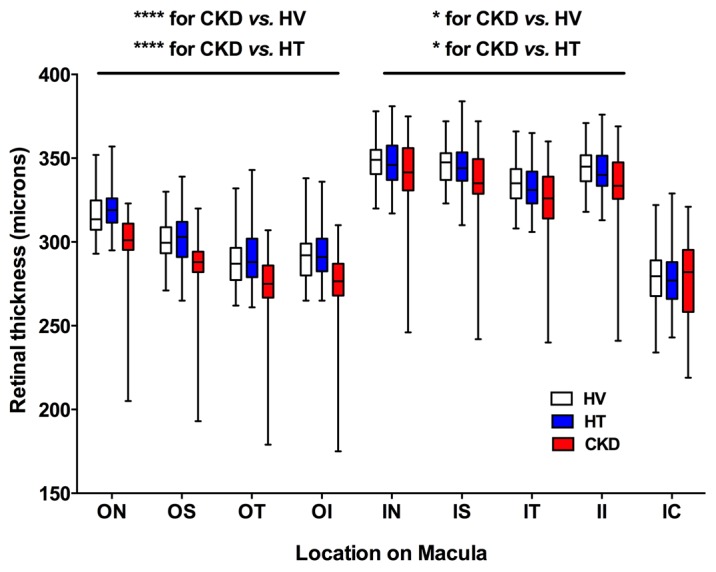
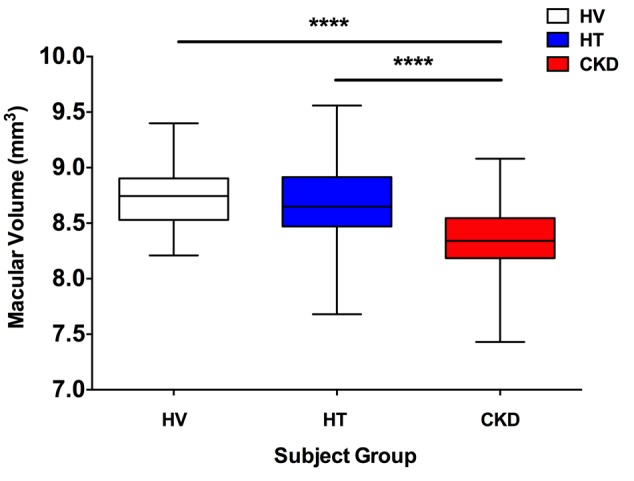
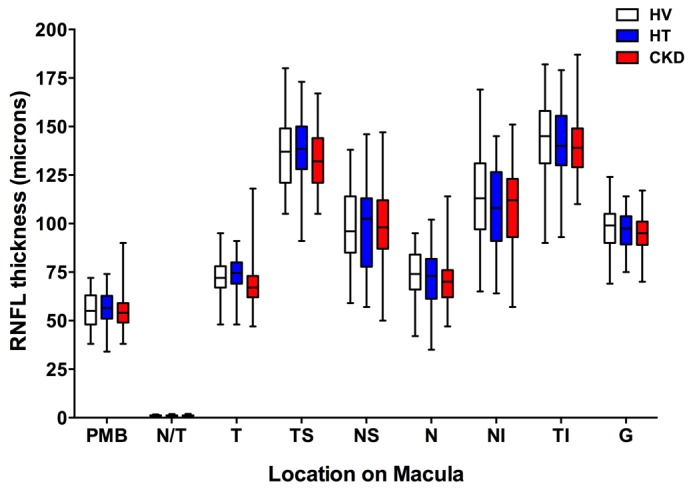
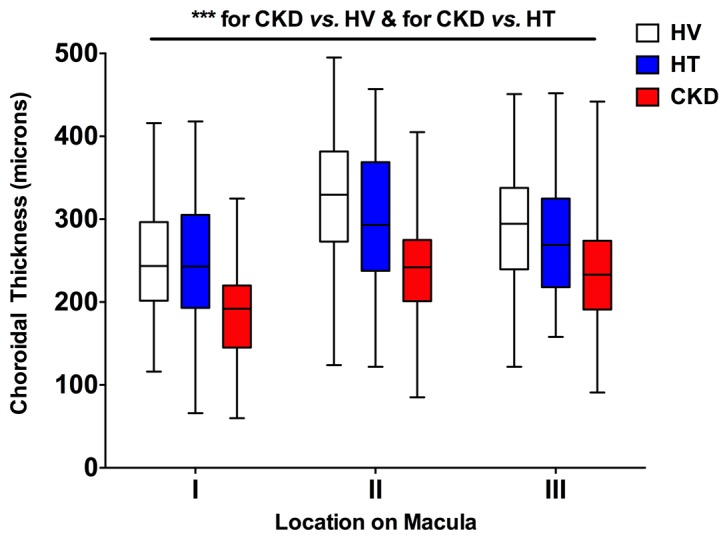
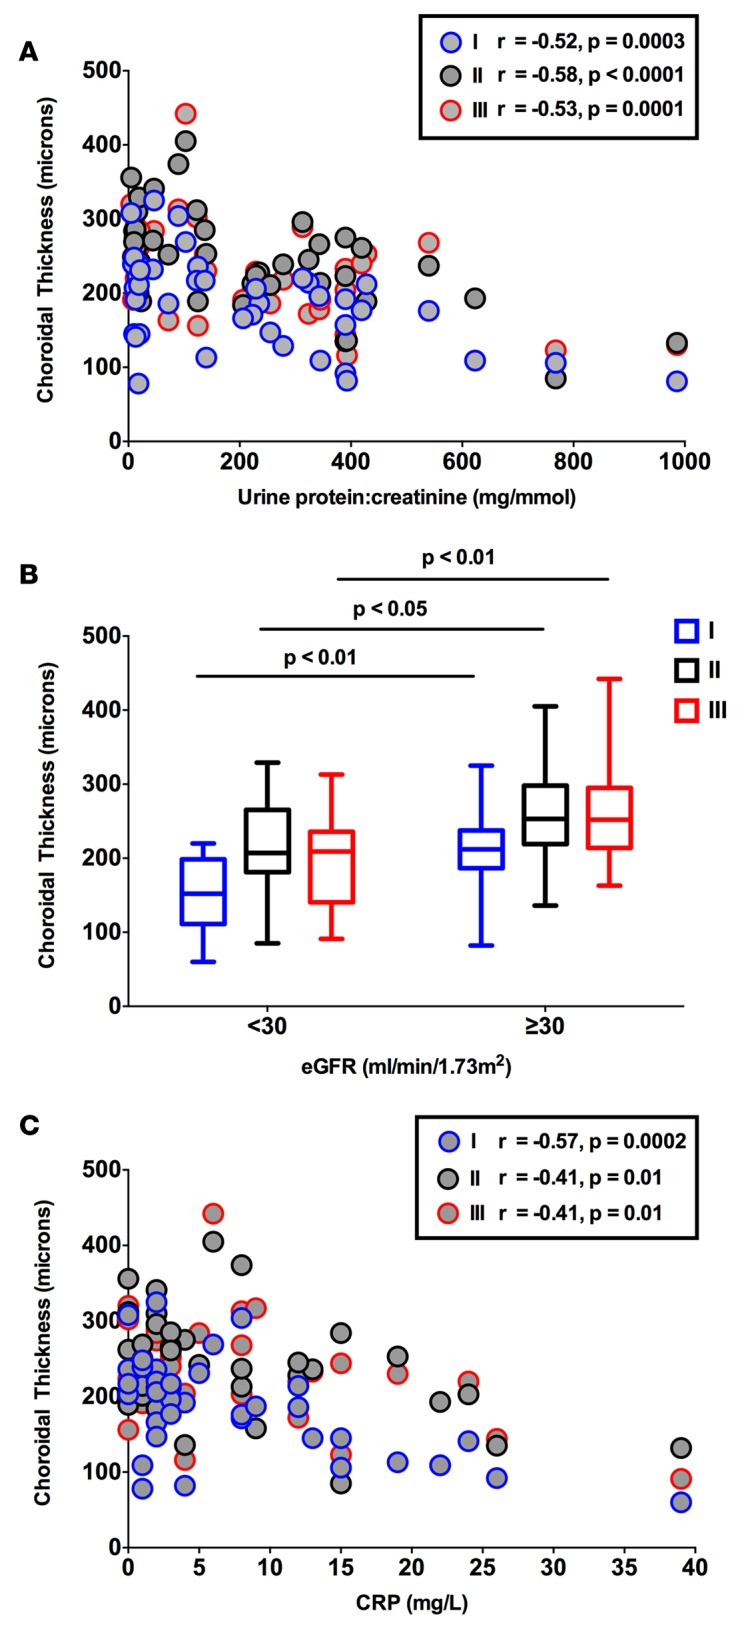
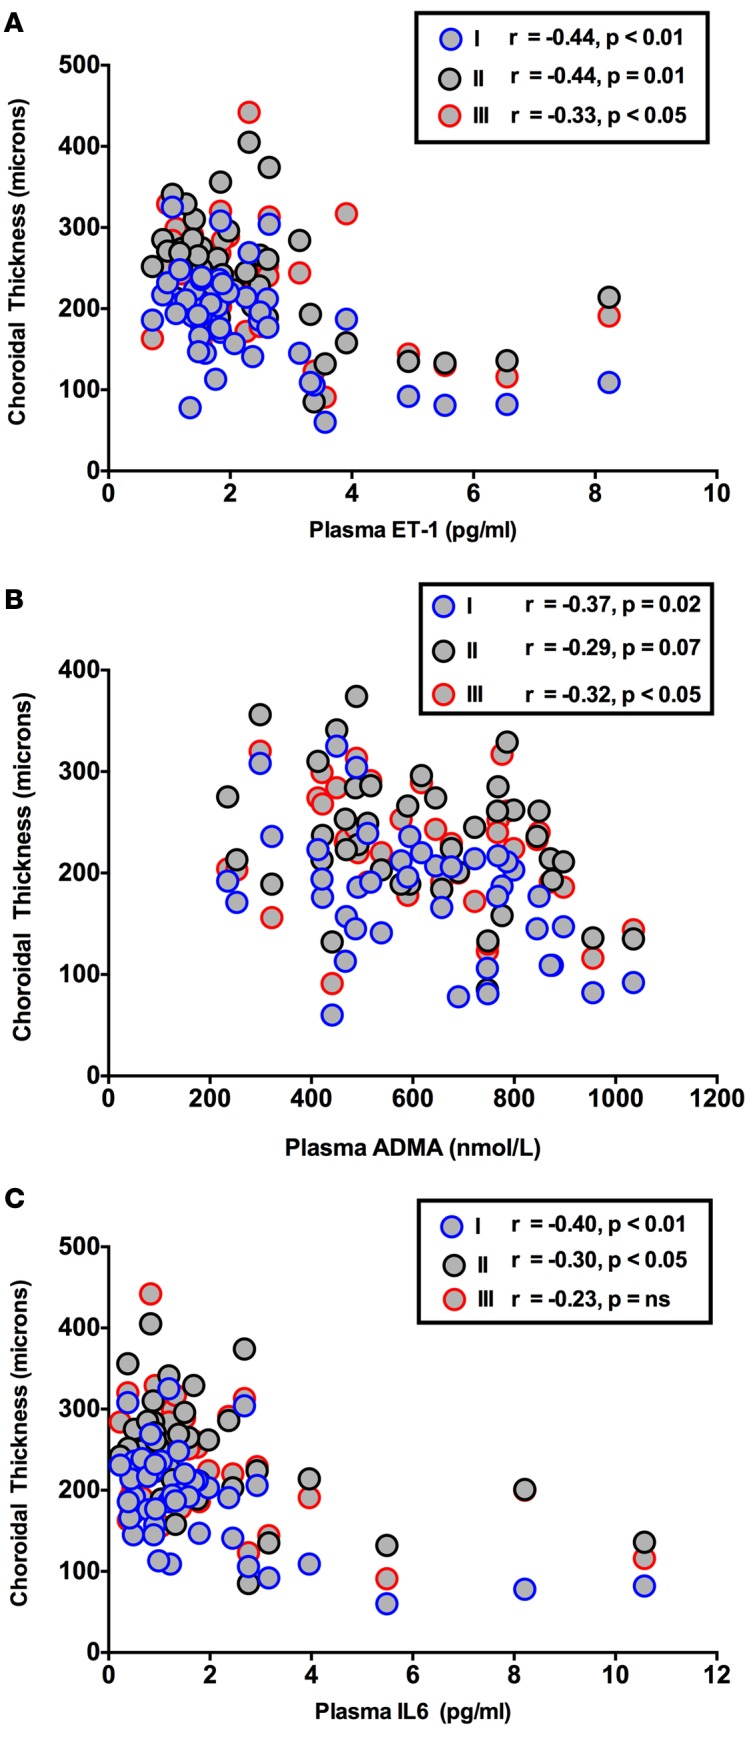
BACKGROUND. Chronic kidney disease (CKD) is strongly associated with cardiovascular disease and there is an established association between vasculopathy affecting the kidney and eye. Optical coherence tomography (OCT) is a novel, rapid method for high-definition imaging of the retina and choroid. Its use in patients at high cardiovascular disease risk remains unexplored. METHODS. We used the new SPECTRALIS OCT machine to examine retinal and retinal nerve fiber layer (RNFL) thickness, macular volume, and choroidal thickness in a prospective cross-sectional study in 150 subjects: 50 patients with hypertension (defined as a documented clinic BP greater than or equal to 140/90 mmHg (prior to starting any treatment) with no underlying cause identified); 50 with CKD (estimated glomerular filtration rate (eGFR) 8-125 ml/min/1.73 m2); and 50 matched healthy controls. We excluded those with diabetes. The same, masked ophthalmologist carried out each study. Plasma IL-6, TNF-α , asymmetric dimethylarginine (ADMA), and endothelin-1 (ET-1), as measures of inflammation and endothelial function, were also assessed. RESULTS. Retinal thickness, macular volume, and choroidal thickness were all reduced in CKD compared with hypertensive and healthy subjects (for retinal thickness and macular volume P < 0.0001 for CKD vs. healthy and for CKD vs. hypertensive subjects; for choroidal thickness P < 0.001 for CKD vs. healthy and for CKD vs. hypertensive subjects). RNFL thickness did not differ between groups. Interestingly, a thinner choroid was associated with a lower eGFR (r = 0.35, P <0.0001) and, in CKD, with proteinuria (r = -0.58, P < 0.001) as well as increased circulating C-reactive protein (r = -0.57, P = 0.0002), IL-6 (r = -0.40, P < 0.01), ADMA (r = -0.37, P = 0.02), and ET-1 (r = -0.44, P < 0.01). Finally, choroidal thinning was associated with renal histological inflammation and arterial stiffness. In a model of hypertension, choroidal thinning was seen only in the presence of renal injury. CONCLUSIONS. Chorioretinal thinning in CKD is associated with lower eGFR and greater proteinuria, but not BP. Larger studies, in more targeted groups of patients, are now needed to clarify whether these eye changes reflect the natural history of CKD. Similarly, the associations with arterial stiffness, inflammation, and endothelial dysfunction warrant further examination. TRIAL REGISTRATION. Registration number at www.clinicalTrials.gov: NCT02132741. SOURCE OF FUNDING. TR was supported by a bursary from the Erasmus Medical Centre, Rotterdam. JJMHvB was supported by a bursary from the Utrecht University. JRC is supported by a Rowling Scholarship. SB was supported by a Wellcome Trust funded clinical research fellowship from the Scottish Translational Medicine and Therapeutics Initiative, and by a Rowling Scholarship, at the time of this work. ND is supported by a British Heart Foundation Intermediate Clinical Research Fellowship (FS/13/30/29994).


Conflict of interest statement

The authors declare that no conflict of interest exists.

Figures

Figure 1
Figure 1. This figure shows the chorioretinal structures en face (left images) and as a cross section (right images).
The Early Treatment Diabetic Retinopathy Study map divides the macula into 9 subfields. A circular grid is centered over the fovea and consists of 3 concentric rings of diameters 1, 3, and 6 mm, respectively. (A) The inner and outer rings are further divided into quadrants: temporal, nasal, superior, and inferior (left; see also Figure 2). Retinal thickness was defined as the area between the internal limiting membrane (ILM) and the hyporeflective line between the retinal pigment epithelium (RPE) and the choriocapillaries (right). (B) Retinal nerve fiber layer thickness was defined as the area bordered in red. (C) Choroidal thickness was measured at 3 locations on the macula: I = 2 mm nasal to the fovea, II = subfoveal, III = 2 mm temporal to the fovea. Scale bars: 200 μm.
Figure 2
Figure 2. Retinal thickness as a function of macular location.
Box-and-whisker plots showing retinal thickness in subjects with hypertension (HT), chronic kidney disease (CKD), and healthy volunteers (HV) across different areas of the macula (see Figure 1A): ON, outer nasal; OS, outer superior; OT, outer temporal; OI, outer inferior; IN, inner nasal; IS, inner superior; IT, inner temporal; II, inner inferior; IC, inner circle. At each of the 4 locations ON, OS, OT, and OI, ****P < 0.0001 for CKD vs. healthy and for CKD vs. hypertensive subjects. At each of the 5 locations IN, IS, IT, II, IC, *P < 0.05 for CKD vs. healthy and for CKD vs. hypertensive subjects. The box-and-whisker plots display the first and third quartiles, with the line within the box representing the median value. The whiskers denote the minimum and maximum values. Thicknesses were examined by 2-way ANOVA, comparing thicknesses between all 3 patient groups at each macular location using Tukey correction for multiple comparisons. n = 50 subjects per group.
Figure 3
Figure 3. Macular volume.
Box-and-whisker plots showing macular volume in subjects with hypertension (HT), chronic kidney disease (CKD), and healthy volunteers (HV). ****P < 0.0001 for CKD vs. healthy and for CKD vs. hypertensive subjects. The box-and-whisker plots display the first and third quartiles, with the line within the box representing the median value. The whiskers denote the minimum and maximum values. Volumes were examined by 1-way ANOVA, comparing thicknesses between all 3 patient groups at each macular location using Tukey correction for multiple comparisons. n = 50 subjects per group.
Figure 4
Figure 4. Retinal nerve fiber thickness vs.
macular location. Box-and-whisker plots showing retinal nerve fiber layer (RNFL) thickness in subjects with hypertension (HT), chronic kidney disease (CKD), and healthy volunteers (HV) across different areas of the macula: T, temporal; TS, temporal-superior; NS, nasal-superior; N, nasal; NI, nasal-inferior; TI, temporal-inferior. PMB, papillo-macular bundle; N/T, nasal-temporal ratio; G, average RNFL thickness. The box-and-whisker plots display the first and third quartiles, with the line within the box representing the median value. The whiskers denote the minimum and maximum values. Thicknesses were examined by 2-way ANOVA, comparing thicknesses between all 3 patient groups at each macular location using Tukey correction for multiple comparisons. n = 50 subjects per group.
Figure 5
Figure 5. Choroidal thickness vs. macular location.
Box-and-whisker plots showing choroidal thickness in subjects with hypertension (HT), chronic kidney disease (CKD), and healthy volunteers (HV) across 3 locations on the macula: I = 2 mm nasal to the fovea, II = subfoveal, III = 2 mm temporal to the fovea. At each of these 3 locations, ***P < 0.001 for CKD vs. healthy and for CKD vs. hypertensive subjects. The box-and-whisker plots display the first and third quartiles, with the line within the box representing the median value. The whiskers denote the minimum and maximum values. Thicknesses were examined by 2-way ANOVA, comparing thicknesses between all 3 patient groups at each macular location using Tukey correction for multiple comparisons. n = 50 subjects per group.
Figure 6
Figure 6. Correlations of choroidal thickness with clinical measures.
Correlation of choroidal thickness (at locations I, II, and III on the macula), with (A) C-reactive protein (CRP) (Pearson’s correlation), (B) estimated glomerular filtration rate (eGFR), and (C) proteinuria (Spearman’s correlation) in patients with chronic kidney disease. eGFR was calculated using the Modification of Diet in Renal Disease (MDRD) equation. Proteinuria was quantified on the basis of a urine total protein/creatinine ratio (P:Cr). A P:Cr of greater than 15 mg/mmol is abnormal and greater than 300 is considered within the nephrotic range. The box-and-whisker plots in B display the first and third quartiles, with the line within the box representing the median value. The whiskers denote the minimum and maximum values. n = 50 subjects per group. Statistically significant differences were assessed with a 2-way ANOVA with a Turkey correction for multiple comparisons
Figure 7
Figure 7. Correlations of choroidal thickness with nontraditional cardiovascular risk factors.
Correlation of choroidal thickness (at locations I, II, and III on the macula), with (A) IL-6, (B) endothelin-1 (ET-1), and (C) asymmetric dimethylarginine (ADMA) in patients with chronic kidney disease. Correlation coefficients are Spearman’s coefficients. n = 50 subjects per group.

References

    1. Lozano R, et al. Global and regional mortality from 235 causes of death for 20 age groups in 1990 and 2010: a systematic analysis for the Global Burden of Disease Study 2010. Lancet. 2012;380(9859):2095–2128. doi: 10.1016/S0140-6736(12)61728-0. - DOI - PMC - PubMed
    1. Lewington S, Clarke R, Qizilbash N, Peto R, Collins R, Prospective Studies Collaboration Age-specific relevance of usual blood pressure to vascular mortality: a meta-analysis of individual data for one million adults in 61 prospective studies. Lancet. 2002;360(9349):1903–1913. doi: 10.1016/S0140-6736(02)11911-8. - DOI - PubMed
    1. Kearney PM, Whelton M, Reynolds K, Muntner P, Whelton PK, He J. Global burden of hypertension: analysis of worldwide data. Lancet. 2005;365(9455):217–223. doi: 10.1016/S0140-6736(05)70151-3. - DOI - PubMed
    1. Meguid El Nahas A, Bello AK. Chronic kidney disease: the global challenge. Lancet. 2005;365(9456):331–340. - PubMed
    1. Levey AS, et al. Controlling the epidemic of cardiovascular disease in chronic renal disease: what do we know? What do we need to learn? Where do we go from here? National Kidney Foundation Task Force on Cardiovascular Disease. Am J Kidney Dis. 1998;32(5):853–906. doi: 10.1016/S0272-6386(98)70145-3. - DOI - PubMed

Publication types

Associated data