. 2016 Dec 8;1(20):e90558.
doi: 10.1172/jci.insight.90558.

Single-cell RNA sequencing identifies diverse roles of epithelial cells in idiopathic pulmonary fibrosis

Affiliations

Single-cell RNA sequencing identifies diverse roles of epithelial cells in idiopathic pulmonary fibrosis

Yan Xu et al. JCI Insight. .

Abstract

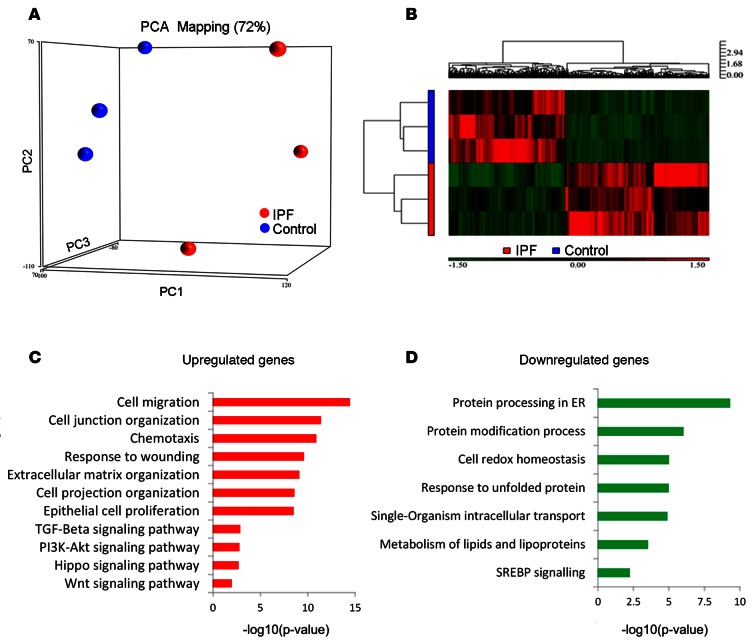
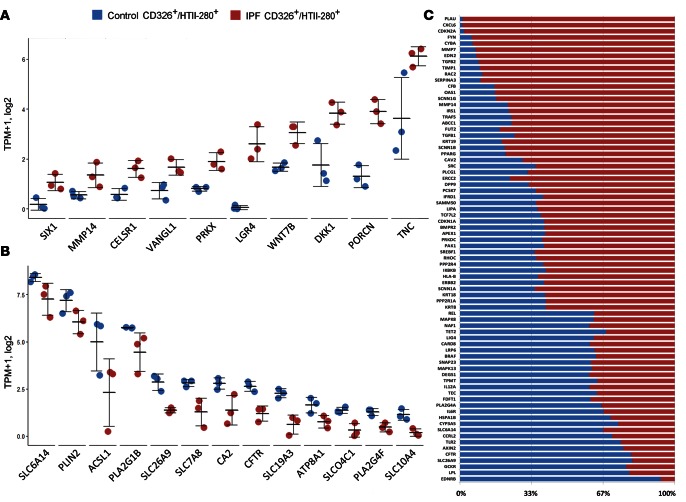
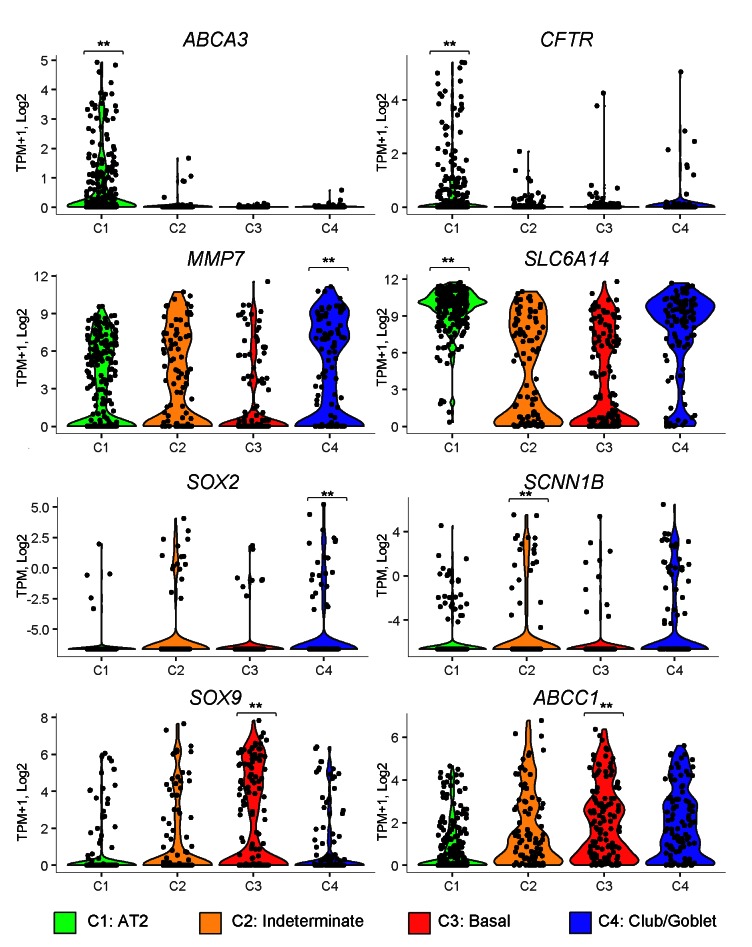
Idiopathic pulmonary fibrosis (IPF) is a lethal interstitial lung disease characterized by airway remodeling, inflammation, alveolar destruction, and fibrosis. We utilized single-cell RNA sequencing (scRNA-seq) to identify epithelial cell types and associated biological processes involved in the pathogenesis of IPF. Transcriptomic analysis of normal human lung epithelial cells defined gene expression patterns associated with highly differentiated alveolar type 2 (AT2) cells, indicated by enrichment of RNAs critical for surfactant homeostasis. In contrast, scRNA-seq of IPF cells identified 3 distinct subsets of epithelial cell types with characteristics of conducting airway basal and goblet cells and an additional atypical transitional cell that contributes to pathological processes in IPF. Individual IPF cells frequently coexpressed alveolar type 1 (AT1), AT2, and conducting airway selective markers, demonstrating "indeterminate" states of differentiation not seen in normal lung development. Pathway analysis predicted aberrant activation of canonical signaling via TGF-β, HIPPO/YAP, P53, WNT, and AKT/PI3K. Immunofluorescence confocal microscopy identified the disruption of alveolar structure and loss of the normal proximal-peripheral differentiation of pulmonary epithelial cells. scRNA-seq analyses identified loss of normal epithelial cell identities and unique contributions of epithelial cells to the pathogenesis of IPF. The present study provides a rich data source to further explore lung health and disease.


Conflict of interest statement

The authors have declared that no conflict of interest exists.

Figures

Figure 1
Figure 1. Heatmap, principal component analysis, and predicted function in sorted normal and IPF epithelial cells.
EPCAM+ (CD326+) and HTII-280+ epithelial cells from control and IPF donors were isolated from peripheral lung tissue by FACS and subjected to RNA sequencing (RNA-seq). (A) Principal component analysis (PCA) RNA-seq data from IPF and control donors (n = 3 per group) shows the primary separation of samples by disease status. (B) Heatmap represents 2D hierarchical clustering of genes and samples and shows differentially expressed genes in IPF versus control samples. (C) Functional enrichment of predicted biological processes and genes induced in IPF is shown. (D) Functional enrichment of predicted biological processes and genes suppressed in IPF is shown. x axis represents the –log10 transformed enrichment P value
Figure 2
Figure 2. Representative genes and their relative expression in Control-CD326/HTII-280 versus IPF CD326/HTII-280 cell populations.
Genes involved in (A) “branching morphogenesis” and Wnt signaling and (B) “anion transport” were induced and suppressed in IPF epithelial cells, respectively. RNA sequencing data from IPF and control donors (n = 3 per group); data are presented in dot plot with mean ± SEM. (C) Genes associated with fibrosis, pulmonary fibrosis, and idiopathic pulmonary fibrosis were compiled from the disease-centered database HuGE Navigator (ref. 25) and OMIM (http://www.omim.org/). The overlap between the known fibrosis genes and genes induced or suppressed in IPF HTII-280 was identified. Relative expression of known fibrosis-associated transcripts in control and IPF CD326/HTII-280–sorted cells was calculated as shown in the bar graph. The portion of fibrosis related genes in control is noted in blue, and IPF in red.
Figure 3
Figure 3. Single-cell RNA sequencing analysis from human IPF and normal lung epithelial cells.
CD326+ epithelial cells were isolated from peripheral lung tissues by FACS as described in Methods, followed by single-cell isolation using Fluidigm C1 system and RNA sequencing. (A) Hierarchical clustering and principal component analysis (PCA) of 540 single cells from control (n = 3) and IPF patients (n = 6) reveals 4 major cell types (C1–C4), termed as normal AT2 (C1, green), indeterminate (C2, yellow), basal (C3, red), and club/goblet (C4, blue) cells. Single cells are colored by cluster on a 3D space. (B) Heatmap represents the expression of distinct RNAs that identify each of the 4 cell types. (C) Hierarchical clustering of all IPF and control cells using differentially expressed genes involved in epithelial proliferation (GO:0050673), “response to cytokines” (GO:0034097), and “response to growth factors” (GO:0034097) is shown. Minimum expression values were set to 0.01 TPM. Genes (n = 9,154) with specificity >0.7 and with TPM >1 in at least 10 cells in at least 6 samples were selected for hierarchical clustering using Z score–transformed expression.
Figure 4
Figure 4. Single-cell RNA analysis identifies altered epithelial gene expression and epithelial cell types in IPF.
(A) Single cells from human IPF (n = 6) and donor (n = 3) distal lung (CD326+) were prepared using the Fluidigm C1 system. RNA was prepared and analyzed from a total of 325 single cells from IPF and 215 cells from donor lungs. Shown are lung epithelial cell markers: EPCAM and CDH1; alveolar type 1 cell markers: AGER and HOPX; alveolar type 2 cell markers: SFTPC, SLC34A2, and ABCA3; proximal lung epithelial cell markers: SOX2, PAX9, TP63, KRT5, KRT14, MUC5B, and SCGB1A1. Expression values were measured in TPM and square root (sqrt) normalized. Cells are shown in solid colors if the expressions of the markers were greater than 1 (TPM). (B) MUC5B, PAX9, and SOX2 were selectively expressed in subsets of IPF cells (MUC5B: n = 24, PAX9: n = 65; SOX2: n = 24) but not present in C1 control cells. Representative genes clustering with MUC5B, PAX9, and SOX2 in IPF cells are shown in the heatmaps. Equal numbers of control cells were randomly selected. IPF cells expressed a diversity of conducting airway epithelial markers not present in control cells, the latter expressing RNAs characteristic of AT2 cells. (C) Only 9 of 325 IPF cells clustered with control cells, the heatmap indicating “AT2”-like expression patterns; however, these 9 normal IPF cells also coexpressed some of the of IPF-associated disease markers. Expression data (TPM) were log10 transformed.
Figure 5
Figure 5. Expression of predicted IPF marker genes in 4 epithelial cell types from IPF and control single-cell samples.
Violin plots show the expression of the gene markers in all 540 cells from the 4 cell types. Cell types are color coded. Green: AT2 (n = 219); orange: indeterminate (n = 91); red: basal (n = 131); blue: club/goblet (n = 101). One-tailed Welch’s t test was used to identify cell type–specific gene markers. **P < 0.05.
Figure 6
Figure 6. Expression of altered KEGG pathways in human IPF and control single cells.
(A) The heatmap shows the top 25 pathways and differentially expressed genes identified using a 1-tailed Welch’s t test of gene expression between the control AT2 cells (C1) and IPF cell clusters (C2, C3, and C4) using the following criteria: P < 0.01, expressed (TPM ≥1) in at least 80% of cell type with induced gene expression. KEGG pathways enriched or suppressed in IPF epithelium were determined by the following criteria: (a) at least 5 genes in the pathway were expressed (TPM ≥1), (b) at least 30% of expressed genes were differentially expressed, and (c) the ratio between the number of C1 differentially expressed genes and the number of IPF differentially expressed genes in the pathway was ≥1.5 or ≤0.67. 4). Pathways were ranked based on the ratios. The expression of a pathway in a cell was measured by the average expression (TPM + 1, log2 transformed) of differentially expressed genes associated in the pathway. Pathways were clustered using hierarchical clustering analysis with Spearman’s correlation–based distance measure and complete linkage. Cancer- or disease-related pathways were excluded. (B) Representative TGF-β signaling pathway genes (BMP1, BMPR1B, INHBA, INHBB, TGFBR1, TGFB1, TGFB2, and SMAD3) in control (n = 215), IPF (n = 316), and relatively normal IPF cells that clustered with control AT2 cells (n = 9). Data are presented as dot plot with mean ± SEM. P values were determined by Student’s t test. **P < 0.05.
Figure 7
Figure 7. Immunofluorescence confocal microscopy identifies atypical epithelial cell differentiation in IPF.
(A) Peripheral samples of normal and IPF lung tissue were stained for epithelial cell markers used to identify AT2 (HTII-280 and ABCA3), AT1 (HOPX), ciliated (TUBA4A), goblet (MUC5B) cells. Yellow staining indicates coexpression of the proteins. HTII-280 and ABCA3, normally restricted to peripheral/alveolar epithelial cells in normal lung, were expressed in IPF lesions; cystic lesions were variably lined by hyperplastic AT2 cells that stained for ABCA3 in close proximity to MUC5B (goblet) or TUBA4A (ciliated) stained cells. Abnormally shaped epithelial cells variably staining for HOPX, ABCA3, and HTII-280 were characteristic of IPF tissues that generally lacked normal squamous AT1 cells. (B) Epithelial cells expressing conducting airway and alveolar epithelial cell markers were found in close proximity in the IPF lesions (e.g., TP63, KRT14 and MUC5B) and (ABCA3 and HOPX) respectively are shown. Figures are representative of n = 3–5 control and 9 IPF samples, except for KRT14 (n = 3). Images were obtained at ×10 magnification (scale bars: 200 μm). Insets in yellow boxes are at ×60 magnification
Figure 8
Figure 8. Bioprocesses and gene networks influenced by IPF.
Single-cell RNA-sequencing analysis of human IPF and control epithelial cells identified 4 distinct lung epithelial cell subtypes. Cell-specific gene signatures and associated pathways, bioprocesses, and predicted driving forces (key regulators) of each cell type are shown. The analysis predicts crosstalk among individual cell types at the level of upstream regulators, bioprocesses, and genes, as illustrated in this summary chart.

References

    1. Blackwell TS, et al. Future directions in idiopathic pulmonary fibrosis research. An NHLBI workshop report. Am J Respir Crit Care Med. 2014;189(2):214–222. doi: 10.1164/rccm.201306-1141WS. - DOI - PMC - PubMed
    1. Goodwin AT, Jenkins G. Molecular endotyping of pulmonary fibrosis. Chest. 2016;149(1):228–237. doi: 10.1378/chest.15-1511. - DOI - PubMed
    1. Steele MP, Schwartz DA. Molecular mechanisms in progressive idiopathic pulmonary fibrosis. Annu Rev Med. 2013;64:265–276. doi: 10.1146/annurev-med-042711-142004. - DOI - PubMed
    1. Barkauskas CE, Noble PW. Cellular mechanisms of tissue fibrosis. 7. New insights into the cellular mechanisms of pulmonary fibrosis. Am J Physiol, Cell Physiol. 2014;306(11):C987–C996. doi: 10.1152/ajpcell.00321.2013. - DOI - PMC - PubMed
    1. Camelo A, Dunmore R, Sleeman MA, Clarke DL. The epithelium in idiopathic pulmonary fibrosis: breaking the barrier. Front Pharmacol. 2014;4:173. - PMC - PubMed

Publication types

Substances