. 2016 Jul 14;1(1):aaf8759.
doi: 10.1126/sciimmunol.aaf8759.

Donor exosomes rather than passenger leukocytes initiate alloreactive T cell responses after transplantation

Affiliations

Donor exosomes rather than passenger leukocytes initiate alloreactive T cell responses after transplantation

Jose Marino et al. Sci Immunol. .

Abstract

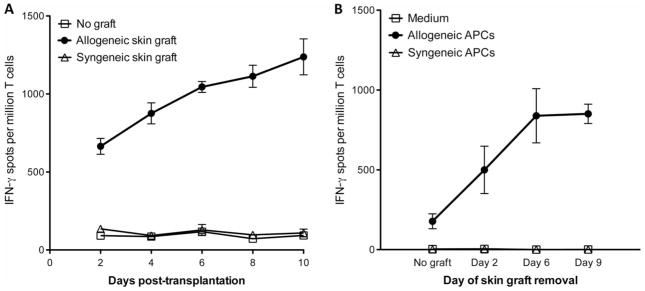
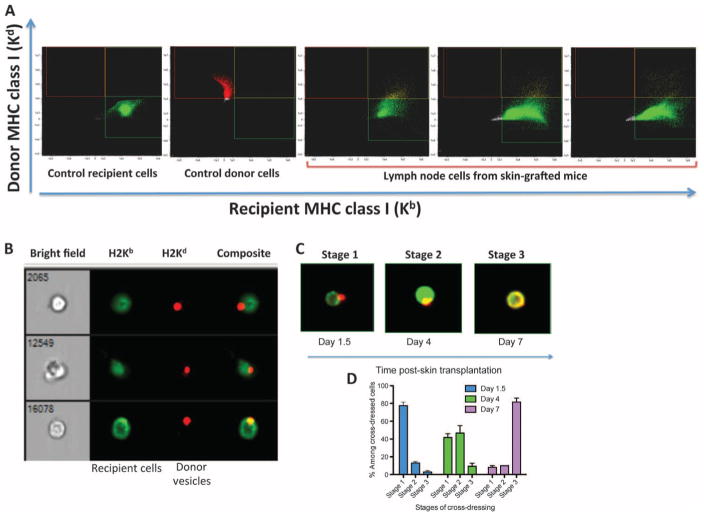
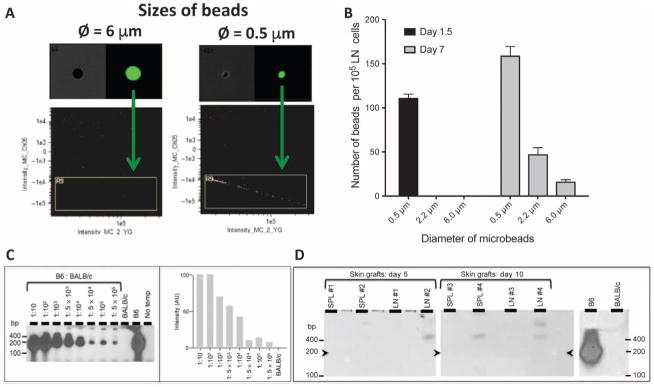
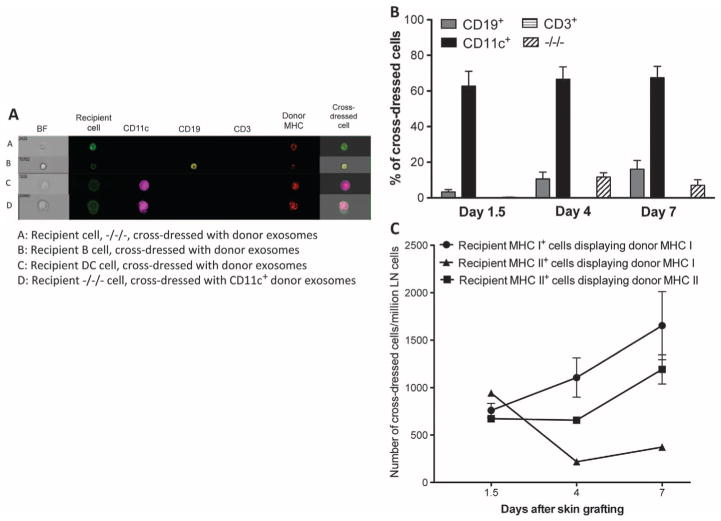
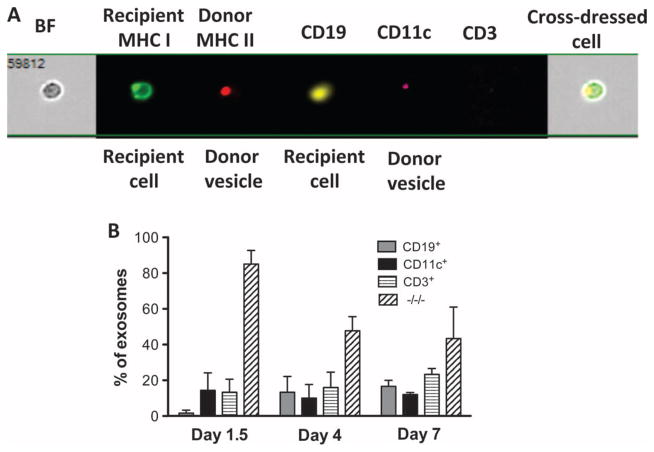
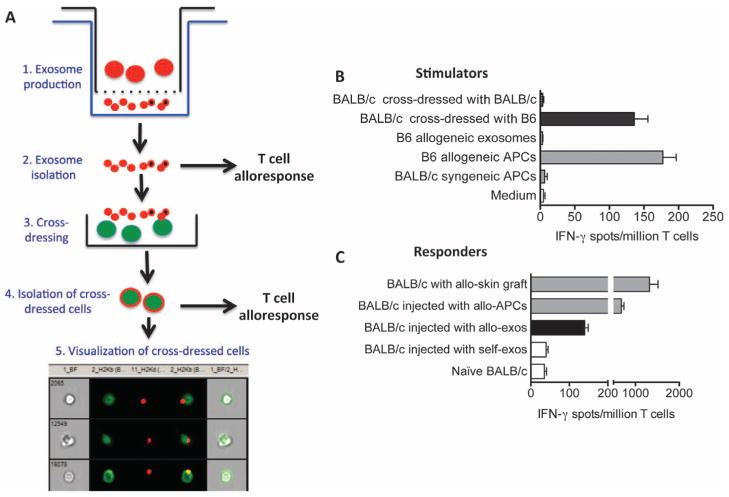
Transplantation of allogeneic organs and tissues represents a lifesaving procedure for a variety of patients affected with end-stage diseases. Although current immunosuppressive therapy prevents early acute rejection, it is associated with nephrotoxicity and increased risks for infection and neoplasia. This stresses the need for selective immune-based therapies relying on manipulation of lymphocyte recognition of donor antigens. The passenger leukocyte theory states that allograft rejection is initiated by recipient T cells recognizing donor major histocompatibility complex (MHC) molecules displayed on graft leukocytes migrating to the host's lymphoid organs. We revisited this concept in mice transplanted with allogeneic skin, heart, or islet grafts using imaging flow cytometry. We observed no donor cells in the lymph nodes and spleen of skin-grafted mice, but we found high numbers of recipient cells displaying allogeneic MHC molecules (cross-dressed) acquired from donor microvesicles (exosomes). After heart or islet transplantation, we observed few donor leukocytes (100 per million) but large numbers of recipient cells cross-dressed with donor MHC (>90,000 per million). Last, we showed that purified allogeneic exosomes induced proinflammatory alloimmune responses by T cells in vitro and in vivo. Collectively, these results suggest that recipient antigen-presenting cells cross-dressed with donor MHC rather than passenger leukocytes trigger T cell responses after allotransplantation.


Conflict of interest statement

The authors declare that they have no competing financial interests.

Figures

Fig. 1
Fig. 1. Kinetics of T cell alloresponses after transplantation of allogeneic skin grafts
(A) C57Bl/6 (B6, H-2b) mice received a skin graft from a fully allogeneic BALB/c (H-2d) or a syngeneic B6 mouse. At different time points after transplantation, recipient LN T cells were isolated and cultured in vitro for 48 hours with donor irradiated spleen cells. (B) B6 mice were transplanted with a skin patch from a BALB/c mouse. Skin allografts were removed at different time points after transplantation. Recipient LN T cells were isolated at day 10 after transplantation and cultured for 48 hours with medium or with either allogeneic (BALB/c) or syngeneic (B6) spleen cells (APCs). In (A) and (B), the frequencies of IFN-γ–producing cells were measured by ELISPOT. The results are expressed as numbers of IFN-γ spots per million T cells ± SD (triplicate wells) isolated from mouse LNs collected and pooled from three to five mice. The results are representative of three separate experiments. The P values obtained with analysis of variance (ANOVA) comparing T cell responses after syngeneic versus allogeneic graft (A) or APCs (B) were P = 0.0005 and P = 0.0001.
Fig. 2
Fig. 2. Detection of donor leukocytes in LNs of skin-grafted mice
LN cells (ipsilateral axillary and brachial LNs) from naïve B6 and BALB/c mice as well as B6 mice recipient of a BALB/c skin allograft were collected at different time points after transplantation. The cells were stained with anti-MHC class I Kb antibodies and anti-MHC class I Kd bound to FITC and allophycocyanin, respectively. The presence of recipient (Kb+) and donor (Kd+) cells was assessed using flow imaging with low-speed fluidics at ×40 magnification. Data analysis was performed using IDEAS 6.1 image processing and statistical analysis software (Amnis, EMD Millipore). (A) Plots obtained with control recipient cells, control donor cells, and cells from three different transplanted mice tested at day 2 after transplantation. The results are representative of eight mice per group tested in two separate experiments. (B) Representative microscopic analysis of double-positive cells (Kb+/Kd+) observed in (A). The bright field represents the actual optical image of the cells (×40 magnification). The other columns show the fluorescence of cells. (C) Representative images of double-positive cells (stages 1 to 3) obtained at different time points after transplantation. Stage 3 corresponds to recipient leukocytes cross-dressed with donor MHC. (D) Percentages of recipient leukocytes cross-dressed with donor MHC (stage 3) among double-positive cells found in LNs of skin-grafted mice examined individually at different time points after transplantation ± SEM. The results are representative of six mice tested individually at each time point. P values using unpaired Student’s t test: stage 1: d1.5 versus d4, P = 0.0001; d1.5 versus d7, P = 0.0001; d4 versus d7, P = 0.0022; stage 2: d1.5 versus d4, P = 0.0001; d1.5 versus d7, P = 0.0051; d4 versus d7, P = 0.0001; stage 3: d1.5 versus d4, P = 0.1701 [not significant (NS)]; d1.5 versus d7, P = 0.0001; d4 versus d7, P = 0.0001.
Fig. 3
Fig. 3. Detection of donor mRNA in lymphoid organs of skin-grafted mice and trafficking of microbeads injected in skin grafts
Fluorescent beads of either subcellular size (diameter, 0.5 and 2.2 μm) or of cellular size (diameter, 6 μm) were injected into the bed site of syngeneic skin grafts placed in B6 mice. The presence of beads in draining LNs (ipsilateral axillary and brachial LNs) was evaluated at different time points after transplantation. (A) Representative plots obtained at 36 hours after transplantation with beads of either 6-μm or 0.5-μm diameter. (B) Distribution of beads of different diameters observed in LNs of skin-grafted mice at 36 hours or day 7 after transplantation. The results are representative of six to seven mice tested individually ± SEM. P values using unpaired Student’s t test: d1.5 size 0.5 μm versus 2.2 μm, P = 0.0001; d1.5 size 0.5 μm versus 6 μm, P = 0.0001; d1.5 size 2.2 μm versus 6 μm, P = 1 (NS); d7 size 0.5 μm versus 2.2 μm, P = 0.0001; d7 size 0.5 μm versus 6 μm, P = 0.0001; d7 size 2.2 μm versus 6 μm, P = 0.0026. (C) Left panel: Combinations of 1 × 10⁵ splenocytes from Kb+ (B6) and Kb− (BALB/c) were prepared according to indicated B6-to-BALB/c ratios. RT-PCR was performed on complementary DNA (cDNA) derived from 250 ng of individual RNA. The amplified products were run on agarose gels and transferred on nitrocellulose filters that were hybridized with a 32P-labeled Kb-specific probe lighting up a 191–base pair (bp)–long fragment (arrowheads). Controls were BALB/c and B6 cDNA alone and no cDNA (no template). Right panel: Quantitative scans of the autoradiograph from the left panel. Signal intensities were corrected according to the amount of template loaded (estimated by RT-PCR amplification of the actin genes; not shown). Signal intensities are represented in arbitrary units (AU). (D) Kb-specific RT-PCR analysis was conducted as in (C) on splenocytes (SPL) and LNs from BALB/c mice, recipient of allogeneic B6 skin grafts. Cells were isolated at days 5 and 10 after transplantation. Positive and negative controls were splenocytes from B6 and BALB/c mice, respectively. The three sections presented were on the same series of gels run under identical conditions.
Fig. 4
Fig. 4. Phenotype of recipient cells cross-dressed with donor MHC after skin transplantation
LN cells (ipsilateral axillary and brachial LNs) from naïve B6 and BALB/c mice as well as B6 mice recipient of a BALB/c skin allograft were collected at different time points after transplantation. Recipient cells (H-2Kb+) cross-dressed with donor MHC class I Kd were stained with the following fluorochrome-bound antibodies: anti–CD3–Pacific Blue (for T cells), anti–CD19-PE (phycoerythrin) (for B cells), and anti–CD11c-PECy7 (for DCs). (A) Representative images of double-positive cells (Kb+/Kd+) labeled with these antibodies. The bright field (BF) represents the actual optical image of the cells (×40 magnification). (B) Frequency of each leukocyte subset among cross-dressed cells. (C) Frequencies of recipient MHC class I+ or class II+ cells cross-dressed with either donor MHC class I (Kb) or II (Ab) per million LN cells. The results are representative of five mice per group, tested individually at each time point. P values using ANOVA: d1.5, recipient MHC II + donor MHC I versus recipient MHC II + donor MHC II, P = 0.5546 (NS); d4, recipient MHC II + donor MHC I versus recipient MHC II + donor MHC II, P = 0.0001; d7, recipient MHC II + donor MHC I versus recipient MHC II + donor MHC II, P = 0.0001.
Fig. 5
Fig. 5. Phenotypic characterization of donor vesicles present in LNs of skin-grafted mice
LN cells (ipsilateral axillary and brachial LNs) from B6 mice recipient of a BALB/c skin allograft were collected at different time points after transplantation. The donor vesicles were stained with anti-recipient MHC class I (anti-Kb bound to FITC), anti-donor MHC class II (anti-Ad bound to APC), anti–CD19-PE, anti–CD11c-PRCy7, and anti–CD3–Pacific Blue antibodies. (A) Representative images of cells and donor vesicles present on cross-dressed cells labeled with these antibodies. The bright field represents the actual optical image of the cells (×40 magnification). (B) Frequencies of donor vesicles displaying CD19, CD11C, or CD3 or none of these markers measured at different time points after skin grafting. The results are representative of five mice tested individually at each time point. The P values (using ANOVA) were as follows: d1, P = 0.0001; d4, P = 0.0004; and d7, P = 0.031.
Fig. 6
Fig. 6. Activation of T cells by allogeneic exosomes and cells cross-dressed with allogeneic MHC
(A) Procedure used to generate allogeneic exosomes and cells cross-dressed with allogeneic MHC molecules. Steps 1 and 2: Exosomes were isolated and quantified (using ExoQuick kits) from the lower compartments of Transwell plates whose upper compartments contained B6 spleen cells stimulated for 4 to 5 days with CD40 and interleukin-4 (IL-4). Step 3: To obtain cross-dressed cells, BALB/c spleen cells (15 × 106 cells/ml) were cultured for 5 days along with B6-derived exosomes (1.9 × 10⁹). Step 4: BALB/c cells cross-dressed with allogeneic H-2b exosomes were isolated using an affinity column composed of beads coated with anti–Kb-PE antibodies. Step 5: The number and purity of cross-dressed cells were evaluated using imaging flow cytometry. (B) In vitro activation of T cells with exosomes or cross-dressed cells. BALB/c T cells (5 × 10⁵ cells per well) were cultured with B6 allogeneic exosomes or BALB/c cells cross-dressed with allogeneic (H-2b) or control syngeneic (H-2d) MHC (5 × 10⁵ cells per well) for 48 hours. The frequencies of activated T cells producing IFN-γ were measured using ELISPOT. (C) BALB/c mice were injected intraperitoneally with allogeneic (B6) or syngeneic (self, BALB/c) exosomes (2 × 10⁸ to 2 × 10⁹ vesicles). Fourteen days later, spleen T cells from these mice as well as control naïve mice were collected and stimulated in vitro with irradiated allogeneic B6 APCs for 72 hours. The frequency of T cells secreting IFN-γ was measured using ELISPOT. BALB/c mice recipient of a B6 skin graft or injected with B6 spleen cells were tested as positive controls. In (B) and (C), the results are expressed as the number of IFN-γ–producing spots per million T cells ± SD obtained from 13 mice tested individually. The P values obtained with unpaired t test comparing T cell responses after syngeneic versus allogeneic exosome stimulation for (B) and (C) were P = 0.0003 and P = 0.0029, respectively.

Similar articles

Cited by

References

    1. Lechler R, Lombardi G. Structural aspects of allorecognition. Curr Opin Immunol. 1991;3:715–721. - PubMed
    1. Suchin EJ, Langmuir PB, Palmer E, Sayegh MH, Wells AD, Turka LA. Quantifying the frequency of alloreactive T cells in vivo: New answers to an old question. J Immunol. 2001;166:973–981. - PubMed
    1. Benichou G, Takizawa PA, Olson CA, McMillan M, Sercarz EE. Donor major histocompatibility complex (MHC) peptides are presented by recipient MHC molecules during graft rejection. J Exp Med. 1992;175:305–308. - PMC - PubMed
    1. Benichou G, Fedoseyeva E, Lehmann PV, Olson CA, Geysen HM, McMillan M, Sercarz EE. Limited T cell response to donor MHC peptides during allograft rejection. Implications for selective immune therapy in transplantation. J Immunol. 1994;153:938–945. - PubMed
    1. Liu Z, Sun YK, Xi YP, Hong B, Harris PE, Reed EF, Suciu-Foca N. Limited usage of T cell receptor V beta genes by allopeptide-specific T cells. J Immunol. 1993;150:3180–3186. - PubMed

LinkOut - more resources