

Review
doi: 10.1039/c6cs00313c.
Integrating recognition elements with nanomaterials for bacteria sensing
Affiliations
- PMID: 27942636
- PMCID: PMC5339056
- DOI: 10.1039/c6cs00313c
Item in Clipboard
Review
Integrating recognition elements with nanomaterials for bacteria sensing
Chem Soc Rev.
.
Abstract
Pathogenic bacterial contamination is a major threat to human health and safety. In this review, we summarize recent strategies for the integration of recognition elements with nanomaterials for the detection and sensing of pathogenic bacteria. Nanoprobes can provide sensitive and specific detection of bacterial cells, which can be applied across multiple applications and industries.
Figures
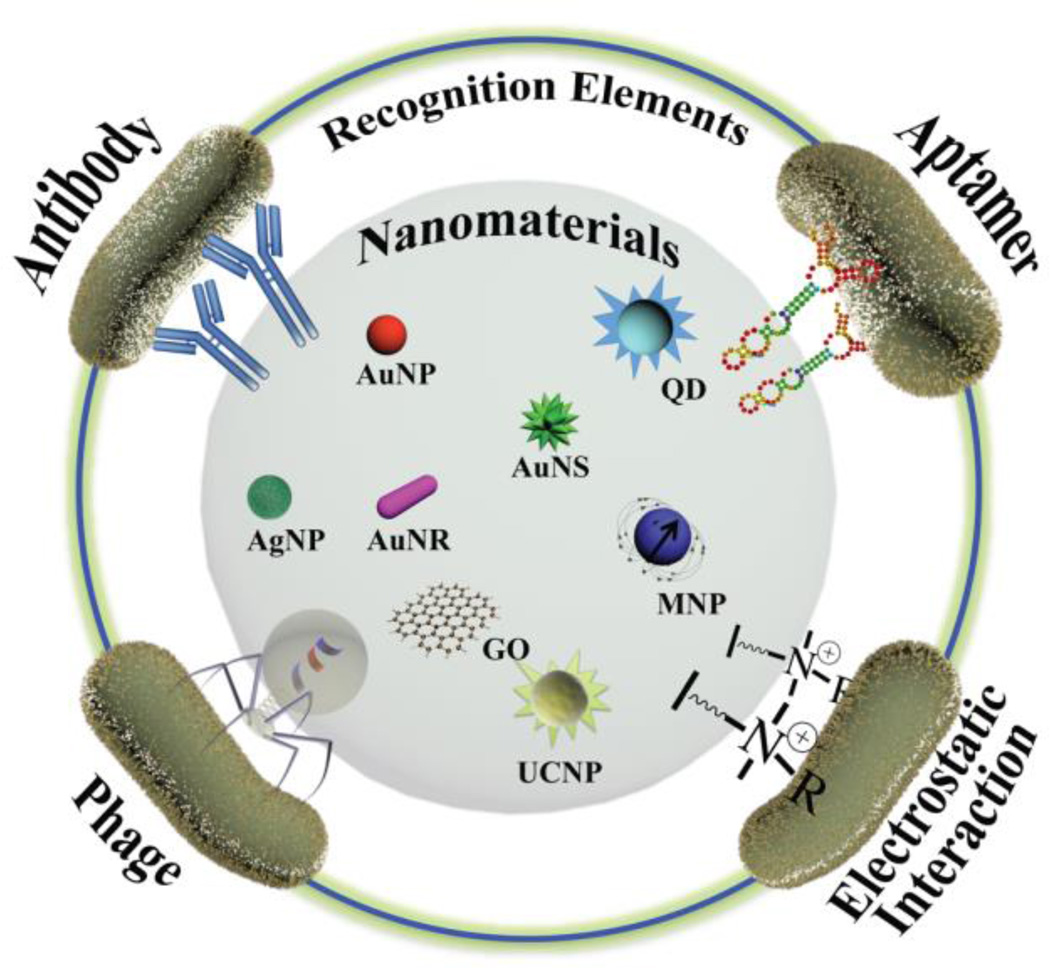
Schematic representation showing the fabrication of recognition elements on nanomterials as bacteria-selective nanoprobes to detect and sense bacterial cells.
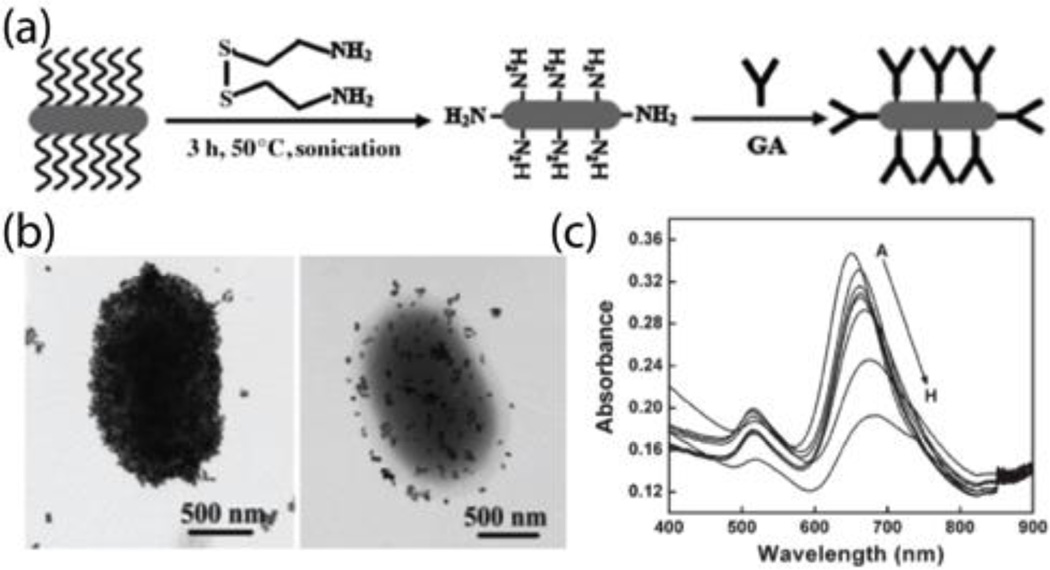
(a) Schematic representation of the fabrication of anti-E. coli antibodies-conjugated AuNR nanoprobes. (b) TEM images of the specific binding of anti-E. coli antibodies-conjugated AuNR nanoprobes with E. coli cells with different coverage. (c) UV-vis absorbance spectra of anti-E. coli antibodies-conjugated AuNRs with various concentrations of E. coli cells (from 102 to 106 CFU·mL−1). Reproduced with permission from ref. . Copyright 2008, Wiley-VCH Verlag GmbH & Co. KGaA, Weinheim.
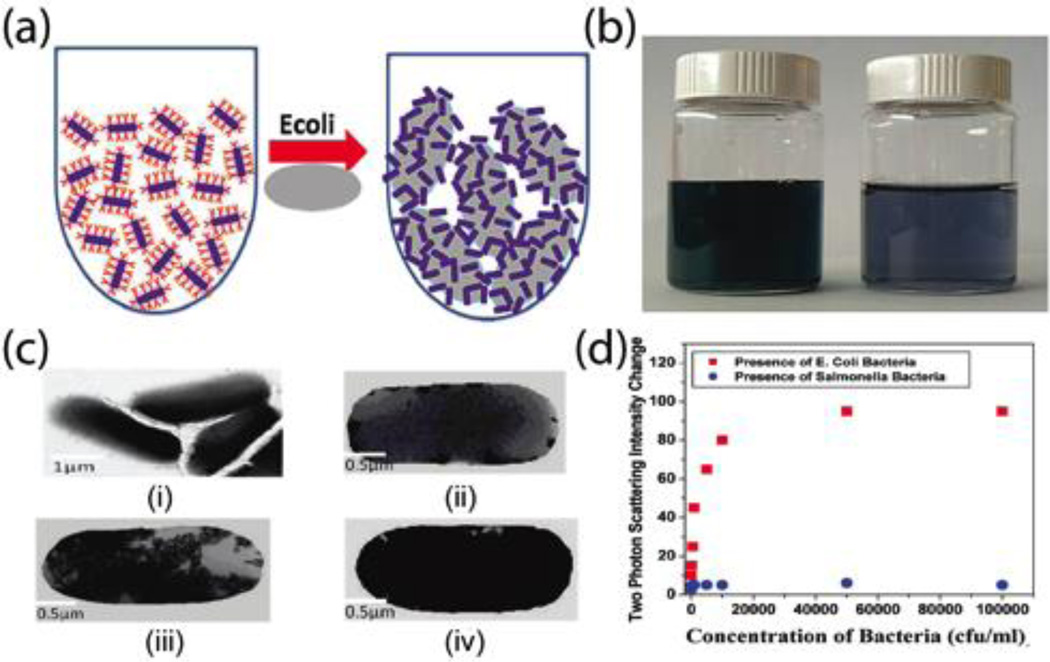
(a) Schematic representation of colorimetric detection of E. coli bacterial cells using anti-E. coli antibody-conjugated gold nanorods. (b) Photograph of the color changes before and after adding E. coli bacterial cells. (c) TEM images of aggregation of anti-E. coli antibody-conjugated AuNRs on the surface of E. coli bacterial cells with various concentrations (i. control; ii. 102; iii. 8 × 10⁴; and iv. 107 CFU·mL−1) (d) Plot of two photon scattering intensity change against bacteria concentrations. Reproduced with permission from ref. . Copyright 2009, American Chemical Society.
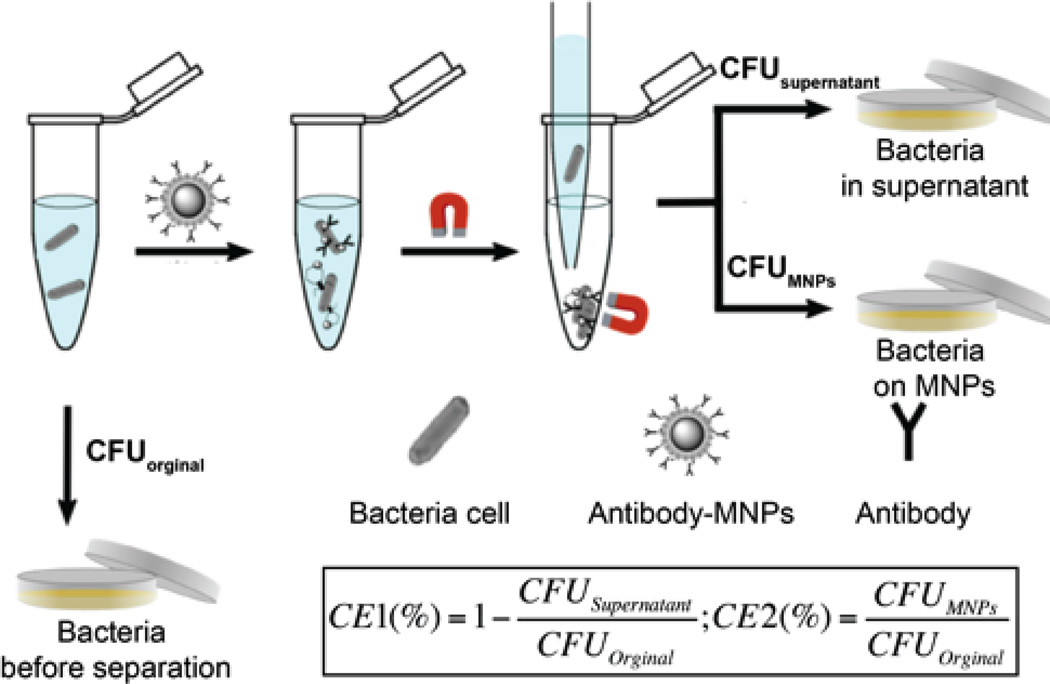
Magnetic separation of bound bacteria on the magnetic nanoprobes from unbound bacteria in the supernatant. Where, CFUoriginal is the total number of bacterial cells present in the initial sample, CFUsupernatant is the number of bacterial cells which remained unbound to the magnetic nanoprobes, and CFUMNPs is the number of bacterial cells bound to magnetic nanoprobes. Reproduced with permission from ref. . Copyright 2015, Royal Society of Chemistry.
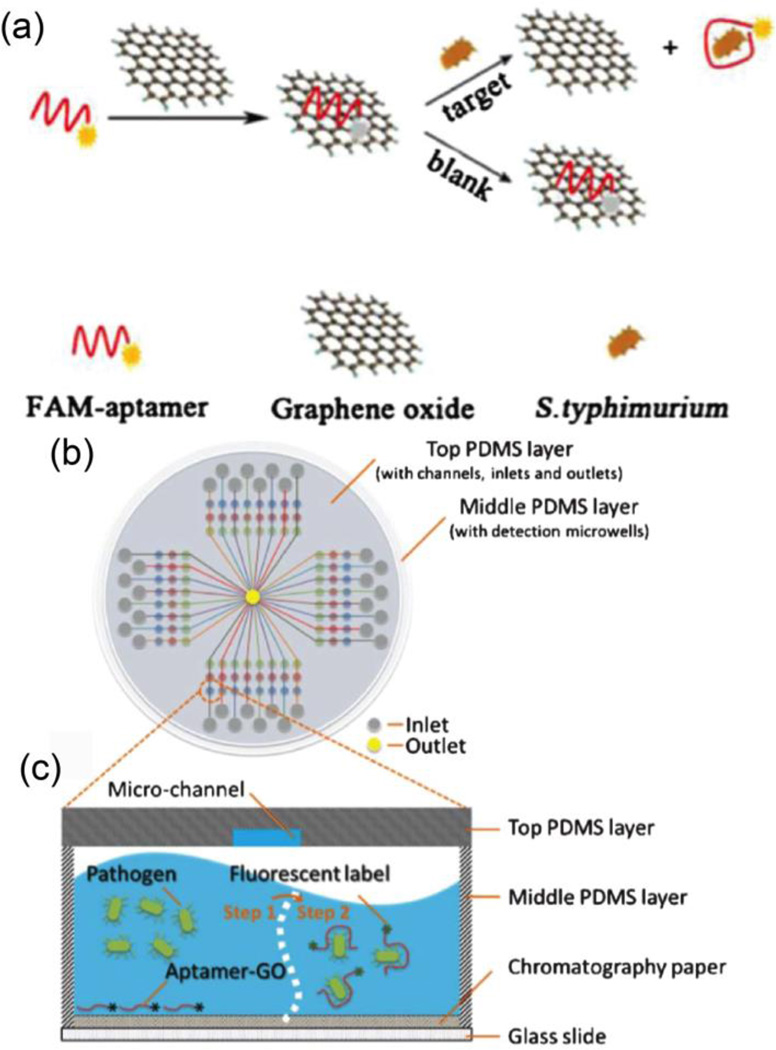
(a) Schematic illustration of a graphene oxide sensing platform for the detection S. typhimurium (Bacterial cells concentration can be detected by turning on the fluorescence signal after the aptamer is bind to target bacterial cells). (b) Schematic representation of the PDMS/paper hybrid microfluidic chips for one-step pathogenic bacteria detection. (c) Illustration of the pathogenic bacteria detection principle inside the microfluidic channels. Reproduced with permission from ref. . Copyright 2014, Springer-Verlag Wien and ref. . Copyright 2013, Royal Society of Chemistry.
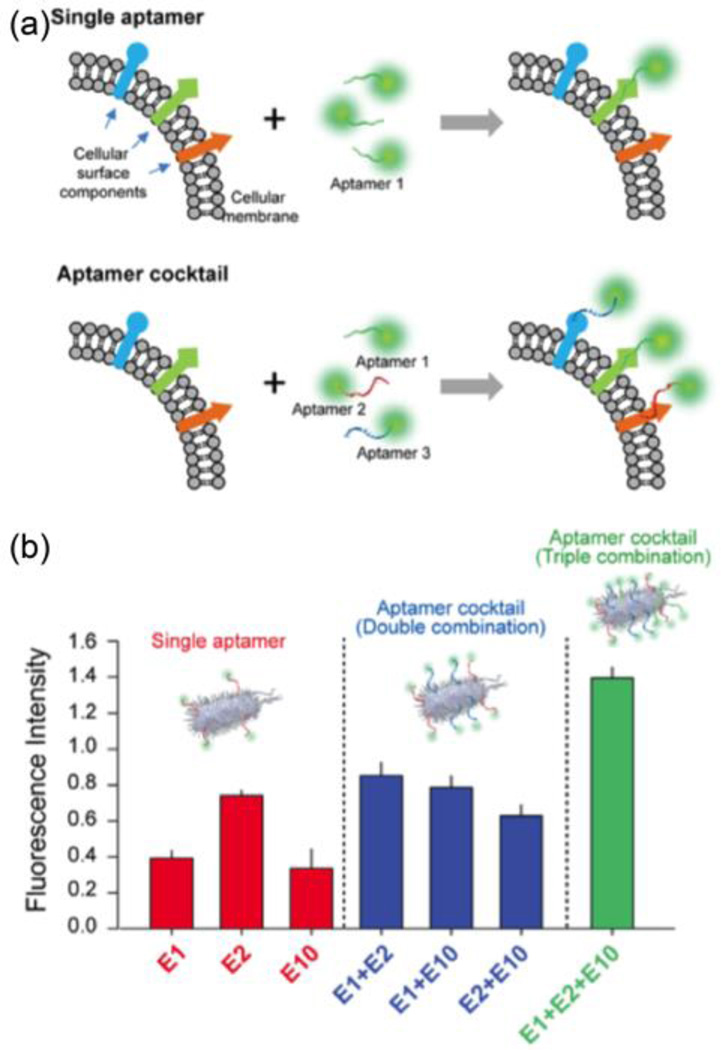
(a) Schematic illustration of single enhancement by cocktail aptamers for bacteria cell detection. (b) Fluorescence intensity of bacterial cells suspensions obtained after the fluorescence nanoprobes were labelled with single, double, and triple aptamers. Reproduced with permission from ref. . Copyright 2013, Elsevier B.V.
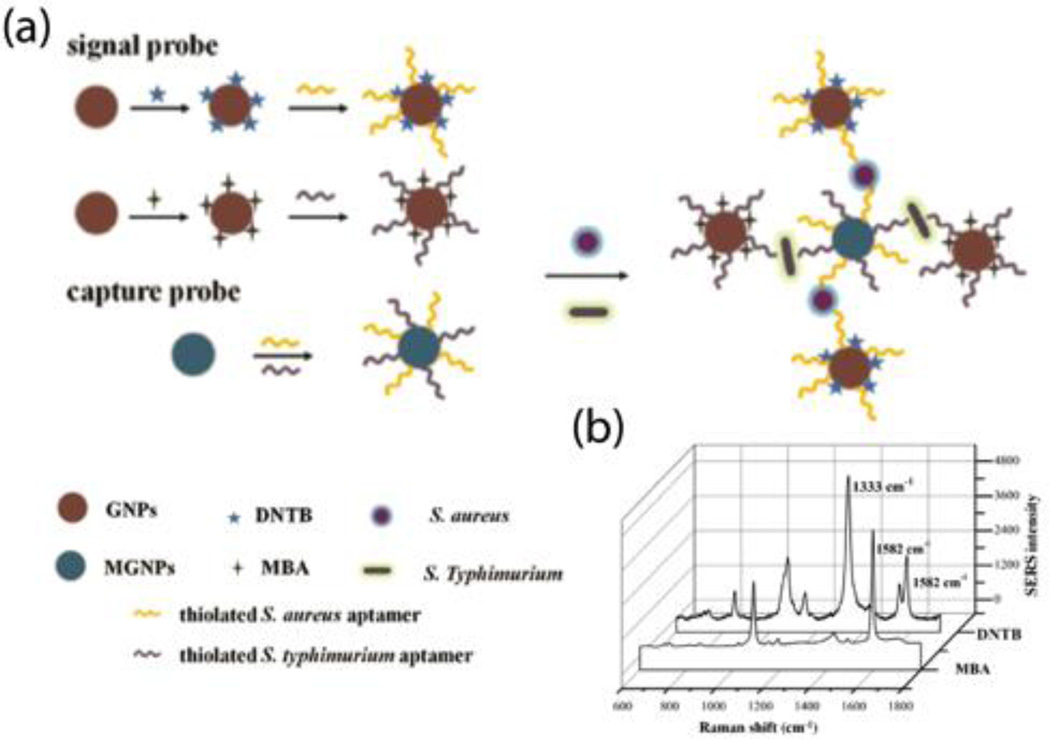
(a) Schematic illustration of the aptamer-conjugated nanoprobes for simultaneous detection of S. aureus and S. typhimurium based on SERS reporter molecules on AuNPs. (b) The Raman spectra of reporter molecules indicating the present of S. aureus and S. typhimurium in detection solution. Reproduced with permission from ref. . Copyright 2015, Elsevier B.V.

Schematic illustrations of bacteriophage replication assays. Reproduced with permission from ref. . Copyright 2014, Royal Society of Chemistry.
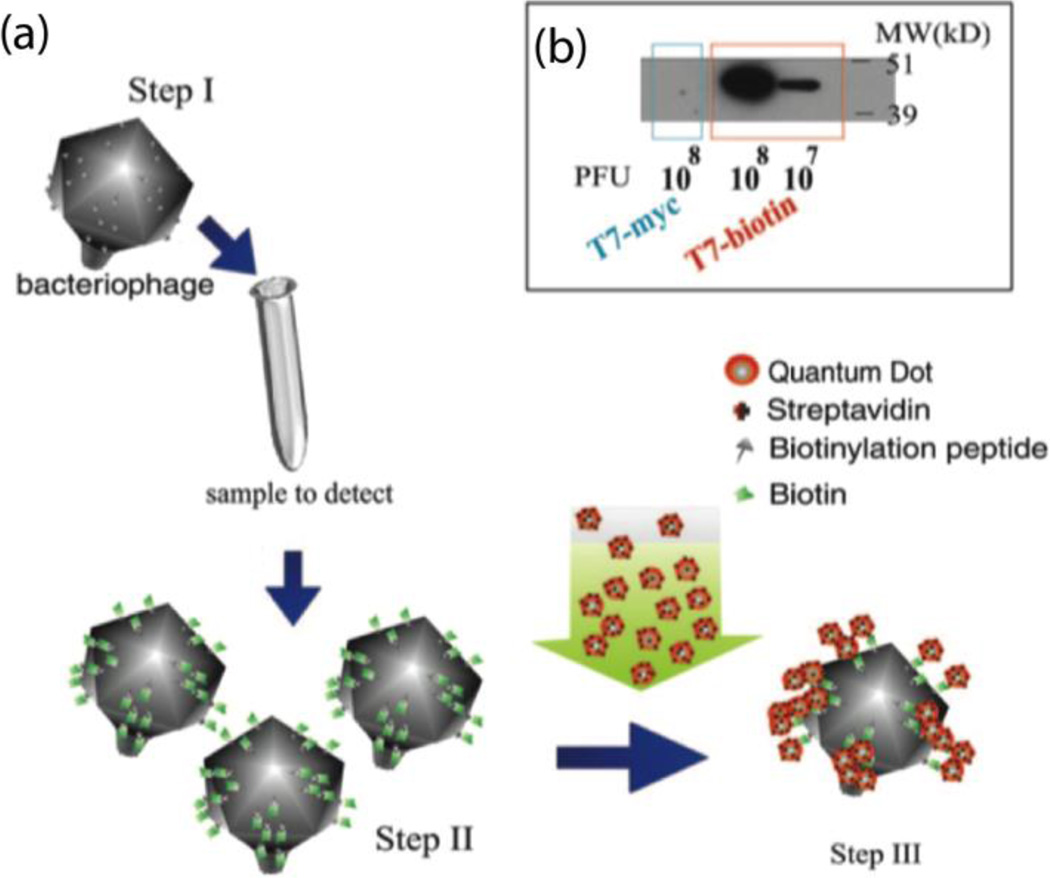
Schematic representation of bacteria detection using engineered T7 phages labelled with quantum dots via streptavidin-biotin interaction. (b) Western blot analysis of T7biotin and T7control phage particles. Reproduced with permission from ref. . Copyright 2006, National Academy of Sciences.
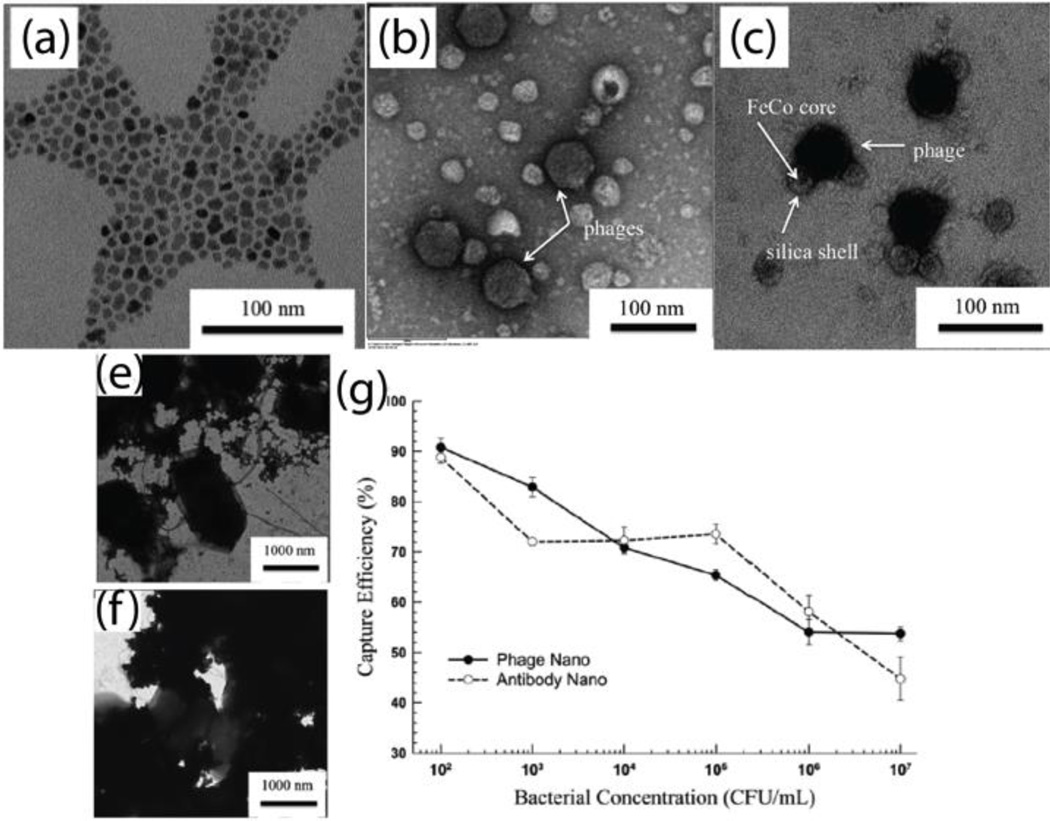
TEM images of (a) FeCo MNPs, (b) negatively stained T7 phage particles, (c) positively stained biotinylated phage bound to streptavidin-coated FeCo MNPs, (e) antibody-conjugated MNPs attached on the surface of bacterial cells, (f) phage-modified magnetic nanoprobes attached on the surface of bacterial cells. (g) Comparison the capture efficiency between antibody- and phage-conjugated magnetic nanoprobes. Reproduced with permission from ref. . Copyright 2006, Royal Society of Chemistry.

(a) Schematic illustration of electrostatic interaction detection of bacterial cells based on the switchable interaction of positively charged AuNPs and negatively charged enzyme. (b) Photograph and (c) absorbance intensity at the wavelength of 595 nm of the detection solutions of with different concentrations. (d) Inkjet printing scheme for the fabrication of test strips for bacteria detection. (e) Photograph of inkjet printed test strip for the Gram positive and Gram negative bacteria detection. Reproduced with permission from ref. . Copyright 2011, American Chemical Society and ref. . Copyright 2014, American Chemical Society.
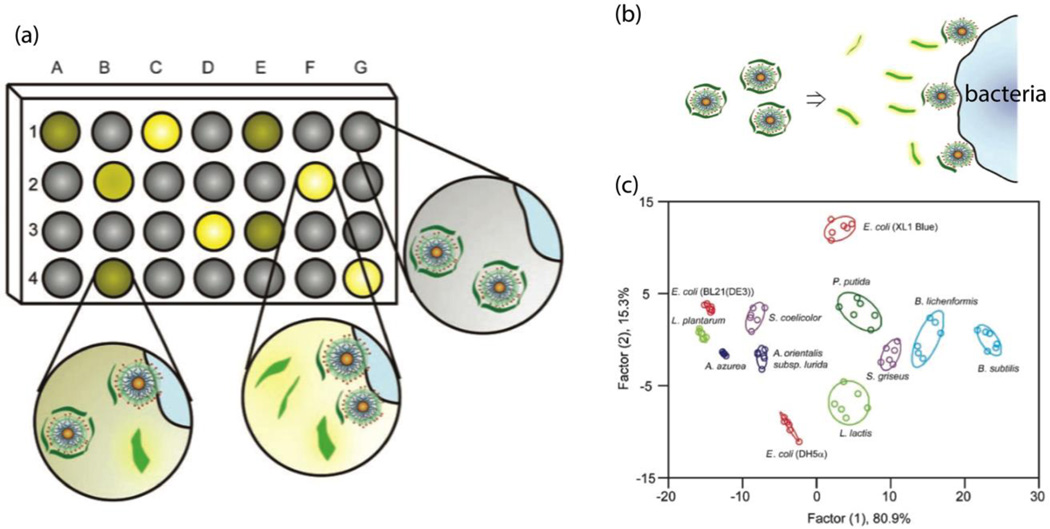
(a) Schematic illustration of the signal pattern generation using array-based sensing. (b) Schematic representation of the detection of bacteria strains using turning-on fluorescence array sensors. (c) Canonical score plot for the fluorescence array patterns calculated using LDA. Reproduced with permission from ref. . Copyright 2008, WILEY-VCH Verlag GmbH & Co. KGaA, Weinheim.
References
-
- Patel P. (Bio) Sensors for Measurement of Analytes Implicated in Food Safety: A Review. TrAC, Trends Anal. Chem. 2002;21(2):96–115.
-
- Whitesides GM. The Origins and the Future of Microfluidics. Nature. 2006;442(7101):368–373. - PubMed
-
- Ray PC, Khan SA, Singh AK, Senapati D, Fan Z. Nanomaterials for Targeted Detection and Photothermal Killing of Bacteria. Chem. Soc. Rev. 2012;41(8):3193–3209. - PubMed
-
- Poulsen LV. Microbial Biofilm in Food Processing. LWT - Food Science and Technology. 1999;32(6):321–326.
Publication types
MeSH terms
Grants and funding
LinkOut - more resources
Full Text Sources
Other Literature Sources