. 2017 Jan 24;11(1):314-324.
doi: 10.1021/acsnano.6b05706. Epub 2016 Dec 16.

Mechanism of Shiga Toxin Clustering on Membranes

Affiliations

Mechanism of Shiga Toxin Clustering on Membranes

Weria Pezeshkian et al. ACS Nano. .

Erratum in

  • Correction to Mechanism of Shiga Toxin Clustering on Membranes.
    Pezeshkian W, Gao H, Arumugam S, Becken U, Bassereau P, Florent JC, Ipsen JH, Johannes L, Shillcock JC. Pezeshkian W, et al. ACS Nano. 2018 Feb 27;12(2):2079. doi: 10.1021/acsnano.8b00537. Epub 2018 Jan 25. ACS Nano. 2018. PMID: 29368915 Free PMC article. No abstract available.

Abstract

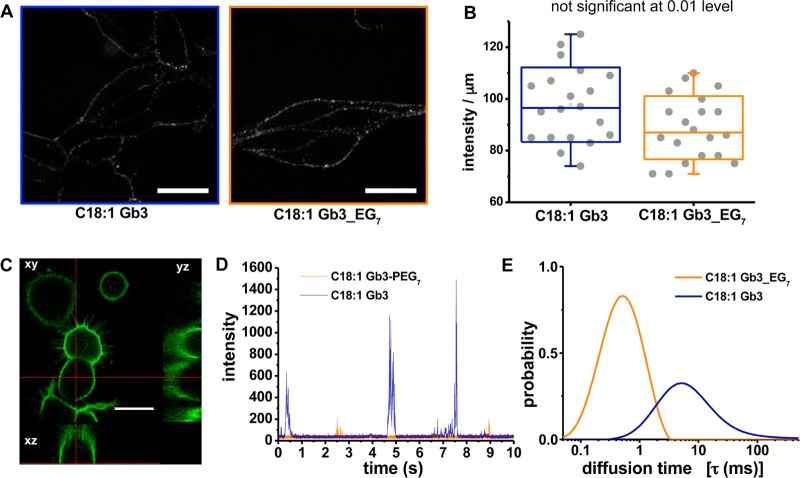
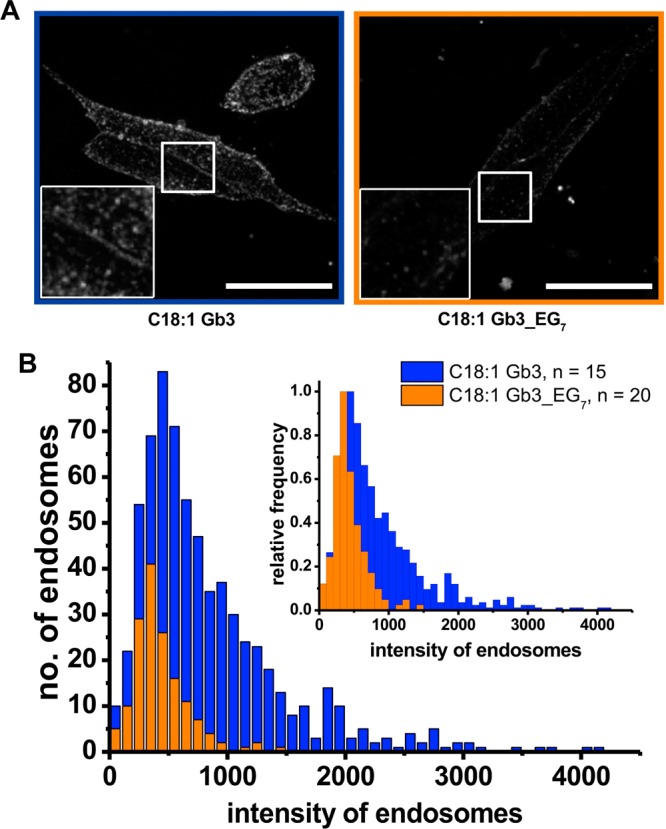
The bacterial Shiga toxin interacts with its cellular receptor, the glycosphingolipid globotriaosylceramide (Gb3 or CD77), as a first step to entering target cells. Previous studies have shown that toxin molecules cluster on the plasma membrane, despite the apparent lack of direct interactions between them. The precise mechanism by which this clustering occurs remains poorly defined. Here, we used vesicle and cell systems and computer simulations to show that line tension due to curvature, height, or compositional mismatch, and lipid or solvent depletion cannot drive the clustering of Shiga toxin molecules. By contrast, in coarse-grained computer simulations, a correlation was found between clustering and toxin nanoparticle-driven suppression of membrane fluctuations, and experimentally we observed that clustering required the toxin molecules to be tightly bound to the membrane surface. The most likely interpretation of these findings is that a membrane fluctuation-induced force generates an effective attraction between toxin molecules. Such force would be of similar strength to the electrostatic force at separations around 1 nm, remain strong at distances up to the size of toxin molecules (several nanometers), and persist even beyond. This force is predicted to operate between manufactured nanoparticles providing they are sufficiently rigid and tightly bound to the plasma membrane, thereby suggesting a route for the targeting of nanoparticles to cells for biomedical applications.

Keywords: Casimir force; clustering; endocytosis; fluctuation-induced force; glycosphingolipid; invagination; lectin; membrane.


Conflict of interest statement

The authors declare no competing financial interest.

Figures

Figure 1
Figure 1
STxB clustering on GUVs. (A) Schematic of the micropipette aspiration system coupled with FCS. (B) GUV composed of 30% Gb3 and 70% DOPC under low membrane tension displays STxB clustering and tubulation. Scale bar 10 μm. (C) Normalized autocorrelation curves of 200 nM STxB-Alexa488 on GUVs tensed using micropipette aspiration at different time points. The continuous line is the MEMFCS fit of the data. (D) Distributions of τD obtained from MEMFCS fitting of STxB clustering on vesicles prepared with 5 mol % C22:1 (black and gray traces) or C18:1 Gb3 (pink traces) and DOPC (95 mol %) at different time points. STxB clusters in interaction with both lipid species.
Figure 2
Figure 2
DPD simulations of particles on a fluctuating membrane. R(t) is the distance between the centers of the NPs, and R(0) is the distance between NPs at time 0. At time 0, NPs are forced to cluster, and evolution of R(t)/R(0) as a function of time is measured once this external constraint is removed. (A) R(t)/R(0) for different particle sizes. ro is the DPD length scale of 0.69 nm. (B) R(t)/R(0) for different rigidity parameters k of the particles. (C) R(t)/R(0) for bilayers containing different lipid structures (L-02, L-12, L-22). The boxes on the right show the respective structures used for increasing flexible linker lengths.
Figure 3
Figure 3
STxB clustering on GUVs containing Gb3 species with flexible linkers. (A) Molecular structure of the different lipids used in this study. (B) Binding of 200 nM STxB-Alexa488 to vesicles prepared with 5% mentioned Gb3 species and 95% DOPC. The yellow rectangle depicts the range within which FCS measurements were taken. (C) The percentage of vesicles displaying tubulation decreases with increasing linker length (black circles). The extent of tubulation (red boxes), that is, the sum of length of all the invaginations for a given vesicle divided by the circumference in that particular cross section (schematic in panel F), also decreases with increasing linker length. (D) An example snapshot of vesicles containing C22:1 Gb3 showing extensive tubulation. (E) An example snapshot of vesicles prepared with C22:1 Gb3_EG7 showing almost no tubulation. (F) Schematic describing the measurement of extent of tubulation (see panel C). Scale bars for panels D and E, 10 μm.
Figure 4
Figure 4
Clustering experiments on GUVs using Gb3 species with flexible linkers. Distributions of lifetimes for 200 nM STxB-Alexa488 on tensed GUVs obtained from MEMFCS fitting for different lipids as a function of time. On GUVs with C22:1 Gb3, STxB shows increased clustering at longer time scales. STxB clustering on C22:1 Gb3_EG3 and C22:1 Gb3_EG7 linker containing GUVs was strongly reduced.
Figure 5
Figure 5
Binding of STxB to GM95 cells reconstituted with C18:1 Gb3 or C18:1 Gb3_EG7. (A) Incubation on ice of correspondingly reconstituted cells with 200 nM STxB-Alexa488. (B) Average intensity per micrometer is similar for cells incorporated with both lipid species. Two-sample t test. (C) A representative image of cells incorporated with C18:1 Gb3 and incubated with STxB-Alexa488. FCS measurements were performed at the dorsal plasma membrane domain. Ten autocorrelation curves were obtained from 3 different cells for each condition and averaged for MEMFCS analysis. (D) A representative plot of intensity as a function of time for C18:1 Gb3_EG7 (orange) and C18:1 Gb3 (blue). (E) The distributions of τD for the different lipids. Scale bars 10 μm.
Figure 6
Figure 6
STxB endocytosis efficiency is dependent on flexible linker length. (A) Example images of cells fixed after 10 min of incubation at 37 °C, and subsequent TCEP treatment to quench fluorescence of cell surface-exposed STxB-Cy5 prior to imaging. Inset shows zoomed views from the boxed area of cells. (B) Histogram of vesicle intensities. Inset: Normalized histogram. Vesicle intensities for C18:1 Gb3 incorporated cells are significantly higher than for C18:1 Gb3_EG7 incorporated cells. Scale bar 10 μm.

References

    1. Karch H.; Denamur E.; Dobrindt U.; Finlay B. B.; Hengge R.; Johannes L.; Ron E. Z.; Tønjum T.; Sansonetti P. J.; Vicente M. The Enemy within Us: Lessons from the 2011 European Escherichia Coli O104:H4 Outbreak. EMBO Mol. Med. 2012, 4, 841–848. 10.1002/emmm.201201662. - DOI - PMC - PubMed
    1. Johannes L.; Römer W. Shiga toxins - from Cell Biology to Biomedical Applications. Nat. Rev. Microbiol. 2010, 8, 105–116. 10.1038/nrmicro2279. - DOI - PubMed
    1. Bergan J.; Dyve Lingelem A. B.; Simm R.; Skotland T.; Sandvig K. Shiga Toxins. Toxicon 2012, 60, 1085–1107. 10.1016/j.toxicon.2012.07.016. - DOI - PubMed
    1. Johannes L.; Parton R. G.; Bassereau P.; Mayor S. Building Endocytic Pits without Clathrin. Nat. Rev. Mol. Cell Biol. 2015, 16, 311–321. 10.1038/nrm3968. - DOI - PubMed
    1. Spooner R. A.; Lord J. M. How Ricin and Shiga Toxin Reach the Cytosol of Target Cells: Retrotranslocation from the Endoplasmic Reticulum. Curr. Top. Microbiol. Immunol. 2012, 357, 19–40. 10.1007/82_2011_154. - DOI - PubMed

Publication types

LinkOut - more resources