

Gene-specific correlation of RNA and protein levels in human cells and tissues
- PMID: 27951527
- PMCID: PMC5081484
- DOI: 10.15252/msb.20167144
Gene-specific correlation of RNA and protein levels in human cells and tissues
Abstract
An important issue for molecular biology is to establish whether transcript levels of a given gene can be used as proxies for the corresponding protein levels. Here, we have developed a targeted proteomics approach for a set of human non-secreted proteins based on parallel reaction monitoring to measure, at steady-state conditions, absolute protein copy numbers across human tissues and cell lines and compared these levels with the corresponding mRNA levels using transcriptomics. The study shows that the transcript and protein levels do not correlate well unless a gene-specific RNA-to-protein (RTP) conversion factor independent of the tissue type is introduced, thus significantly enhancing the predictability of protein copy numbers from RNA levels. The results show that the RTP ratio varies significantly with a few hundred copies per mRNA molecule for some genes to several hundred thousands of protein copies per mRNA molecule for others. In conclusion, our data suggest that transcriptome analysis can be used as a tool to predict the protein copy numbers per cell, thus forming an attractive link between the field of genomics and proteomics.
Keywords: gene expression; protein quantification; targeted proteomics; transcriptomics.
© 2016 The Authors. Published under the terms of the CC BY 4.0 license.
Figures
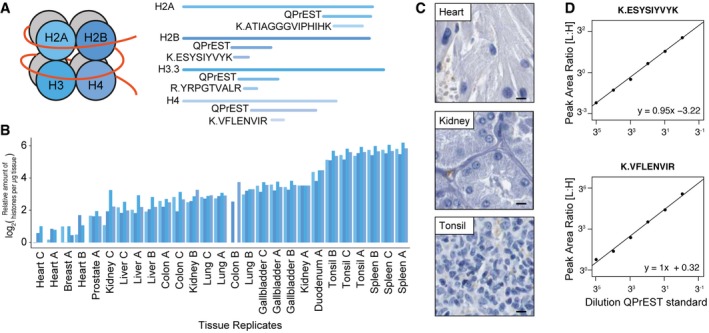
The core histones and overview of the corresponding QPrEST and peptide standards mapped out on the protein sequence.
Relative quantification of all four histone proteins in each tissue replicate (order of appearance per replicate: H2A, H2B, H3.3, and H4).
Immunohistochemistry images from the Human Protein Atlas (
http://www.proteinatlas.org ) for protein ANXA1 with nuclear staining (blue) for three selected tissues (scale bars = 100 μm).Calibration curves for two of the four histone peptides, with decreasing amount of QPrEST standard spiked into a U2OS cell lysate.
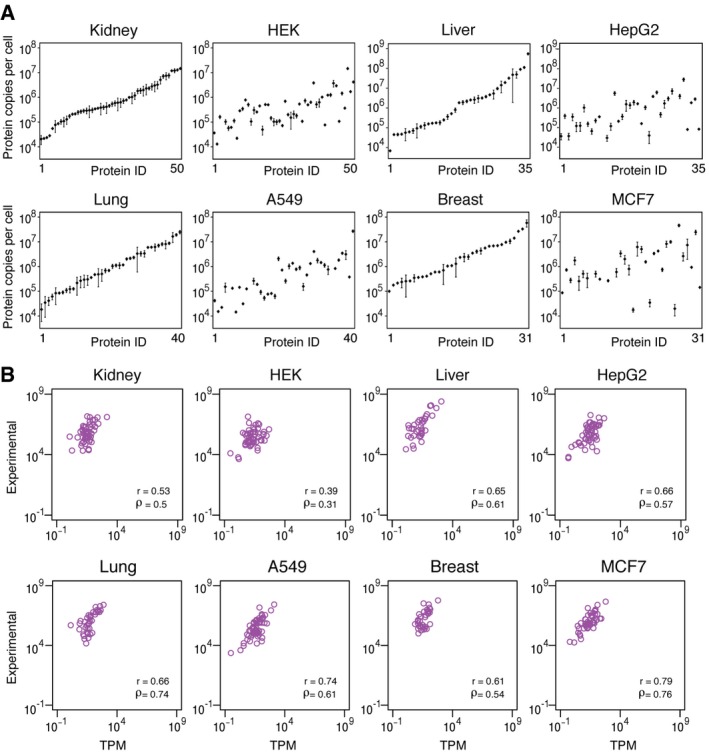
Absolute copy number of protein in kidney tissue and human embryonal kidney cells (HEK293), liver tissue and liver cancer cell line (HepG2), lung tissue and lung cancer cell line (A549), and breast tissue and breast cancer cell line (MCF7). The order of proteins is the same in the tissue and corresponding cell line, and the proteins have been ordered according to the abundance in the respective tissue.
The direct correlation between RNA (TPM) and protein abundances (copy number) for all quantified genes in the same tissues and cell lines. Spearman's (ρ) and Pearson's (r) correlation between the two values across the quantified genes are shown. The other seven tissues and five cell lines are shown in Fig EV4.
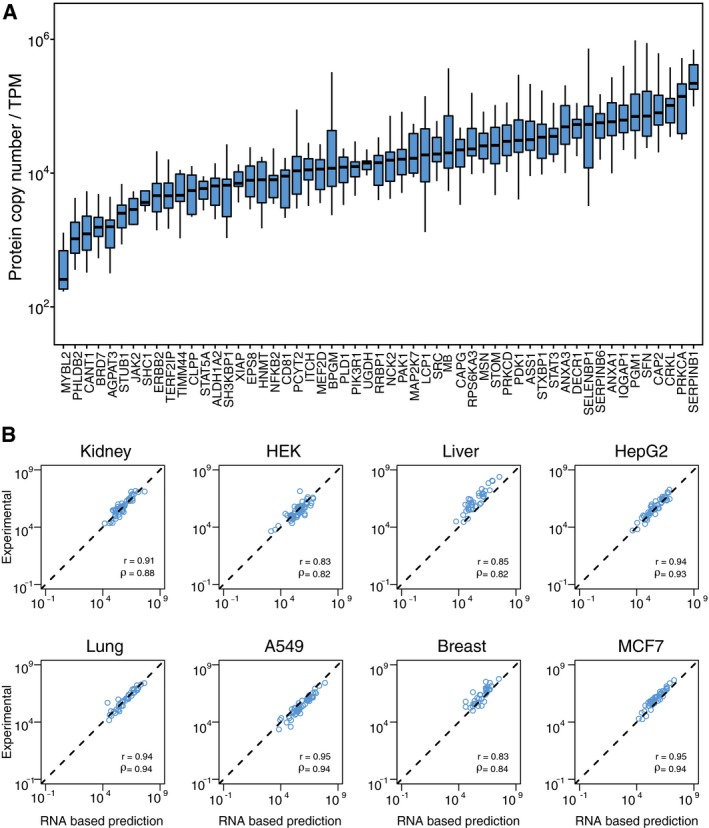
The gene‐specific RNA‐to‐protein correlation factors are shown for all the 55 genes with a box‐plot showing the average correlation factor for each gene and the variation observed in the nine cell lines and 11 tissues. All the values for each of the cell lines and tissues are found in Table EV7. Horizontal lines = median. The lower and upper “hinges” correspond to the first and third quartiles (the 25th and 75th percentiles). Length of the whiskers as multiple of IQR = 1.5.
The gene‐specific correlation between protein copy number (x‐axis) and predicted protein copy number based on the RNA levels (RNA‐based prediction) is shown for four tissues and four cell lines. The other seven tissues and five cell lines are also shown in Fig EV5 and predicted copy numbers can be found in Table EV9.
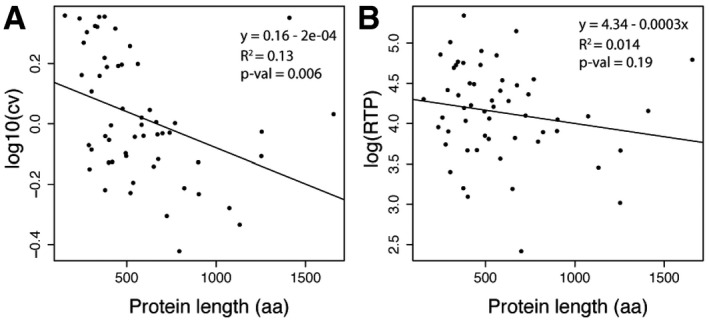
The variation measured as coefficient of variation (cv) across samples are plotted against the protein length.
The protein lengths for the 55 target proteins are plotted against the RTP ratio.
- A, B
The direct correlation between
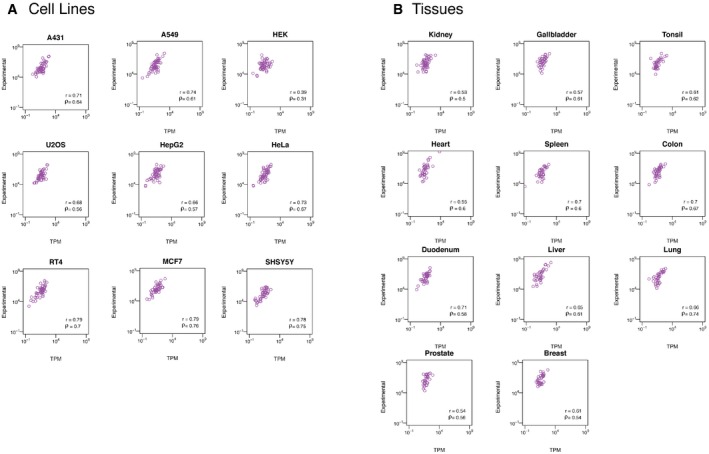
RNA (TPM , y‐axis) and protein abundances (copy number, x‐axis) for all quantified genes in all cell lines (A) and tissues (B). The Spearman's (ρ) and Pearson's (r) correlations between the two values across the quantified genes are shown.
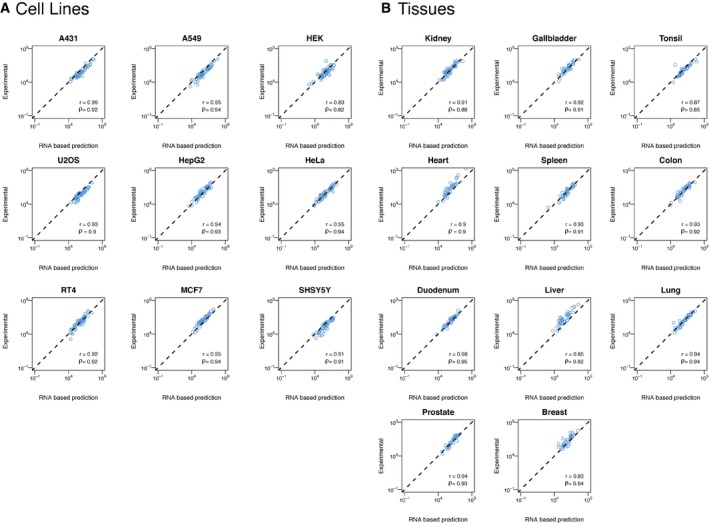
- A, B
The gene‐specific correlation between protein copy number (x‐axis) and predicted protein copy number based on the
RNA levels (RNA ‐based prediction, y‐axis) in all cell lines (A) and tissues (B). The Spearman's (ρ) and Pearson's (r) correlations between the two values across the quantified genes are shown.
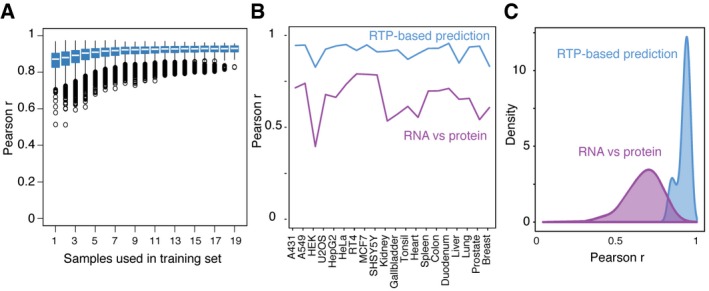
The gene‐specific correlation between protein copy number (x‐axis) and predicted protein copy number based on the RNA levels (RNA‐based prediction) is shown for all the 55 genes and all 20 cell lines and tissues. Horizontal lines = median. The lower and upper “hinges” correspond to the first and third quartiles (the 25th and 75th percentiles). Length of the whiskers as multiple of IQR. Defaults to 1.5. Circles indicate outliers.
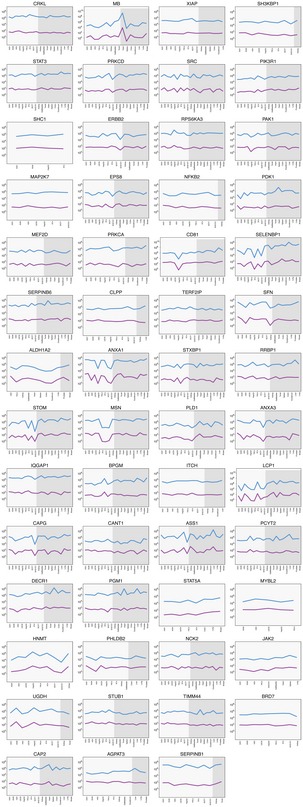
The Pearson's correlation between RNA and protein levels for the 55 genes in the nine cell lines and 11 tissues is shown as a direct comparison of RNA and protein levels (purple, RNA versus protein) and after introducing the gene‐specific correlation factor (blue, RNA‐based prediction versus protein).
Density plot for the direct comparison between RNA and protein levels before and after introducing the RTP‐conversion factor. The Pearson's correlation using the RTP‐conversion factor is improved substantially for all cell lines and tissues with a median Pearson's correlation of 0.93.
Comment in
-
Quantifying gene expression: the importance of being subtle.Mol Syst Biol. 2016 Oct 20;12(10):885. doi: 10.15252/msb.20167325. Mol Syst Biol. 2016. PMID: 27951528 Free PMC article.
References
-
- Ahrné E, Molzahn L, Glatter T, Schmidt A (2013) Critical assessment of proteome‐wide label‐free absolute abundance estimation strategies. Proteomics 13: 2567–2578 - PubMed
-
- Anderson L, Seilhamer J (1997) A comparison of selected mRNA and protein abundances in human liver. Electrophoresis 18: 533–537 - PubMed
-
- Bray NL, Pimentel H, Melsted P, Pachter L (2016) Near‐optimal probabilistic RNA‐seq quantification. Nat Biotechnol 34: 525–527 - PubMed
-
- Cox J, Mann M (2008) MaxQuant enables high peptide identification rates, individualized p.p.b.‐range mass accuracies and proteome‐wide protein quantification. Nat Biotechnol 26: 1367–1372 - PubMed
Publication types
MeSH terms
Substances
LinkOut - more resources
Full Text Sources
Other Literature Sources
