. 2016 Dec 22;540(7634):583-587.
doi: 10.1038/nature20597. Epub 2016 Dec 12.

NLRC3 is an inhibitory sensor of PI3K-mTOR pathways in cancer

Affiliations

NLRC3 is an inhibitory sensor of PI3K-mTOR pathways in cancer

Rajendra Karki et al. Nature. .

Abstract

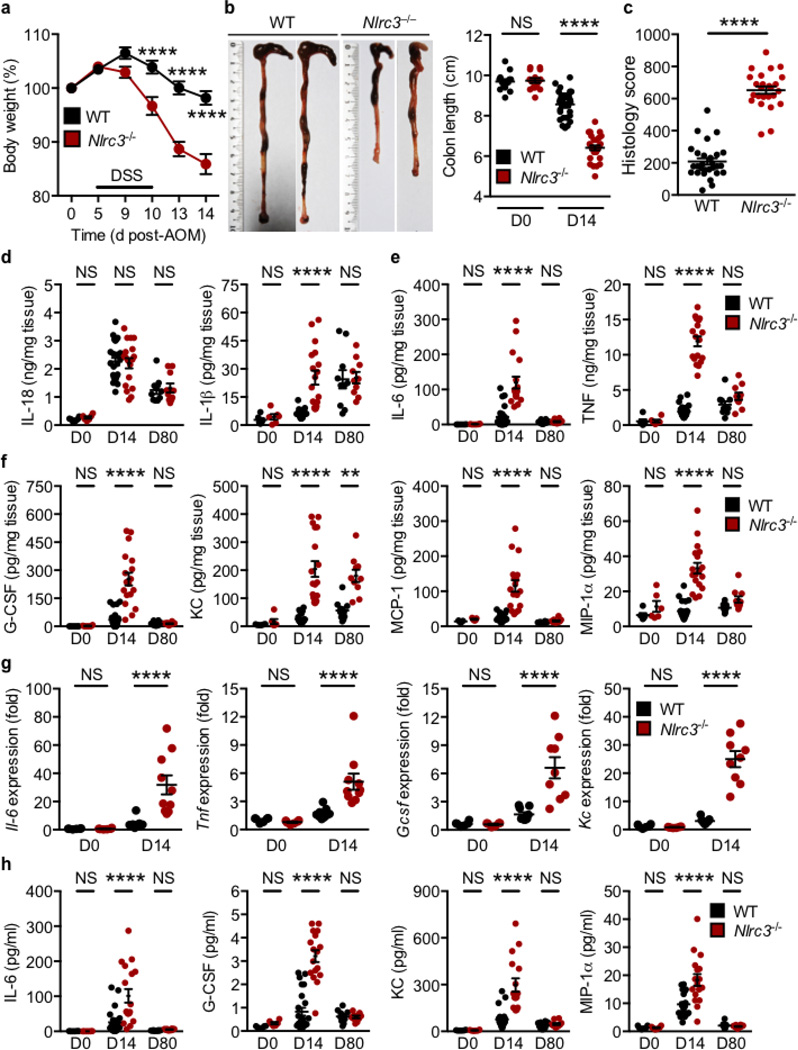
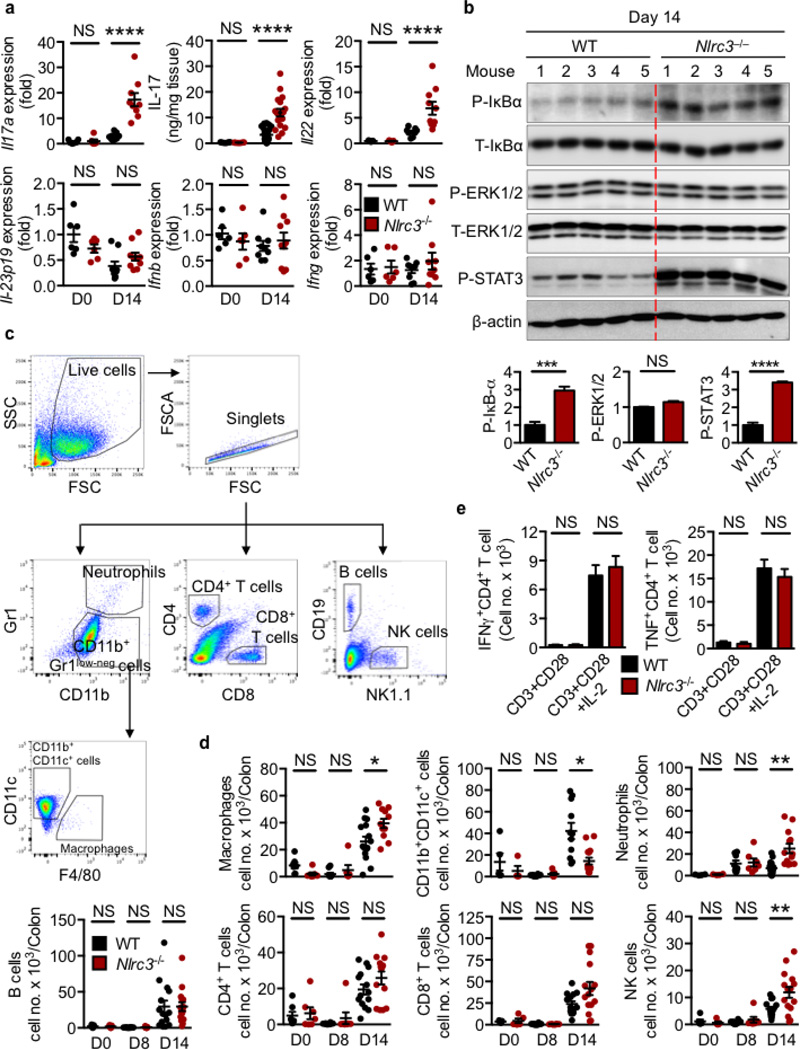
NLRs (nucleotide-binding domain and leucine-rich repeats) belong to a large family of cytoplasmic sensors that regulate an extraordinarily diverse range of biological functions. One of these functions is to contribute to immunity against infectious diseases, but dysregulation of their functional activity leads to the development of inflammatory and autoimmune diseases. Cytoplasmic innate immune sensors, including NLRs, are central regulators of intestinal homeostasis. NLRC3 (also known as CLR16.2 or NOD3) is a poorly characterized member of the NLR family and was identified in a genomic screen for genes encoding proteins bearing leucine-rich repeats (LRRs) and nucleotide-binding domains. Expression of NLRC3 is drastically reduced in the tumour tissue of patients with colorectal cancer compared to healthy tissues, highlighting an undefined potential function for this sensor in the development of cancer. Here we show that mice lacking NLRC3 are hyper-susceptible to colitis and colorectal tumorigenesis. The effect of NLRC3 is most dominant in enterocytes, in which it suppresses activation of the mTOR signalling pathways and inhibits cellular proliferation and stem-cell-derived organoid formation. NLRC3 associates with PI3Ks and blocks activation of the PI3K-dependent kinase AKT following binding of growth factor receptors or Toll-like receptor 4. These findings reveal a key role for NLRC3 as an inhibitor of the mTOR pathways, mediating protection against colorectal cancer.


Figures

Extended Data Figure 1
Extended Data Figure 1. NLRC3 prevents colitis-associated colorectal tumorigenesis
a, Timeline for azoxymethane (AOM) and dextran sulfate sodium (DSS) treatment. b, Relative expression of the gene encoding NLRC3 in tumour and non-tumour tissues in the colon of WT mice 80 days after AOM injection. c, Targeting strategy used to generate the Nlrc3−/− mice and PCR analysis for the gene encoding NLRC3 in WT C57BL/6 mice, Nlrc3+/– mice and Nlrc3−/− mice. The primers P1 (binds a region between Exon 1 and Exon 2) and P2 (binds a region between Exon 3 and Exon 4) were designed for “PCR1” such that it generates a 4804-bp PCR fragment for the WT allele and a 2309-bp fragment for the knockout (KO) allele. However, “PCR1” cannot differentiate heterozygote (HT) and KO mice because the KO 2309-bp fragment outcompeted the WT 4804-bp fragment. Therefore, we designed primers P3 and P4 for use in “PCR2” to amplify a 940-bp fragment from Exon 3 to confirm its presence in WT and HET mice and its absence in KO mice. d, Histological scores of the colon tissues in WT and Nlrc3−/− mice 80 days after AOM injection e, Percentages of mice with dysplasia 80 days after injection of AOM. f, Percentages of mice with adenocarcinoma 80 days after injection of AOM. g, H&E staining of colon crypts. Scale bar, 100 µm (g). Each symbol represents an individual mouse (b, d). **** P<0.0001; NS, not statistically significant [One-way ANOVA (b) or two tailed t-test (d)]. Data represent two independent experiments (b, dg; mean and s.e.m. b, d).
Extended Data Figure 2
Extended Data Figure 2. NLRC3 dampens intestinal inflammation
a, Body weight change of mice pooled from three independent experiments. b, Images of colon and colon length in WT and Nlrc3−/− mice 14 days after injection of AOM. c, Histological scores 14 days after injection of AOM. d, Levels of IL-18 and IL-1β in colon tissues 14 and 80 days after AOM. e,f, Levels of IL-6, TNF, G-CSF, KC, MCP-1 and MIP-1α in colon tissues 14 and 80 days after AOM. g, Relative expression of genes encoding IL-6, TNF, G-CSF and KC in colon tissues of untreated WT and Nlrc3−/− mice and in WT and Nlrc3−/− mice 14 days after injection of AOM. h, Levels of IL-6, G-CSF, KC and MIP-1α in sera of untreated WT and Nlrc3−/− mice and WT and Nlrc3−/− mice 14 and 80 days after AOM. Each symbol represents an individual mouse (b–h). ** P<0.01; **** P<0.0001; NS, not statistically significant [One-way ANOVA (a) or two tailed t-test (bh)]. Data represent three independent experiments (ah; mean and s.e.m. in ah).
Extended Data Figure 3
Extended Data Figure 3. NLRC3 governs colorectal tumorigenic susceptibility via inflammatory mediators and immune cells
a, Relative expression of genes encoding IL-17a, levels of the IL-17 protein and relative expression of genes encoding IL-22, IL-23p19, IFN-β and IFN-γ in colon tissues of untreated WT and Nlrc3−/− mice and in WT and Nlrc3−/− mice 14 days after AOM injection. b, Immunoblot analysis of phosphorylated and total IκBα (P-IκBα and T-IκBα), ERK1 and ERK2 (P-ERK1/2 and T-ERK1/2), phosphorylated STAT3 (P-STAT3), and β-actin (loading control) in colon tissues of WT and Nlrc3−/− mice 14 days after injection of AOM (top). The protein band intensity was normalized to the total protein counterpart and/or β-actin, and expressed relative to that of WT controls, set at 1 (bottom). c, Gating strategies used to generate data in d. d, Number of macrophages, CD11b+CD11c+ cells, neutrophils, B cells, CD4+ T cells, CD8+ T cells and NK cells per colon in WT and Nlrc3−/− mice 8 and 14 days after injection of AOM. e, Splenocytes from WT and Nlrc3−/− mice were stimulated with CD3, CD28 and IL-2, and the intracellular staining was performed for IFN-γ and TNF. * P<0.05; ** P<0.01; *** P<0.001; **** P<0.0001; NS, not statistically significant, two tailed t-test (a, b, d and e). Data pooled from two independent experiments (a) or represent one experiment representative of two independent experiments (be; mean and s.e.m. in a, b, d and e).
Extended Data Figure 4
Extended Data Figure 4. The inhibitory effect of NLRC3 is more dominant in intestinal epithelial cells than in haematopoietic cells
a, Colon tumours in bone marrow chimeric mice (1) WT→WT (n=10); (2) Nlrc3−/−→WT (n=9); (3) WT→Nlrc3−/− (n=8); (4) Nlrc3−/−Nlrc3−/− (n=9) 80 days after injection of AOM (left). Percentages of the tumour size of mice (right). b, Colon tumours in littermate Nlrc3fl/fl (n=8), LysMcreNlrc3fl/fl (n=11), Vav1creNlrc3fl/fl (n=9), VillincreNlrc3fl/fl (n=7) and Nlrc3−/− (n=8) mice 80 days after injection of AOM (left). Percentages of the tumour size of mice (right). c, Relative expression of genes encoding LGR5, WNT1, β-catenin (Ctnnb1), Axin2, TCF4, TCF7, and LEF1 in colon tissues of untreated WT and Nlrc3−/− mice or in WT and Nlrc3−/− mice 14 days after injection of AOM. d, Immunohistochemical staining of β-catenin in colon tissues of WT and Nlrc3−/− mice. Scale bar, 20 µm (d). Each symbol represents one mouse (c). NS, not statistically significant (two tailed t-test). Data represent two independent experiments (mean and s.e.m. in c).
Extended Data Figure 5
Extended Data Figure 5. Dysregulation of mTOR signalling precedes dysregulation of NF-kB signalling
a, Immunoblot analysis of phosphorylated mTOR (P-mTOR), S6 (P-S6), 4E–BP1 (P-4E–BP1), AKT (P-AKT S473), IκBα (P-IκBα) and GAPDH (loading control) in colon tissues of WT and Nlrc3−/− mice 8 days after injection of AOM (left). The protein band intensity was normalized to GAPDH and expressed relative to that of WT controls, set at 1 (right). b, Levels of IL-18, IL-1β, IL-6, TNF, G-CSF, KC, MCP-1 and MIP-1α in colon tissues 8 days after injection of AOM. c, Levels of IL-18, IL-1β, IL-6, TNF, G-CSF, KC, MCP-1 and MIP-1α in sera. Each symbol represents an individual mouse (b, c). * P<0.05; ** P<0.01; NS, not statistically significant [two tailed t-test (ac)]. Data represent two independent experiments (mean and s.e.m. in ac). For gel source data, see Supplementary Figure 1.
Extended Data Figure 6
Extended Data Figure 6. NLRC3 regulates mTOR activity
a, Immunoblot analysis of phosphorylated AKT (P-AKT T308), total AKT (T-AKT), phosphorylated 4E–BP1 (P-4E–BP1) and GAPDH (loading control) in colon tissues of WT, Nlrc3+/– and Nlrc3−/− mice 14 days after injection of AOM (left). The protein band intensity was normalized to the total protein counterpart and/or loading controls, and expressed relative to that of WT controls, set at 1 (right). b, Immunoblot analysis of phosphorylated AKT (P-AKT T308), S6K (P-S6K), S6 (P-S6) and 4E–BP1 (P-4E–BP1), and GAPDH (loading control) in WT fibroblasts transfected with a control siRNA or Nlrc3 siRNA left untreated or treated with IGF-1 (top). Densitometry analysis as in a (bottom). c, Relative expression of the gene encoding NLRC3 in WT fibroblasts transfected with a control siRNA or compared with WT fibroblasts transfected with an Nlrc3 siRNA. d, Immunoblotting of phosphorylated S6K (P-S6K), S6 (P-S6), 4E–BP1 (P-4E–BP1), AKT (P-AKT S473), and total AKT (T-AKT) in primary fibroblasts left untreated or treated with IGF-1 (top). Densitometry analysis as in a (bottom). e, Immunoblotting of phosphorylated AKT (P-AKT T308) and mTOR (P-mTOR) in primary fibroblasts left untreated or treated with IGF-1 (left). Densitometry analysis as in b (right). *P <0.05; **P <0.01; ***P <0.001 [One-way ANOVA (a, b, d and e)]. Data are from one experiment representative of two (a, c) or four independent experiments (b, d and e; mean and s.e.m. in a, b, d and e). For gel source data, see Supplementary Figure 1.
Extended Data Figure 7
Extended Data Figure 7. NLRC3 regulates mTOR activity in fibroblasts
ad, Immunofluorescence staining of phosphorylated a, S6 (P-S6), b, 4E–BP1 (P-4E–BP1), c, AKT (P-AKT S473), and d, AKT (P-AKT T308) in primary fibroblasts left untreated or treated with IGF-1 for 30 min (left). Quantification of the fluorescence intensity (right) in each cell (n=150 or more). Scale bar, 20 µm (ad). Each symbol represents an individual cell (ad). ADU, average density unit (ad). **** P<0.0001; NS, not statistically significant [two tailed t-test (ad)]. Data represent one experiment representative of two independent experiments (mean and s.e.m.).
Extended Data Figure 8
Extended Data Figure 8. NLRC3 prevents colorectal cancer in an ApcMin/+ model of tumorigenesis
a, Images of colon tumours (left), and tumour number and colon length (middle), and size (right) of 120-days-old littermate ApcMin/+ and ApcMin/+Nlrc3−/− mice. b, Percentages of mice with dysplasia (left), total histology scores (middle) and histology scores of different parts of colon and different parameters (right) of mice in a. c, H&E (top), Ki67 (middle) and phosphorylated S6 (P-S6, bottom) staining of colon tumours, d, Quantification of the number (top) and size (bottom) of organoids derived from colonic stem cells of ApcMin/+ and ApcMin/+Nlrc3−/− mice left untreated or treated with LY294002 and rapamycin. Scale bar, 200 µm (c). * P<0.05; ** P<0.01; *** P<0.001; **** P<0.0001; NS, not statistically significant [two tailed t-test (a, b and d)]. Data represent two independent experiments (mean and s.e.m. in a, b and d).
Extended Data Figure 9
Extended Data Figure 9. NLRC3 disrupts the assembly of the PI3K heterodimeric complex
Immunoprecipitation and comparative analysis of the PI3K signalling complex levels between a, WT and Nlrc3−/− primary fibroblasts (MEFs) and b, bone marrow-derived macrophages (BMDMs). c, Schematic representation of generation of deletion mutants of NLRC3. d, Loading inputs for eg. e, Immunoprecipitation of WT-NLRC3 and its deletion mutants. Immunoblotting analysis of the interaction between NLRC3 and its mutants with f, PI3K–p110 subunit and g, PI3K–p85. Data represent two independent experiments. For gel source data, see Supplementary Figure 1.
Extended Data Figure 10
Extended Data Figure 10. NLRC3 negatively regulates TLR4-induced activation of the PI3K–AKT–mTOR pathway
a, Immunoblot analysis of phosphorylated AKT (T308 and S473), total AKT (T-AKT), and β-actin (loading control) in WT and Nlrc3−/− bone marrow-derived macrophages (BMDMs) left untreated or treated with LPS (top). The protein band intensity was normalized to β-actin, and expressed relative to that of WT controls, set at 1 (bottom). b, Immunoblot analysis of phosphorylated mTOR (P-mTOR), phosphorylated 4E–BP1 (P-4E–BP1), and β-actin (loading control) in WT and Nlrc3−/− bone marrow-derived macrophages (BMDMs) left untreated or treated with LPS (top). Densitometry analysis as in a (bottom). c, A model of the role of NLRC3 in the negative regulation of the PI3K–AKT–mTOR pathway. * P<0.05; ** P<0.01; *** P<0.001 [two tailed t-test (a and b)]. Data are from one experiment representative of four independent experiments (mean and s.e.m. in a and b). For gel source data, see Supplementary Figure 1.
Figure 1
Figure 1. NLRC3 prevents colorectal tumorigenesis
a, Body weight change during AOM-DSS treatment. b, Colon tumours in mice 80 days after injection of AOM. c, Number and d, size of colon tumours in WT (n=37) and Nlrc3−/− (n=35) mice. e, H&E staining and f, histological scores as in b. g, Number of colon tumours in littermate WT (n=10), Nlrc3+/– (n=5) and Nlrc3−/− (n=6) mice. h, Number of colon tumours in bone marrow chimera mice treated as in b. WT→WT (n=10); Nlrc3−/−→WT (n=9); WT→Nlrc3−/− (n=8); and Nlrc3−/−Nlrc3−/− (n=9). i, Number of colon tumours in littermate Nlrc3fl/fl (n=8), LysMcreNlrc3fl/fl (n=11), Vav1creNlrc3fl/fl (n=9), VillincreNlrc3fl/fl (n=7) and Nlrc3−/− (n=8) mice treated as in b. Scale bar, 200 µm (e). Each symbol represents an individual mouse (c, fi). *P<0.05; **P<0.01; ***P<0.001; ****P<0.0001; NS, not statistically significant [one-way ANOVA (a,gi) or two tailed t-test (c,f)]. Data are from three independent experiments (af) and two independent experiments (gi; mean and s.e.m. in a,c, fi).
Figure 2
Figure 2. NLRC3 suppresses overt proliferation
a, Images and quantification of the number of Ki67+ (left) and PCNA+ (right) cells in each crypt of WT (day 0, n=5; day 14, n=8) and Nlrc3−/− (day 0, n=5; day 14, n=8) mice. b, Images (left) and quantification of the number (top right) and size (bottom right) of mouse intestinal organoids. c, Proliferation of the HCT116 cell line. d, Proliferation of primary mouse fibroblasts. At least 25 crypts were counted in each animal (a). Scale bars, 200 µm (a), 50 µm (b). Each symbol represents one crypt (a) or one organoid (b). **P<0.01; ***P<0.001; ****P<0.0001; NS, no statistical significance [two tailed t-test (a–d)]. Data are from one experiment representative of two (a, b) or three independent experiments (c, d; mean and s.e.m. in ad).
Figure 3
Figure 3. NLRC3 controls mTOR signalling pathways
a, Immunoblot of mouse colon tissues and densitometric quantification. b, Immunohistochemical staining of mouse colon tissues. c, Immunofluorescence staining of mouse intestinal organoids after 7 days of culture. d, Immunoblot of organoids treated with IGF-1 and densitometric quantification. e, Immunoblot of colon tissues of mice and densitometric quantification. f, Immunohistochemical staining of colon tissues of mice. g, Immunofluorescence staining of mouse intestinal organoids after 7 days of culture. h, Immunoblot of organoids treated with IGF-1 and densitometric quantification. Scale bars, 2,500 µm (b, whole colon, left), 200 µm (b, magnified, right), 50 µm (c, f, g). *P<0.05 **P<0.01; ***P<0.001; [two tailed t-test (a and e); one-way ANOVA (d and h)]. Data are from one experiment representative of two (ac, eg) or three independent experiments (d, h; mean and s.e.m. in a, d, e and h). For gel source data, see Supplementary Figure 1.
Figure 4
Figure 4. NLRC3 regulates upstream signalling molecules within the PI3K–AKT–mTOR pathway
a, Immunofluorescence staining of primary fibroblasts and frequency of co-localisation between mTOR and LAMP1 (n=>150). b, Images and quantification of colon tumours in littermate ApcMin/+ and ApcMin/+Nlrc3−/− mice 40 days after treatment with vehicle or NVP-BEZ235. c, Immunohistochemical staining of colon tissues from mice treated as in b. d, Immunoprecipitation of the GFP tag in 239T cells transfected with a plasmid encoding GFP alone or NLRC3-GFP. e, Immunoblot of mouse colon tissues and densitometric quantification. f, Immunoblot of primary mouse fibroblasts transduced with a retroviral vector encoding GFP or NLRC3-GFP, with or without stimulation with IGF-1, and densitometric quantification. Scale bar, 10 µm (a), 200 µm (c). *P<0.05 **P<0.01; ****P<0.0001; NS, no statistical significance [two tailed t-test (e) and one-way ANOVA (a, b and f)]. Data are from one experiment representative of two (ac and e) or three (d and f independent experiments (mean and s.e.m. in a, b, e and f). For gel source data, see Supplementary Figure 1.

Comment in

References

    1. Ting JP, Willingham SB, Bergstralh DT. NLRs at the intersection of cell death and immunity. Nature reviews. Immunology. 2008;8:372–379. - PubMed
    1. Zaki MH, et al. The NLRP3 inflammasome protects against loss of epithelial integrity and mortality during experimental colitis. Immunity. 2010;32:379–391. - PMC - PubMed
    1. Zaki MH, Vogel P, Body-Malapel M, Lamkanfi M, Kanneganti TD. IL-18 production downstream of the Nlrp3 inflammasome confers protection against colorectal tumor formation. Journal of immunology. 2010;185:4912–4920. - PMC - PubMed
    1. Allen IC, et al. The NLRP3 inflammasome functions as a negative regulator of tumorigenesis during colitis-associated cancer. The Journal of experimental medicine. 2010;207:1045–1056. - PMC - PubMed
    1. Allen IC, et al. NLRP12 suppresses colon inflammation and tumorigenesis through the negative regulation of noncanonical NF-kappaB signaling. Immunity. 2012;36:742–754. - PMC - PubMed