. 2017 Feb 20:343:240-249.
doi: 10.1016/j.neuroscience.2016.11.046. Epub 2016 Dec 9.

Axial levodopa-induced dyskinesias and neuronal activity in the dorsal striatum

Affiliations

Axial levodopa-induced dyskinesias and neuronal activity in the dorsal striatum

Stephanie L Alberico et al. Neuroscience. .

Abstract

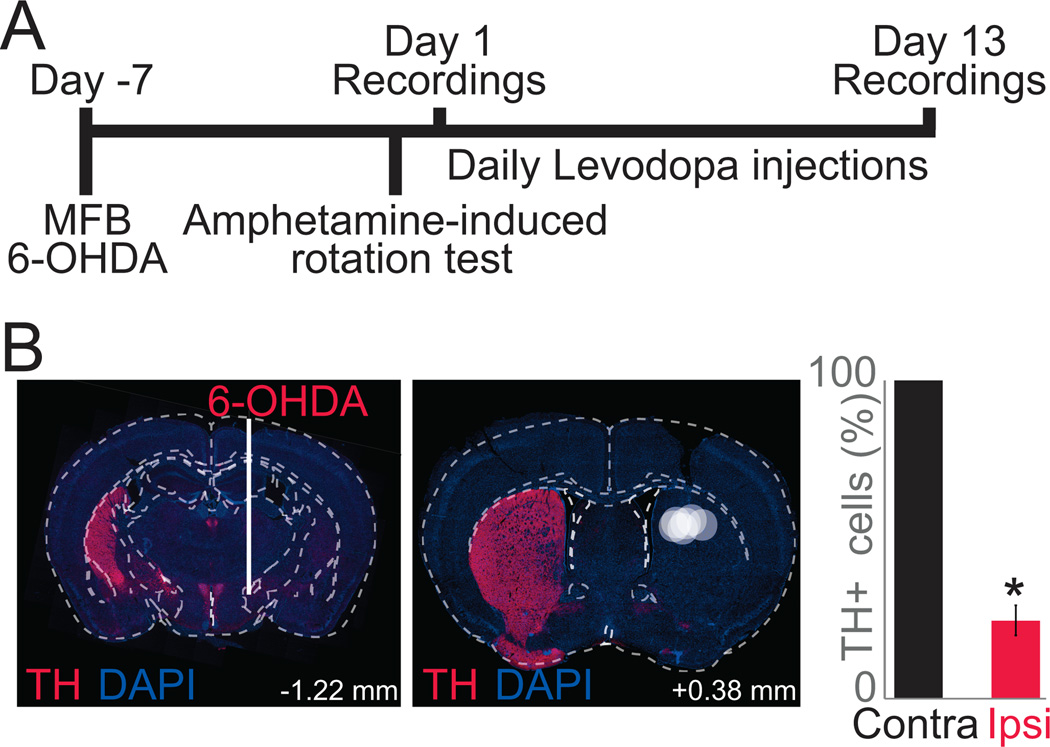
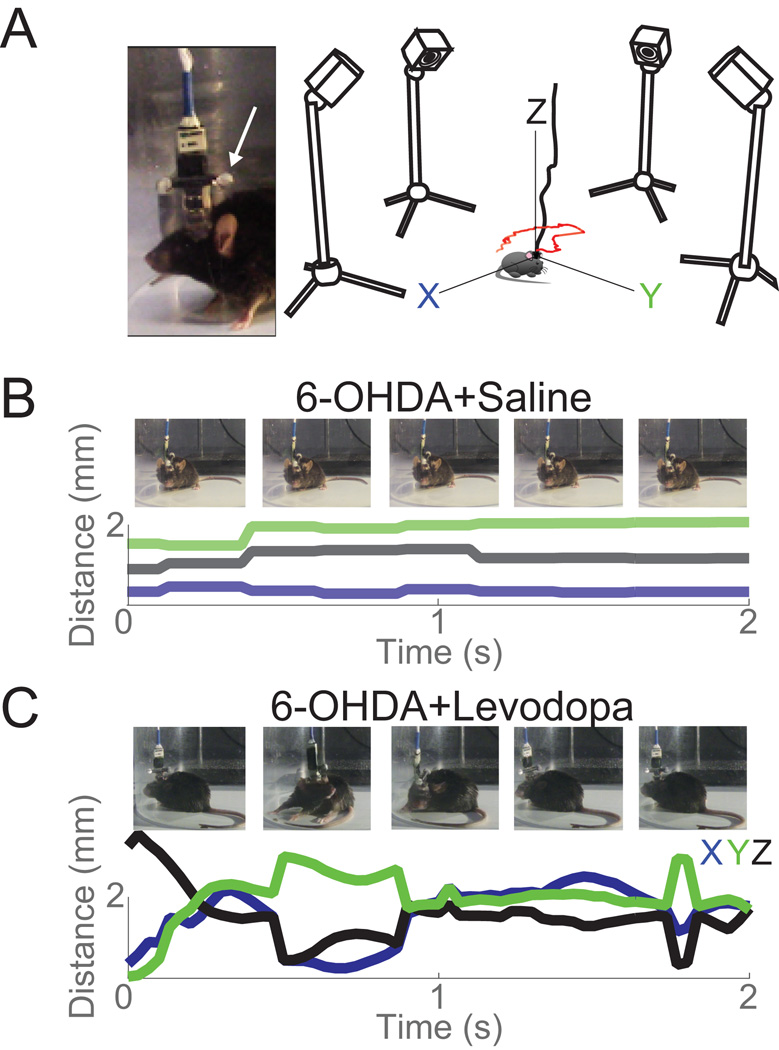
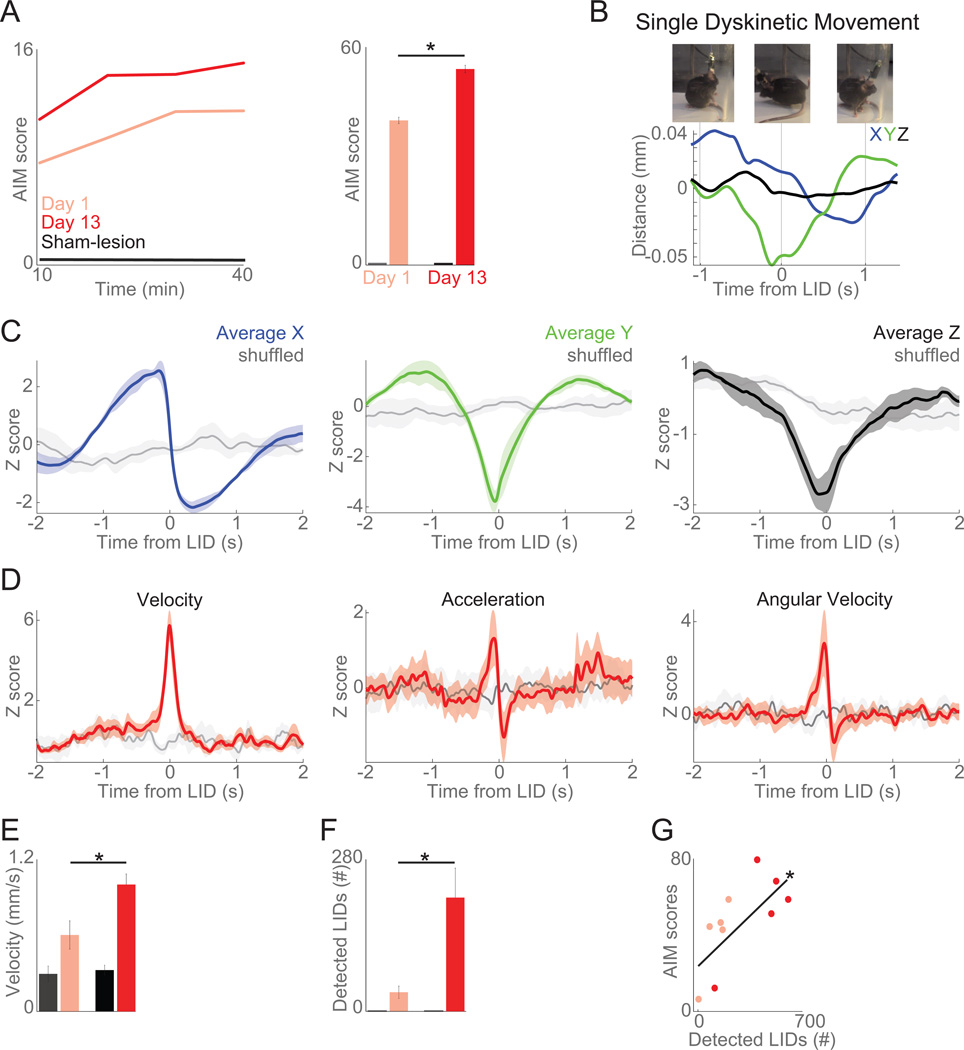
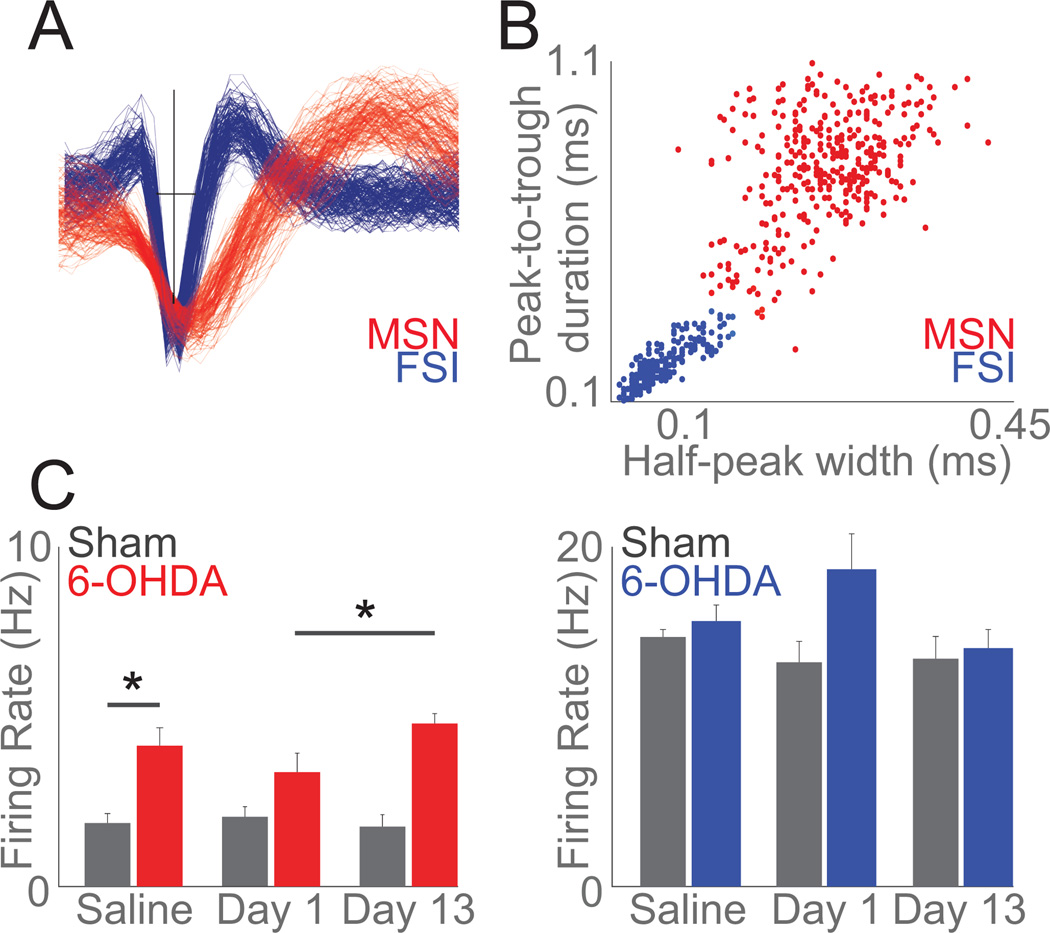
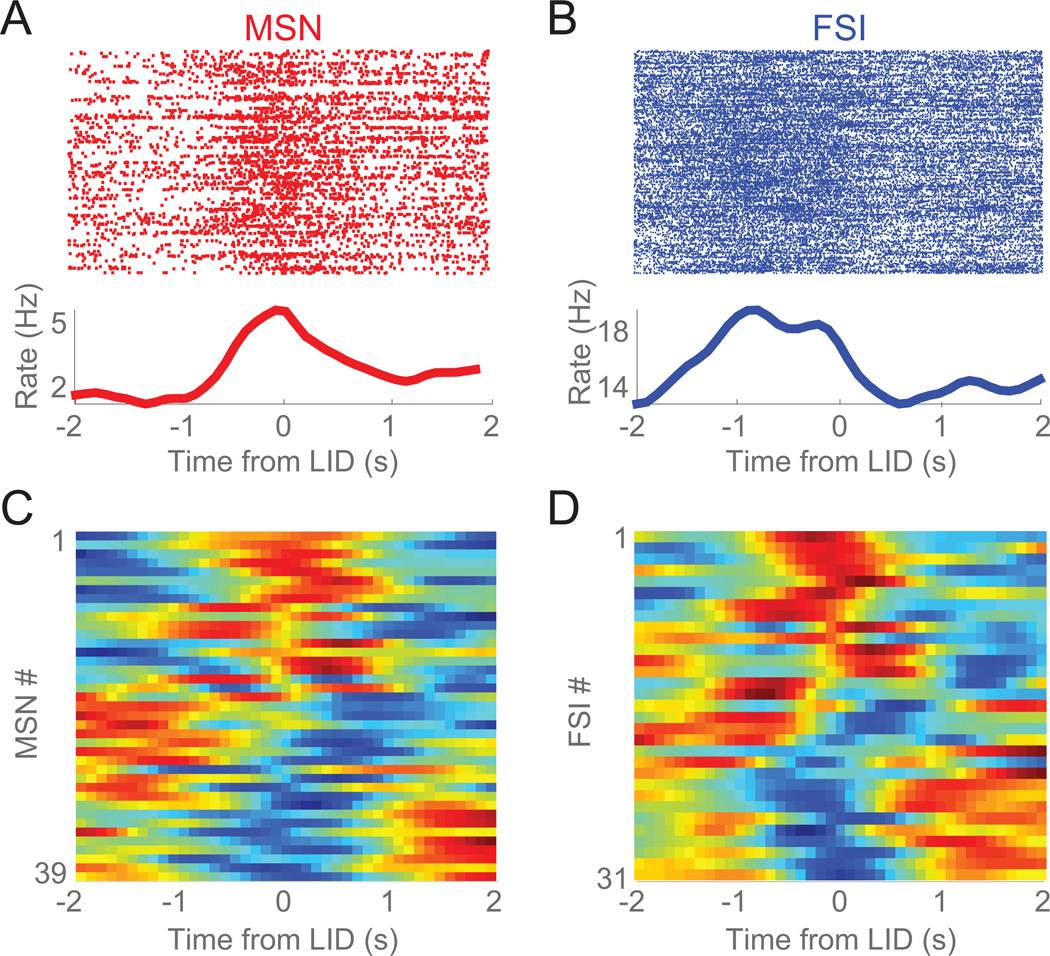
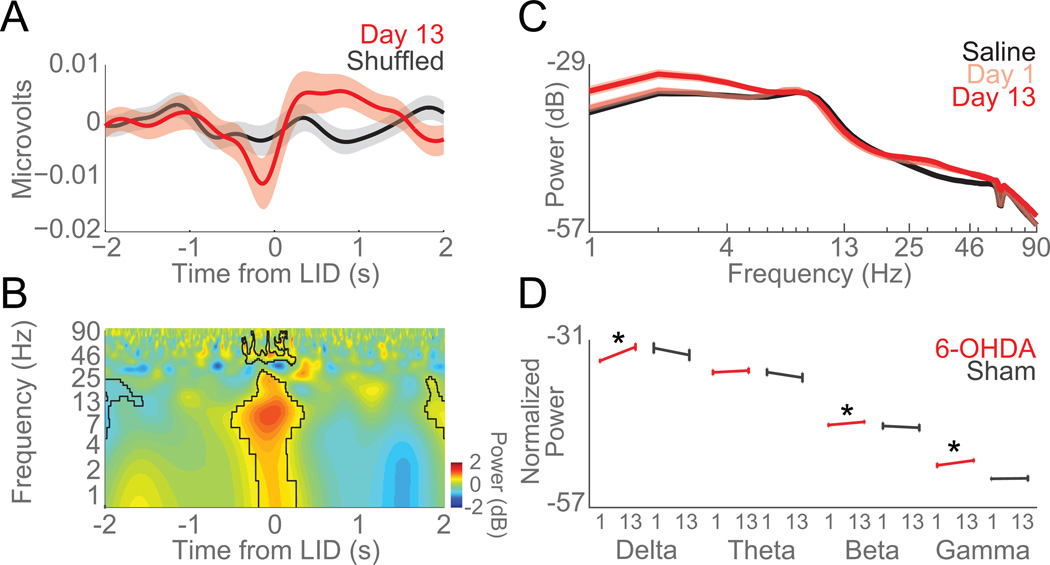
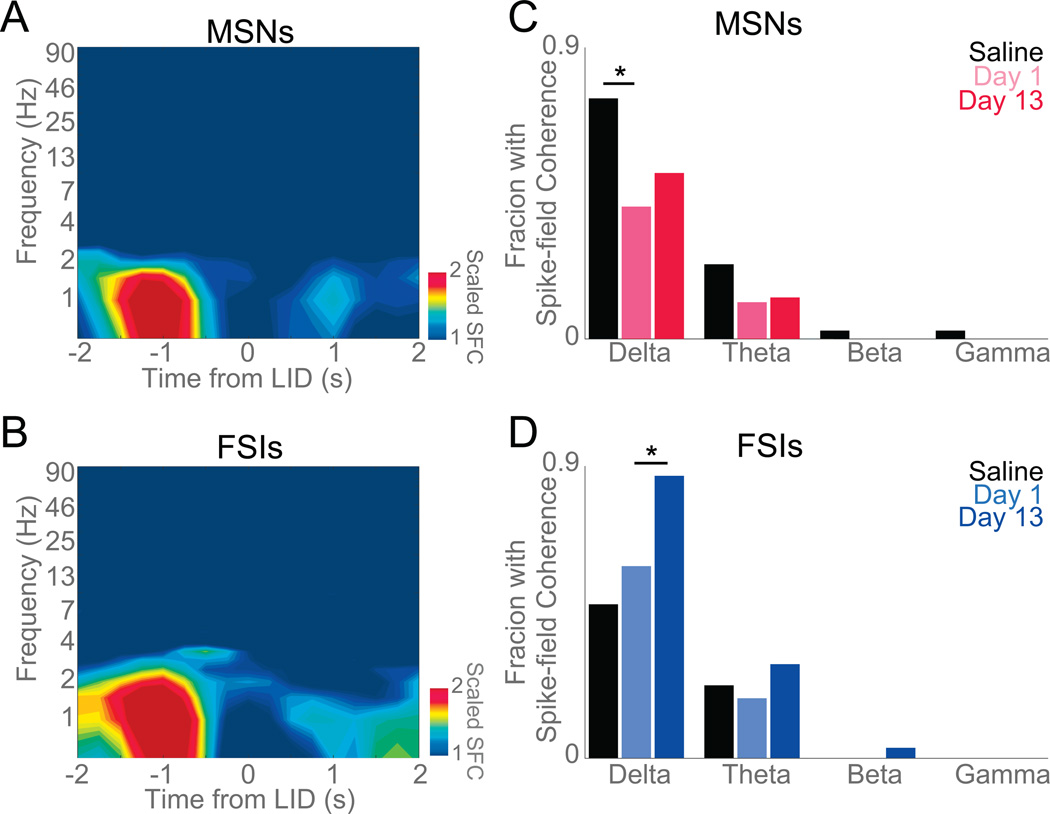
Levodopa-induced dyskinesias are abnormal involuntary movements that limit the effectiveness of treatments for Parkinson's disease. Although dyskinesias involve the striatum, it is unclear how striatal neurons are involved in dyskinetic movements. Here we record from striatal neurons in mice during levodopa-induced axial dyskinesias. We developed an automated 3-dimensional motion tracking system to capture the development of axial dyskinesias at ∼10ms resolution, and correlated these movements with neuronal activity of striatal medium spiny neurons and fast-spiking interneurons. The average firing rate of medium spiny neurons increased as axial dyskinesias developed, and both medium spiny neurons and fast-spiking interneurons were modulated around axial dyskinesias. We also found that delta field potential power increased in the striatum with dyskinesia, and that this increased delta power coupled with striatal neurons. Our findings provide insight into how striatal networks change as levodopa-induced dyskinesias develop, and suggest that increased medium spiny neuron firing, increased delta field potential power, and abnormal delta-coupling may be neurophysiological signatures of dyskinesias. These data could be helpful in understanding the role of the striatum in the pathogenesis of dyskinesias in Parkinson's disease.

Keywords: Parkinson’s disease; fast-spiking interneurons; levodopa-induced dyskinesia; medium spiny neurons; tracking.


Figures

Figure 1
Figure 1. Experimental timeline: mouse model of levodopa-induced dyskinesias
A) To model LIDs, we depleted dopamine unilaterally with a MFB 6-OHDA lesion and injected levodopa (20 mg/kg) for two weeks. We recorded striatal neuronal ensemble activity on Day 1 and 13 of levodopa administration. B) Location of MFB 6-OHDA lesion (left) via immunohistochemistry resulting in large loss of striatal dopamine in the dorsal striatum, where electrodes were implanted (right; TH in red; DAPI in blue). Each white circle represents electrode placement of one animal. Bar graph shows quantification of TH in the substantia nigra pars compacta. On average, animals had 71±5% less TH positive cells on the lesioned side (red) when compared to the contralateral side (black). Data from 5 lesioned mice. (*) p<0.05.
Figure 2
Figure 2. Tracking set-up
A) Inset: Picture of two infrared reflective spheres (white arrow) and recording electrode. Right: Diagram of 4 infrared cameras calibrated to track movements at 120 frames/s. B) Tracking examples (2 s) in a dopamine-depleted animal (6-OHDA) in the X (blue), Y (green), and Z (black) axes with corresponding still images. C) The same animal as in (B) with initial levodopa administration in the X (blue), Y (green), and Z (black) axes with corresponding still images.
Figure 3
Figure 3. Automated tracking of axial LIDs
A) With levodopa administration for two weeks, LIDs increased over time by AIM scoring in 6-OHDA-lesioned animals (5 animals) but not sham-lesioned animals (4 mice). B) Example traces from one mouse 1 s before and after a single hand-coded axial LID on all three axes (X: blue, Y: green, Z: black). C) Average displacement observed around the computer-identified axial LIDs in all three axes (X: blue, Y: green, Z: black) compared to shuffled events (noise, in gray; based on randomly selected timestamps). D) Around computer-identified events, there were large changes in velocity, acceleration, and angular velocity when compared to shuffled data (gray). E) Average velocity increased as LIDs developed, while acceleration and angular velocity did not. F) Computer-identified dyskinetic events increased as LIDs developed. G) Computer-detected LIDs and AIM scores were significantly correlated. These data indicate that automated motion tracking can capture axial dyskinesias. Data from five 6-OHDA-lesioned and four sham-lesioned mice. Error bars are mean ± SEM. (*) p<0.05.
Figure 4
Figure 4. Striatal MSNs increase firing rate as LIDs develop
A) Example waveforms of one MSN (red) and one FSI (blue) recorded from a single electrode. B) Clustering across peak-to-trough duration and half-peak-width identified 240 MSNs (red) and 146 FSIs (blue). C) Mean firing rate of MSNs increased following 6-OHDA lesion (Saline: sham-lesion (grey) vs 6-OHDA-lesioned in (red)) and as LIDs developed (Day 1 vs Day 13) while FSIs did not change as LIDs developed; data from 240 MSNs and 146 FSIs in 9 mice over 3 days. Error bars are mean ± SEM; (*) p<0.05.
Figure 5
Figure 5. Striatal neurons are modulated around levodopa-induced dyskinesias
A) Example of an MSN and B) an FSI showing prominent firing rate modulation around computer-identified axial dyskinesias (0 s, Time from LID). Top portions are raster plots where each line represents a time-coded LID and each dot represents an action potential of the neurons. Bottom portions are the average firing rate for that neuron for all time-coded LIDs. C) Firing rate changes for all MSNs and D) all FSIs around axial dyskinesias on Day 13.
Figure 6
Figure 6. Delta power in striatal local field potentials increases as LIDs develop
A) Voltage modulation of LFPs around axial dyskinesias (0 s, Time from LID). B) Time-frequency plot of LFPs around axial dyskinesias. Spectral power of LFP activity revealed significant modulations in delta, theta, and beta bands around axial dyskinesias vs. shuffled events (outlined in black). C) Spectral power of striatal LFPs on Saline (black), Day 1 (pink), and Day 13 (red) of levodopa administration. D) Error bar of average normalized power (dB) of 6-OHDA-lesioned mice (red) and sham-lesioned mice (grey) in each frequency band across days (Day 1 and Day 13). Delta, beta, and gamma power significantly increased as LIDs developed in 6-OHDA-lesioned mice (red). No changes were seen in mice with sham lesions (grey). Data from five 6-OHDA-lesioned and four sham-lesioned mice. Error bars are mean ± SEM. (*) p<0.05.
Figure 7
Figure 7. Striatal FSI delta spike-field coherence increases as LIDs develop
Normalized spike-field coherence around axial dyskinesias for A) MSNs and B) FSIs. All spike-field coherence was normalized to 95% significance; thus yellow and red indicate significant spike-field coherence. Data from 39 MSNs and 31 FSIs in five 6-OHDA-lesioned mice on Day 13 of levodopa. C) Initial administration of levodopa (Day 1) significantly reduced delta spike field-coherence in MSNs when compared to Saline but no change was detected as dyskinesias developed. D) FSIs significantly increased delta coherence as dyskinesias developed. Data from 5 mice. (*) p<0.05

References

    1. Ahlskog JE, Muenter MD. Frequency of levodopa-related dyskinesias and motor fluctuations as estimated from the cumulative literature. Mov Disord Off J Mov Disord Soc. 2001;16:448–458. - PubMed
    1. Alberico SL, Cassell MD, Narayanan NS. The Vulnerable Ventral Tegmental Area in Parkinson’s Disease. Basal Ganglia. 2015;5:51–55. - PMC - PubMed
    1. Aubert I, Guigoni C, Håkansson K, Li Q, Dovero S, Barthe N, Bioulac BH, Gross CE, Fisone G, Bloch B, Bezard E. Increased D1 dopamine receptor signaling in levodopa-induced dyskinesia. Ann Neurol. 2005;57:17–26. - PubMed
    1. Barter JW, Li S, Lu D, Bartholomew RA, Rossi MA, Shoemaker CT, Salas-Meza D, Gaidis E, Yin HH. Beyond reward prediction errors: the role of dopamine in movement kinematics. [Accessed January 26, 2016];Front Integr Neurosci. 2015a 9 Available at: http://www.ncbi.nlm.nih.gov/pmc/articles/PMC4444742/ - PMC - PubMed
    1. Barter JW, Li S, Sukharnikova T, Rossi MA, Bartholomew RA, Yin HH. Basal Ganglia Outputs Map Instantaneous Position Coordinates during Behavior. J Neurosci. 2015b;35:2703–2716. - PMC - PubMed

Publication types