

Detecting prediabetes among Hispanics/Latinos from diverse heritage groups: Does the test matter? Findings from the Hispanic Community Health Study/Study of Latinos
- PMID: 27956225
- PMCID: PMC5290333
- DOI: 10.1016/j.ypmed.2016.12.009
Detecting prediabetes among Hispanics/Latinos from diverse heritage groups: Does the test matter? Findings from the Hispanic Community Health Study/Study of Latinos
Abstract
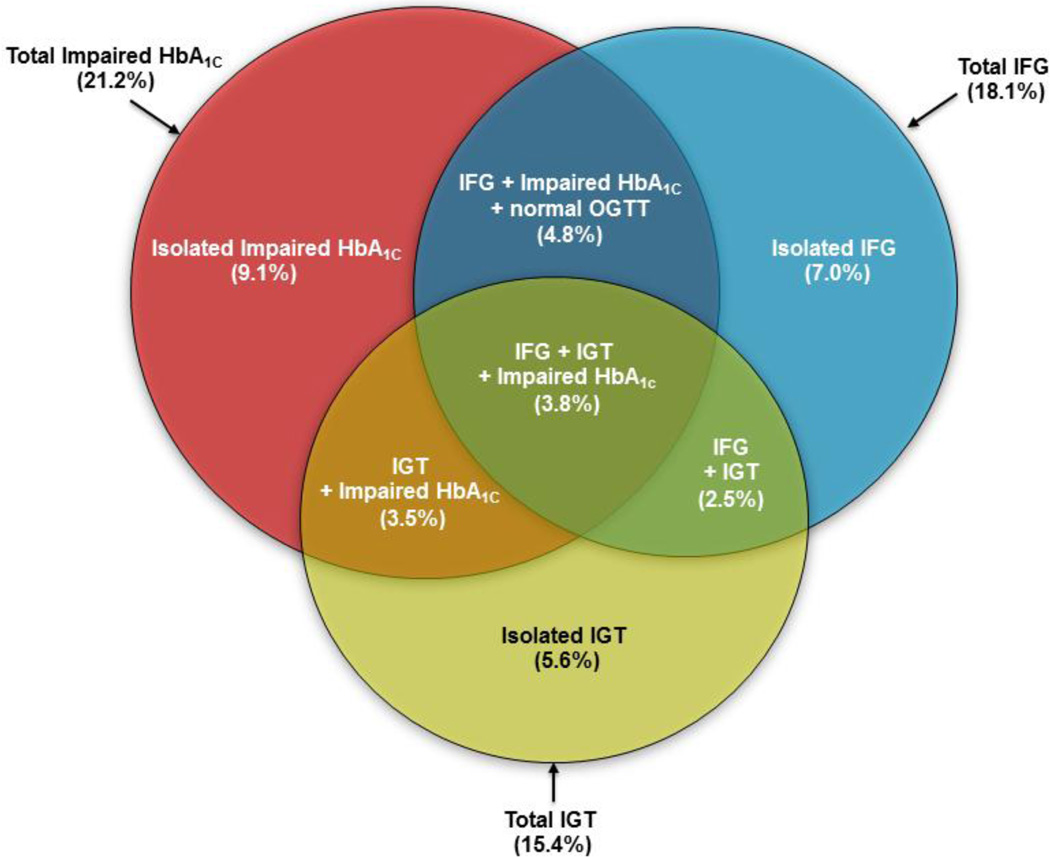
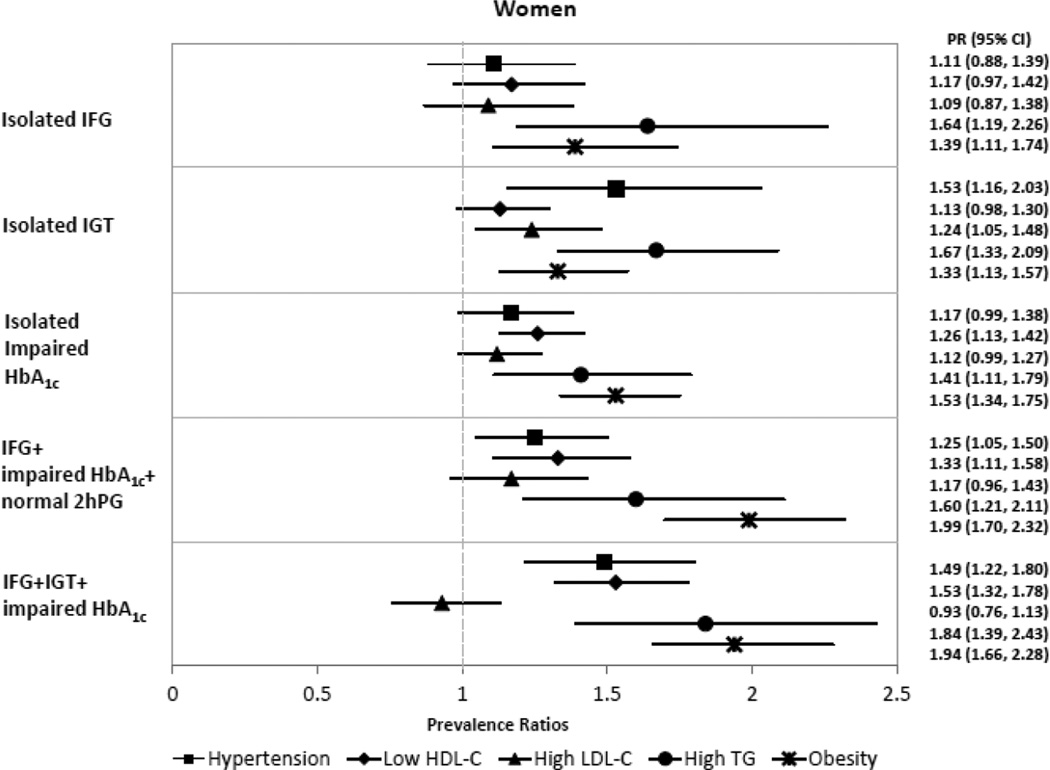
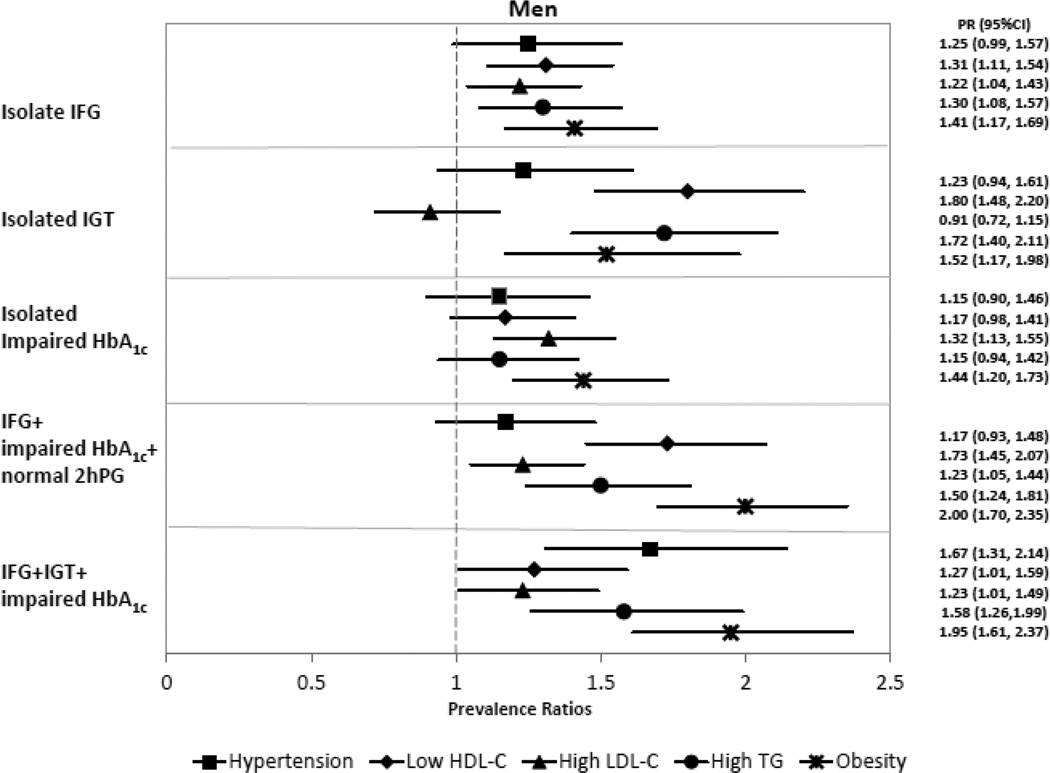
The objectives of this analysis were to compare the ability of fasting plasma glucose (FPG), post oral load plasma glucose (2hPG), and hemoglobin A1c (HbA1c) to identify U.S. Hispanic/Latino individuals with prediabetes, and to assess its cardiovascular risk factor correlates. This is a cross-sectional analysis of baseline data from 15,507 adults without self-reported diabetes mellitus from six Hispanic/Latino heritage groups, enrolled in the Hispanic Community Health Study/Study of Latinos, which takes place in four U.S. communities. The prevalence of prediabetes was determined according to individual or combinations of ADA-defined cut points: FPG=5.6-7.0mmol/L, 2hPG=7.8-11.1mmol/L, and HbA1c=5.7%-6.4% (39-46mmol/mol). The sensitivity of these criteria to detect prediabetes was estimated. The prevalence ratios (PRs) for selected cardiovascular risk factors were compared among alternative categories of prediabetes versus normoglycemia [FPG<5.6mmol/L and 2hPG<7.8mmol/L and HbA1c<5.7% (39mmol/mol)]. Approximately 36% of individuals met any of the ADA prediabetes criteria. Using 2hPG as the gold standard, the sensitivity of FPG was 40.1%, HbA1c was 45.6%, and that of HbA1c+FPG was 62.2%. The number of significant PRs for cardiovascular risk factors was higher among individuals with isolated 2hPG=7.8-11.1mmol/L, FPG=5.6-7.0mmol/L+HbA1c=5.7%-6.4%, or those who met the three prediabetes criteria. Assessing FPG, HbA1c, and cardiovascular risk factors in Hispanics/Latinos at risk might enhance the early prevention of diabetes mellitus and cardiovascular complications in this young and growing population, independent of their heritage group.
Keywords: Hispanics; Hypertension; LDL cholesterol; Latinos; Obesity; Prediabetic state; Triglycerides.
Published by Elsevier Inc.
Conflict of interest statement
The authors do not have conflicts to declare.
Figures
References
MeSH terms
Substances
Grants and funding
LinkOut - more resources
Full Text Sources
Other Literature Sources
Medical
Research Materials
Miscellaneous
