. 2016 Dec 12;213(13):2989-3005.
doi: 10.1084/jem.20160817. Epub 2016 Nov 9.

Modeling synovial sarcoma metastasis in the mouse: PI3'-lipid signaling and inflammation

Affiliations

Modeling synovial sarcoma metastasis in the mouse: PI3'-lipid signaling and inflammation

Jared J Barrott et al. J Exp Med. .

Abstract

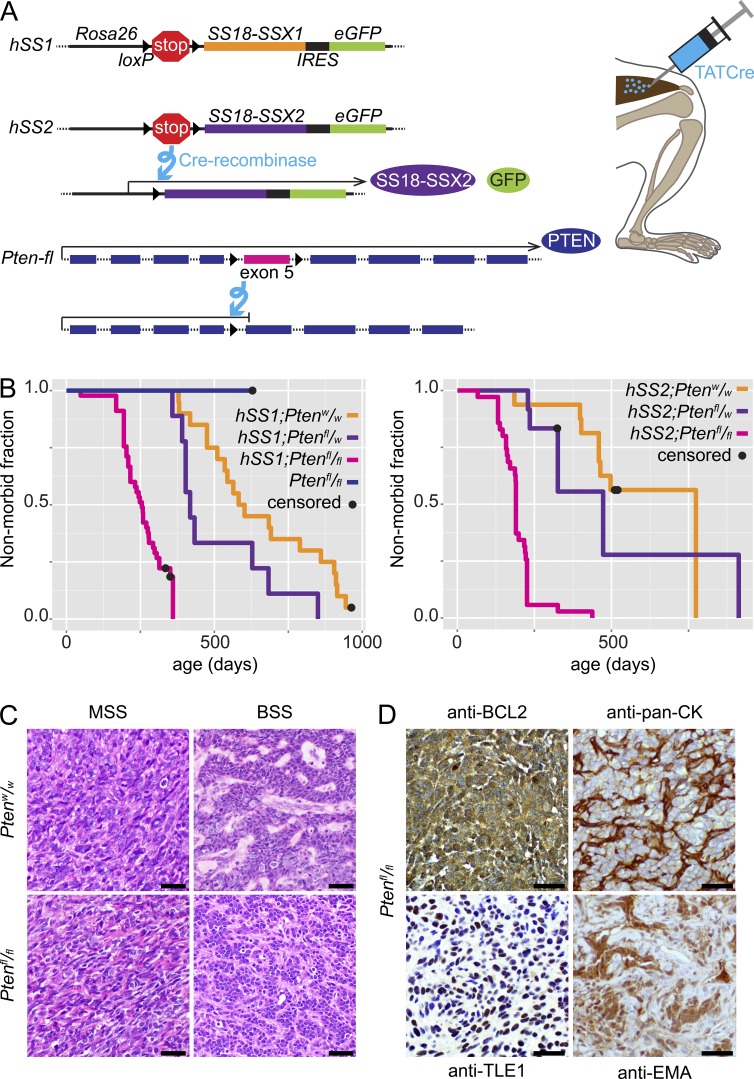
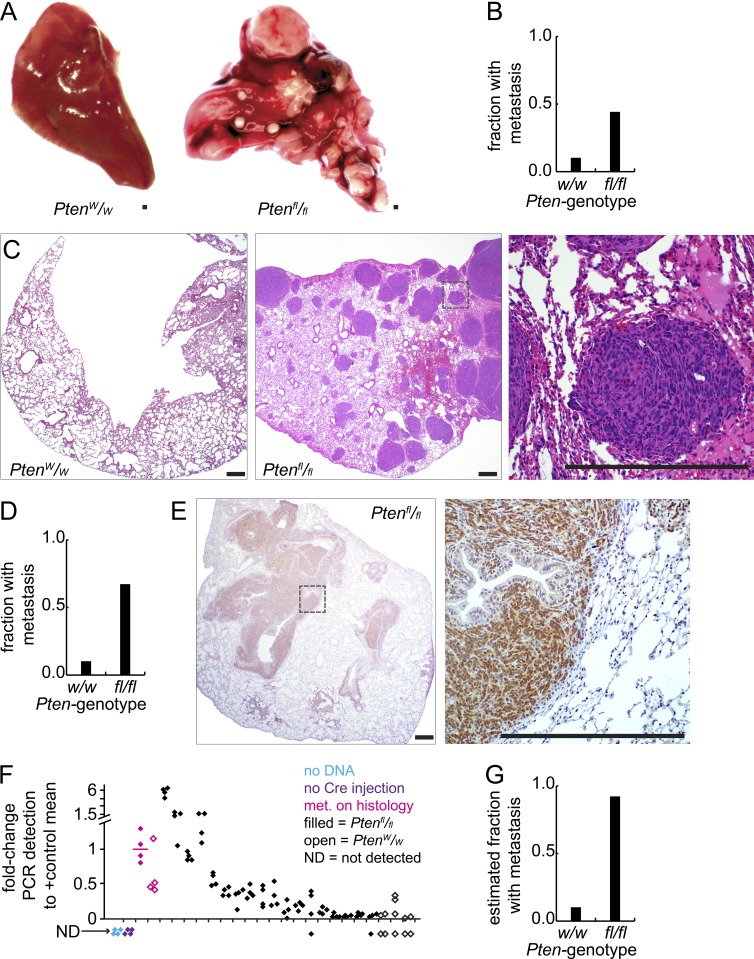
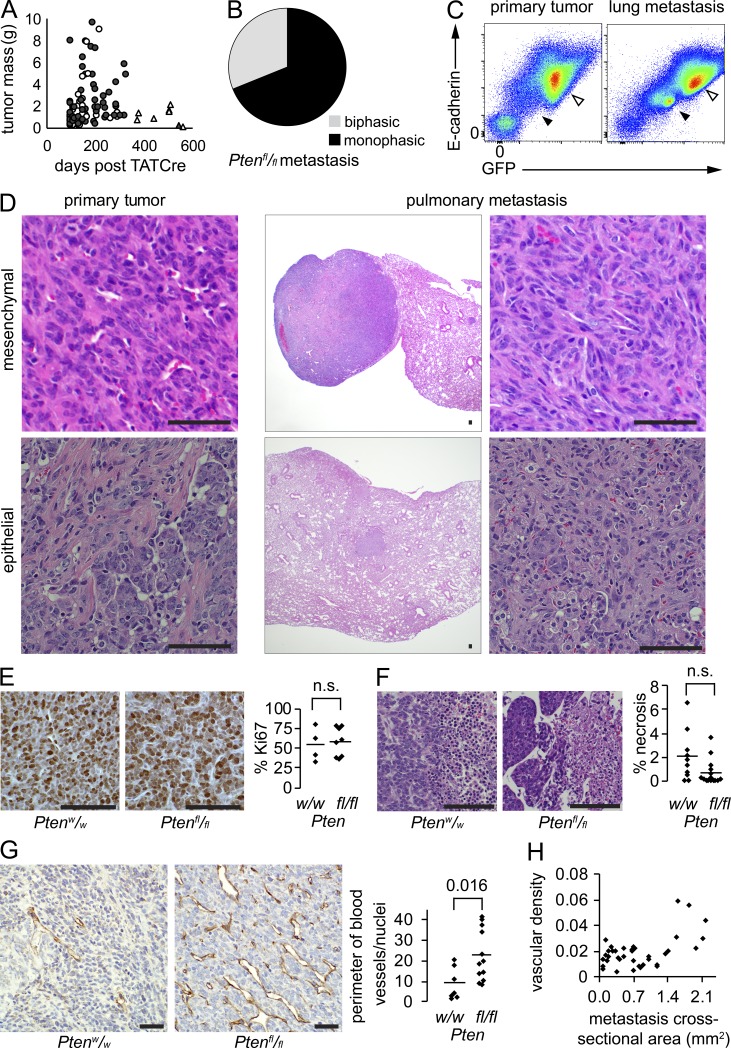
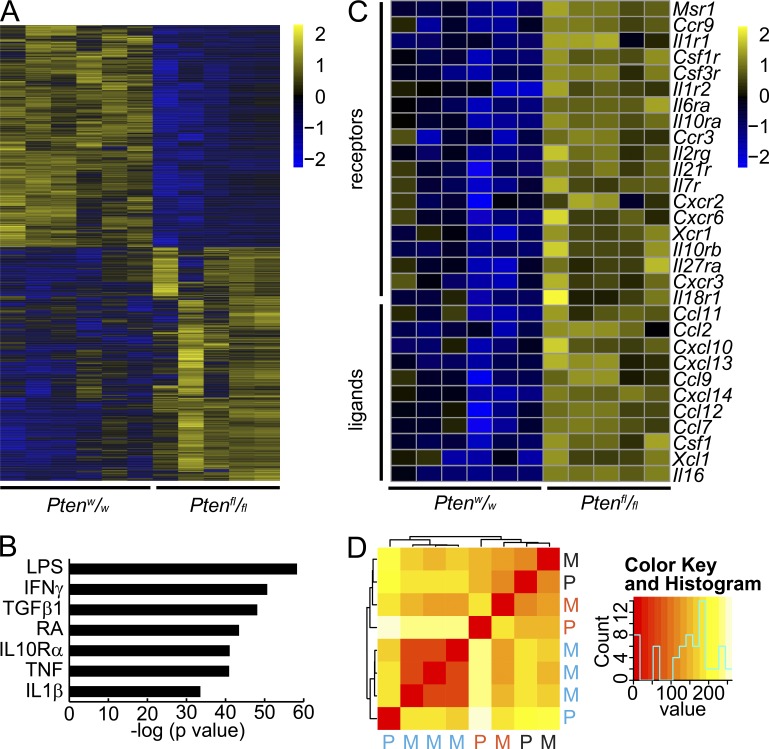
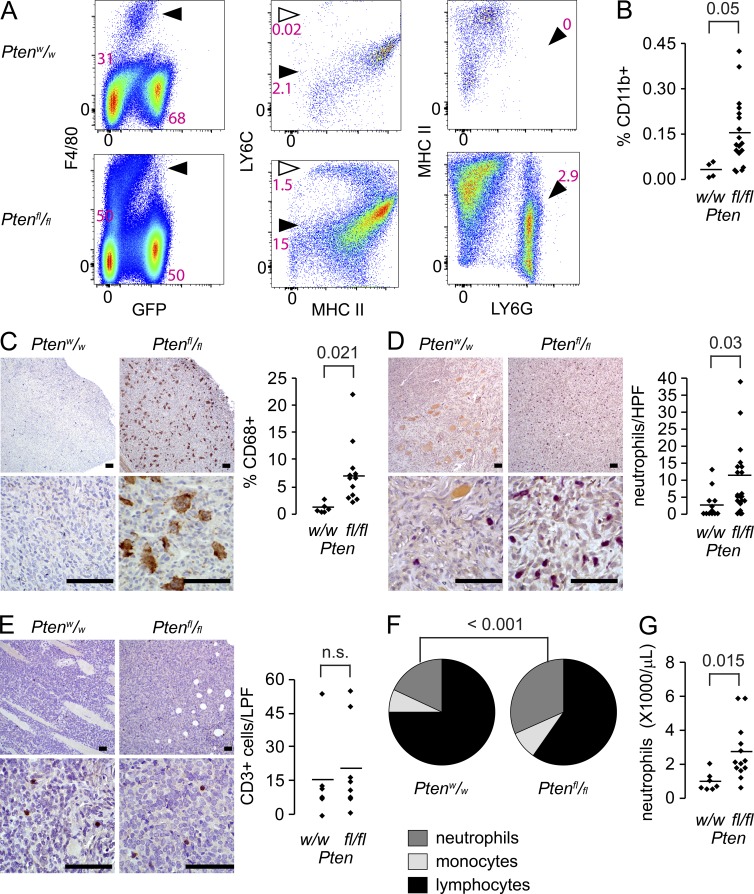
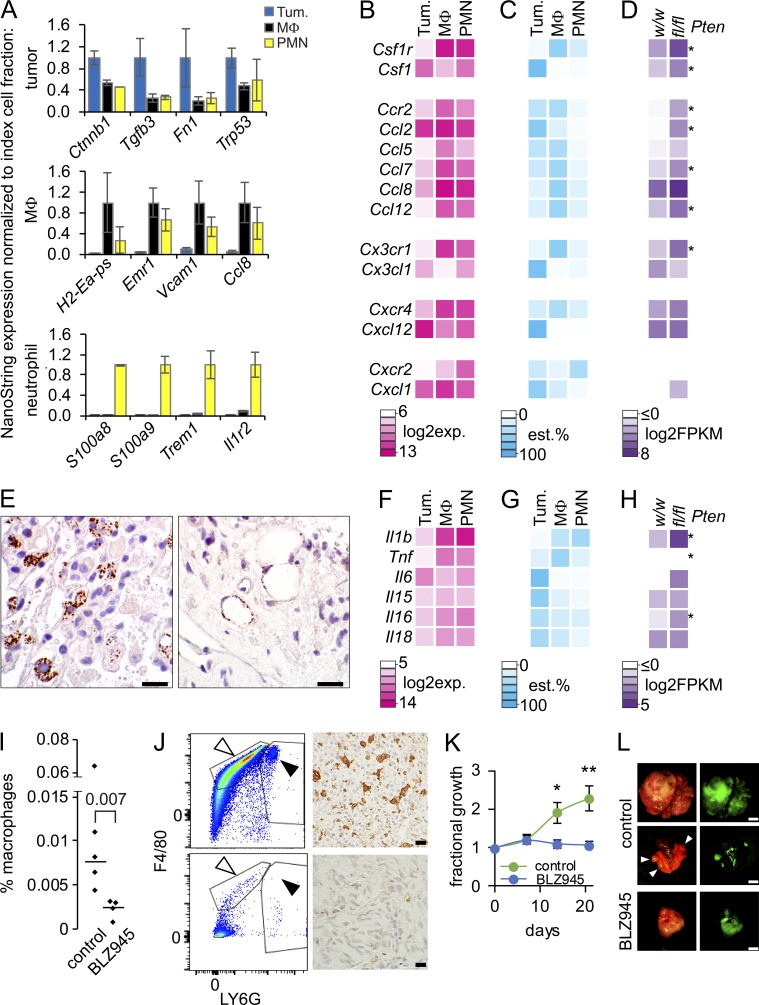
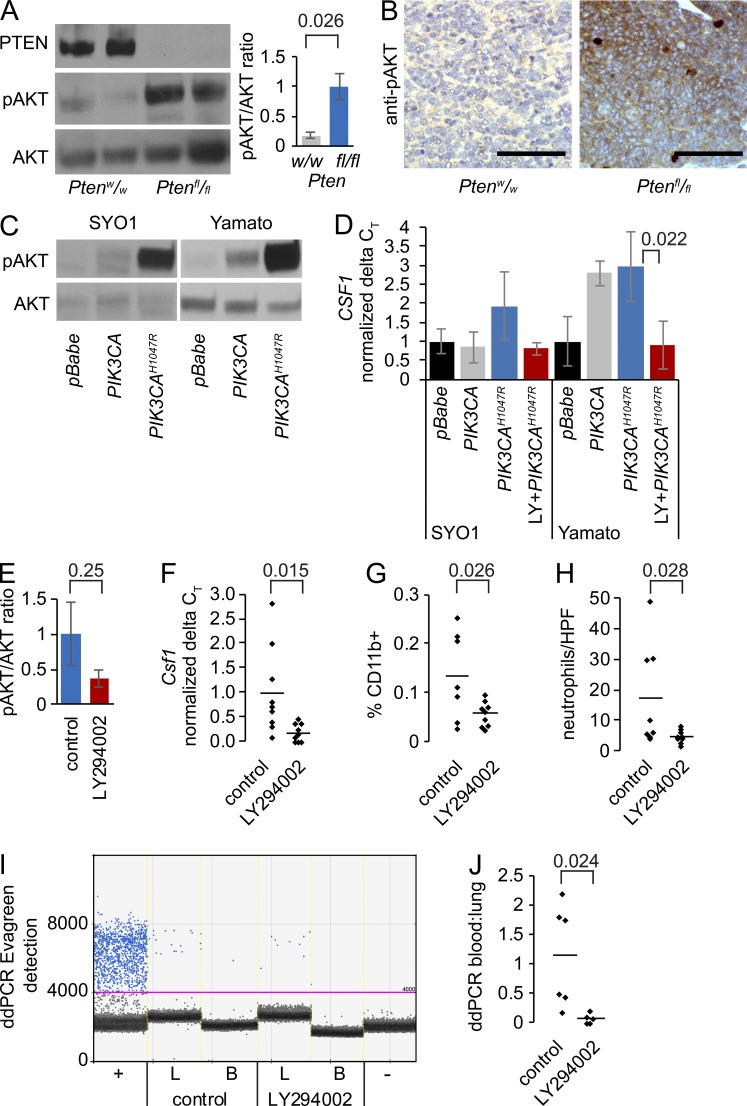
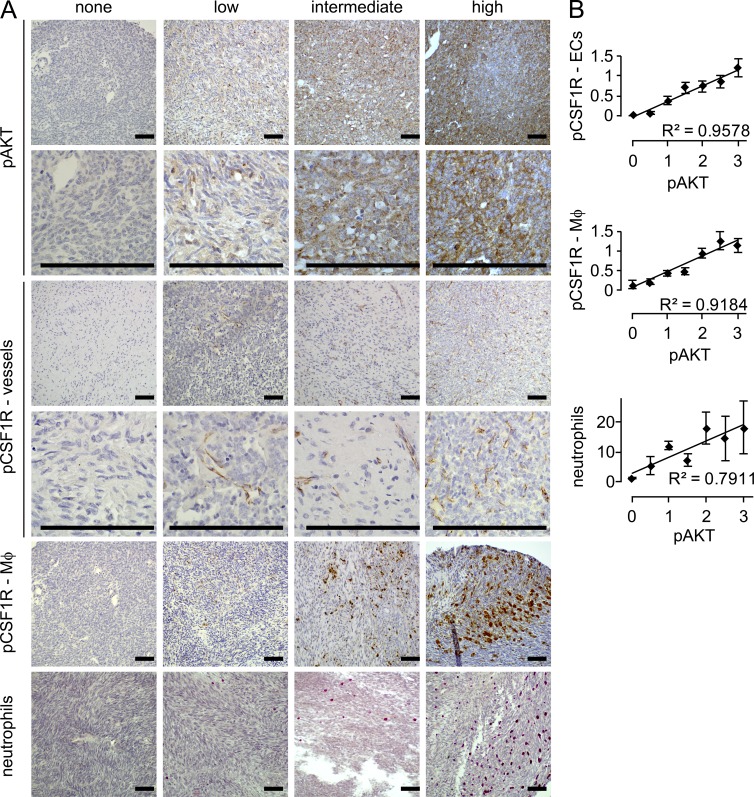
Solid tumor metastasis is a complex biology, impinged upon by a variety of dysregulated signaling pathways. PI3'-lipid signaling has been associated with metastasis and inflammation in many cancers, but the relationship between tumor cell-intrinsic PI3'-lipid signaling and inflammatory cell recruitment has remained enigmatic. Elevated PI3'-lipid signaling associates with progression of synovial sarcoma, a deadly soft tissue malignancy initiated by a t(X;18) chromosomal translocation that generates an SS18-SSX fusion oncoprotein. Here, we show in genetically engineered mouse models of locally induced expression of SS18-SSX1 or SS18-SSX2 that Pten silencing dramatically accelerated and enhanced sarcomagenesis without compromising synovial sarcoma characteristics. PTEN deficiency increased tumor angiogenesis, promoted inflammatory gene expression, and enabled highly penetrant spontaneous pulmonary metastasis. PTEN-deficient sarcomas revealed infiltrating myeloid-derived hematopoietic cells, particularly macrophages and neutrophils, recruited via PI3'-lipid-induced CSF1 expression in tumor cells. Moreover, in a large panel of human synovial sarcomas, enhanced PI3'-lipid signaling also correlated with increased inflammatory cell recruitment and CSF1R signal transduction in both macrophages and endothelial cells. Thus, both in the mouse model and in human synovial sarcomas, PI3'-lipid signaling drives CSF1 expression and associates with increased infiltration of the monocyte/macrophage lineage as well as neutrophils.


Figures

Figure 1.
Figure 1.
Pten silencing enhances synovial sarcomagenesis. (A) Schematic of alleles, recombination products, and TATCre injection technique (IRES, internal ribosomal entry site). (B) Kaplan-Meier plots of the nonmorbid fraction of hSS1 (left) or hSS2 (right) mice with Pten genotypes of homozygous wild-type (n = 20 and 16 for hSS1 and hSS2, respectively), heterozygous (n = 9 and 12), or homozygous-floxed (n = 45 and 35), injected at age 1 mo with TATCre in the hindlimb. Pten homozygous floxed mice with wild-type Rosa26, also injected at 1 mo with TATCre, are presented on the hSS1 plot (n = 6). Statistical difference (Log-rank test) between Ptenw/w and Ptenfl/fl for hSS1, P = 0.0004, and for hSS2, P = 0.0173. (C) Photomicrographs of H&E histology examples of monophasic (MSS) and biphasic (BSS) SS18-SSX-induced synovial sarcomas from each Pten genotype in TATCre-injected mice. (D) Photomicrographs after immunohistochemistry on hSS;Ptenfl/fl tumor tissue sections with noted primary antibodies, demonstrating characteristic SS staining patterns. Bars, 25 µm.
Figure 2.
Figure 2.
Pten silencing promotes synovial sarcoma metastasis. (A) Gross photomicrographs of pulmonary lobes from hSS;Ptenw/w and hSS;Ptenfl/fl mice that were injected with TATCre at age 1 mo. (B) Graph depicts the fraction of mice in each group with metastasis detectable by gross inspection alone (hSS;Ptenw/w, n = 10, hSS;Ptenfl/fl, n = 88). (C) Low power H&E photomicrographs of lungs from mice bearing control or Pten-silenced tumors, as well as higher power H&E (right, from box in center image). (D) Graph depicts the fraction of mice in each group with metastasis detectable by histology. (E) Photomicrographs of lungs from tumor bearing hSS;Ptenfl/fl mice, demonstrating immunohistochemistry against GFP (indicates SS18-SSX expression). (F) Quantitative PCR results from lung tissue derived from tumor-bearing mice for the recombined Rosa26 locus as a marker of disseminated tumor cells. Two positive control samples that demonstrated metastasis (met.) on histology (one of each Pten genotype are noted in magenta), followed by testing for additional samples of each genotype without histologically detectable metastasis. Data points represent four technical replicates for each biological sample. (G) Graph depicts the estimated combined fraction of mice in each group with disseminated tumor cells detected by gross dissection, histology, or qPCR. Bars, 250 µm.
Figure 3.
Figure 3.
Pten silencing drives increased vascularity in synovial sarcoma. (A) Plot of tumor mass at harvest against time elapsed after TATCre injection into mice bearing conditional SS18-SSX and either Ptenw/w (triangles) or Ptenfl/fl (circles). Filled shapes indicate tumors with associated histologically detected metastasis. (B) Pie chart demonstrating histological subtype fractions for metastatic tumors in hSS;Ptenfl/fl mice (n = 59). (C) Flow cytometry of a primary tumor and lung metastasis stained with E-cadherin and analyzed for intrinsic GFP expression. Tumor population (open arrow) and endothelial cells (filled arrow) both express higher levels of E-cadherin than the immune infiltrates (lower left). (D) Example photomicrographs of tumors with retained histological appearance between primary tumor and metastasis. (E) Example anti–Ki-67 immunohistochemistry photomicrographs and chart of proliferative indices for SS18-SSX-induced tumors in each Pten genotype (student’s t test). (F) Example H&E photomicrographs of necrosis (right side of each) identified in tumors and graph of the mean necrotic area per tumor cross section by histology (Student’s t test). (G) Example anti-CD31 immunohistochemistry photomicrographs demonstrating vascular density in hSS tumors arising with wild-type or silenced Pten. Graph presents mean vascular density in primary tumors of each genotype (Student’s t test). (H) Plot of vascular density indicated as vessel perimeter per cross-sectional area against cross-sectional area of each metastasis in hSS;Ptenfl/fl mice. Bars, 50 µm.
Figure 4.
Figure 4.
Pten silencing in synovial sarcoma drives an inflammatory transcriptome. (A) Heat map demonstrating the expression of 4,051 genes that are twofold and significantly differentially expressed between TATCre induced SS18-SSX–expressing tumors of either homozygous wild-type (w/w) or homozygous floxed (fl/fl) Pten genotype. (B) Plot of the P-values of the most significant Ingenuity Pathway Analysis results for likely upstream regulators of the differential expression between tumors of the two Pten genotypes (RA, retinoic acid; others are gene symbols; right tailed Fisher Exact Test and Benjamini-Hochberg correction for multiple testing). (C) Heat map of inflammatory receptors and ligands that can lead to recruitment of myeloid cells into tissues. (D) Nonhierarchical heat map clustering of primary (P) and metastatic (M) tumors color coded by individual mouse hosts.
Figure 5.
Figure 5.
Pten silencing associates with increased infiltration of myeloid-derived cells. (A) Example flow cytometry comparing an hSS;Ptenw/w tumor (top) to an hSS;Ptenfl/fl tumor (bottom) for F4/80+/GFP monocytes/macrophages (arrowhead, left plot), their MHCII+/Ly6Chigh newly recruited monocyte (open arrow, middle plot) and MHCII+/Ly6Cmid tissue macrophage (filled arrowhead, middle plot) subpopulations, and Ly6C+/Ly6G+ neutrophils (arrowhead, right plot). (PE, phycoerythrin; APC, allophycocyanin; PerCP, perdinin chlorophyll protein). (B) Graph comparing the percent of infiltrating CD11B+ cells in hSS tumors of each Pten genotype (Student’s t test). (C) Representative low and high power photomicrographs and quantitation of CD68+ monocytes/macrophages (brown) by immunohistochemistry in hSS;Ptenw/w and hSS;Ptenfl/fl tumors (Student’s t test). (D) Representative low and high power photomicrographs and quantitation per high power field (HPF) of Leder cytochemically stained neutrophils (magenta) in hSS;Ptenw/w and hSS;Ptenfl/fl tumors (Student’s t test). (E) Representative photomicrographs of CD3 immunohistochemistry in hSS;Ptenw/w and hSS;Ptenfl/fl primary tumors and an associated graph demonstrating low and equivalent numbers of CD3+ lymphocytes (Student’s t test). (F) Pie charts presenting the mean fractions of neutrophils, monocytes, and lymphocytes in the peripheral blood of morbid tumor-bearing hSS;Ptenw/w and hSS;Ptenfl/fl mice (n = 7 and 13, respectively; Chi-squared test). (G) Graph of peripheral blood neutrophil counts in morbid tumor-bearing hSS;Ptenw/w and hSS;Ptenfl/fl mice (Student’s t test). Bars, 50 µm. Graph points present individual tumors; bars present means.
Figure 6.
Figure 6.
Pten silencing enhanced synovial sarcoma cells express Csf1. (A) Nanostring expression graphs of marker genes for each cellular fraction from whole hSS;Ptenfl/fl tumors, with expression normalized to that in each index cell type (MΦ, macrophage; PMN, polymorphonuclear cell or neutrophil). (B) NanoString expression levels heat map of macrophage recruitment receptors and their corresponding ligands in each source cell fraction of tumors. (C) Heat map of the estimated (est.) percent contribution to each gene’s overall expression in the tumor from each source cell fraction, generated by normalizing the NanoString expression by the mean numerical fraction of cells. (D) Heat map of the mean log2-transformed FPKM expression level for each gene in hSS;Ptenw/w and hSS;Ptenfl/fl tumors. *, P < 0.05. (E) Photomicrograph of immunohistochemistry with an anti-pCSF1R antibody, demonstrating macrophages (left) and endothelial cells (right) in a tumor section actively receiving and transducing CSF1 signal. Bar, 10 µm. (F–H) Heat maps as in B–D, but of neutrophil stimulants. Notably, G-CSF (Csf3) and GM-CSF (Csf2) were not significantly expressed by tumors in whole transcriptome profiling, with or without Pten silencing. (I) Graph comparing the percent macrophage population in control tumors or tumors treated with BLZ945. Statistical test did not include outlier in control with high percentage of macrophage (Student’s t test). (J) Representative flow cytometry demonstrating a decreased population of macrophages in the BLZ945-treated tumors (bottom) compared with control (top). Photomicrograph of immunohistochemistry with an anti-CD68 antibody, showing a decrease in macrophages in BLZ945 treated tumors (bottom) compared with control (top). (K) Graph of percent tumor growth over baseline for 21 d of treatment with or without 200 mg/kg of BLZ945. *, P < 0.05; **, P < 0.01. n = 5 per group, Student’s t test. (L) Examples of photomicrographs of control tumors and BLZ945-treated tumors with corresponding GFP expression demonstrating the twofold increase in control tumor volume. Middle panel is control lungs with grossly visible metastases (arrowheads). Bars: (black) 10 µm; (white) 5 mm.
Figure 7.
Figure 7.
PI3′-lipid signaling drives CSF1 expression in synovial sarcoma. (A) Representative Westerns for PTEN, pAKT, and AKT in hSS;Ptenw/w and hSS;Ptenfl/fl tumors, with quantitation from four tumors from each. Performed independently four times with eight different hSS;Ptenfl/fl tumors and four different hSS;Ptenw/w (Student’s t test). (B) Representative photomicrographs of pAKT immunohistochemistry in hSS;Ptenw/w and hSS;Ptenfl/fl tumors. (C) Westerns for pAKT and AKT from two human SS cell lines transfected with empty vector (pBabe), wild-type PIK3CA, or constitutively active mutant PIK3CA (H1047R). Performed independently three times. (D) Graph of RT-qPCR expression of CSF1 in cell lines transfected with empty vector, wild-type PIK3CA, or constitutively active mutant PIK3CA (H1047R) with or without PI3′-lipid kinase inhibition with LY294002 (noted as LY). Performed independently at least three times (Student’s t test). (E) Graph of the mean ± SE of the pAKT suppression (not significant) in hSS;Ptenfl/fl tumors treated in vivo for 1 wk with 70 mg/kg body mass LY294002 or vehicle control (Student’s t test). (F) Graph of the reduced Csf1 expression by RT-qPCR in hSS;Ptenfl/f tumors treated in vivo for 1 wk with LY294002 or control (Student’s t test). (G) Graph of the percent CD11B+ cells by flow cytometry in hSS;Ptenfl/fl tumors treated in vivo for 1 wk with LY294002 or control (Student’s t test). (H) Graph of the neutrophil counts by Leder stain in tissue sections from hSS;Ptenfl/fl tumors treated in vivo for 1 wk with LY294002 or control (Student’s t test). (I) Digital droplet PCR from lung tissue (L) and blood (B) derived from tumor-bearing mice for the recombined Rosa26 locus as a marker of disseminated tumor cells after tumors were treated in vivo for 1 wk with LY294002 or control. Primary tumor was used as a positive control (+) and hSS;Ptenfl/fl mouse blood without TATCre was used as a negative control (-). (J) Graph of the ratio of tumor DNA detected in the blood to lungs of hSS;Ptenfl/fl mice treated in vivo for 1 wk with LY294002 or control (Student’s t test).
Figure 8.
Figure 8.
Tumor-infiltrating myeloid cells correlate with pAKT in human synovial sarcoma. (A) Representative photomicrographs of blinded scoring of a human tissue microarray with 191 cases of human synovial sarcoma for immunohistochemistry against tumor cell staining against pAKT, endothelial cell staining for pCSF1R, macrophage (MΦ) staining for pCSF1R, and cytochemical Leder staining for neutrophils. (B) Plots of correlation between categorical pAKT staining (mean between two TMA samples per tumor) and the endothelial pCSF1R staining, macrophage pCSF1R staining, and Leder-stained neutrophil counts. Linear regression correlation was calculated with the R2 values being provided. A single-factor ANOVA was also performed on pCSF1R values between the different pAKT bins.

References

    1. Abate-Shen C., Banach-Petrosky W.A., Sun X., Economides K.D., Desai N., Gregg J.P., Borowsky A.D., Cardiff R.D., and Shen M.M.. 2003. Nkx3.1; Pten mutant mice develop invasive prostate adenocarcinoma and lymph node metastases. Cancer Res. 63:3886–3890. - PubMed
    1. Ali I.U., Schriml L.M., and Dean M.. 1999. Mutational spectra of PTEN/MMAC1 gene: a tumor suppressor with lipid phosphatase activity. J. Natl. Cancer Inst. 91:1922–1932. 10.1093/jnci/91.22.1922 - DOI - PubMed
    1. Bald T., Quast T., Landsberg J., Rogava M., Glodde N., Lopez-Ramos D., Kohlmeyer J., Riesenberg S., van den Boorn-Konijnenberg D., Hömig-Hölzel C., et al. 2014. Ultraviolet-radiation-induced inflammation promotes angiotropism and metastasis in melanoma. Nature. 507:109–113. 10.1038/nature13111 - DOI - PubMed
    1. Barretina J., Taylor B.S., Banerji S., Ramos A.H., Lagos-Quintana M., Decarolis P.L., Shah K., Socci N.D., Weir B.A., Ho A., et al. 2010. Subtype-specific genomic alterations define new targets for soft-tissue sarcoma therapy. Nat. Genet. 42:715–721. 10.1038/ng.619 - DOI - PMC - PubMed
    1. Barrott J.J., Illum B.E., Jin H., Zhu J.F., Mosbruger T., Monument M.J., Smith-Fry K., Cable M.G., Wang Y., Grossmann A.H., et al. 2015. β-catenin stabilization enhances SS18-SSX2-driven synovial sarcomagenesis and blocks the mesenchymal to epithelial transition. Oncotarget. 6:22758–22766. 10.18632/oncotarget.4283 - DOI - PMC - PubMed

Publication types

MeSH terms