. 2016 Dec 27;113(52):15000-15005.
doi: 10.1073/pnas.1617932114. Epub 2016 Dec 12.

Interrogating the Escherichia coli cell cycle by cell dimension perturbations

Affiliations

Interrogating the Escherichia coli cell cycle by cell dimension perturbations

Hai Zheng et al. Proc Natl Acad Sci U S A. .

Abstract

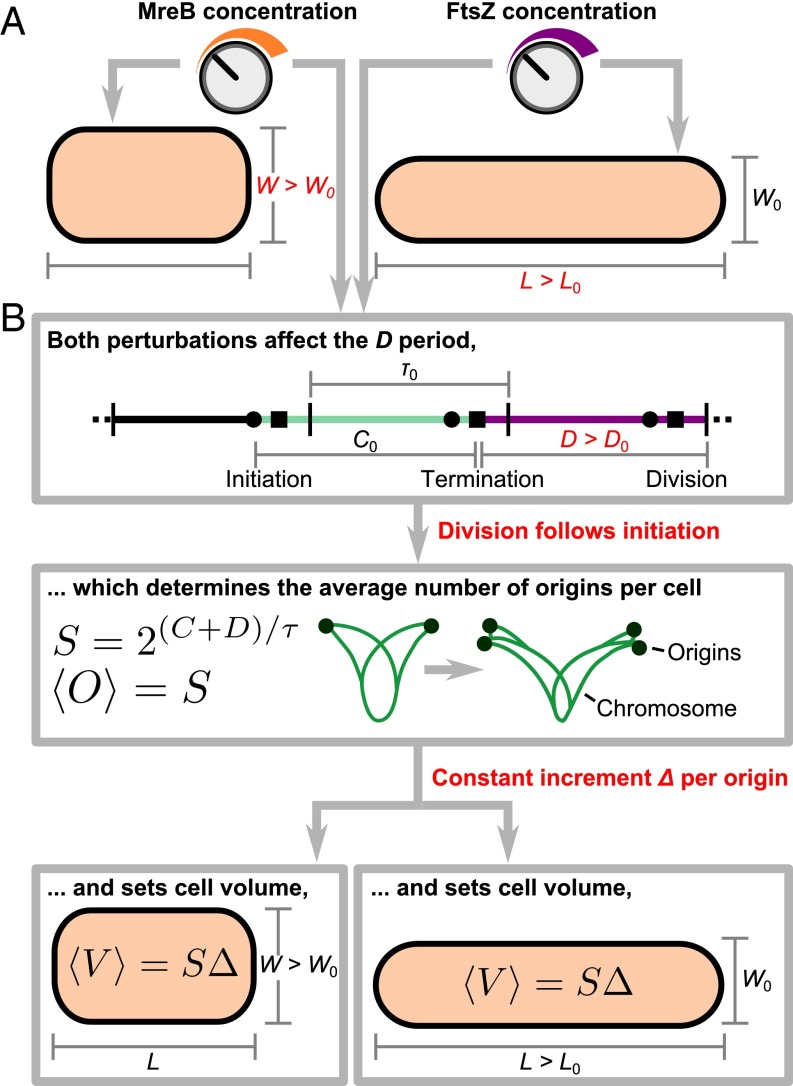
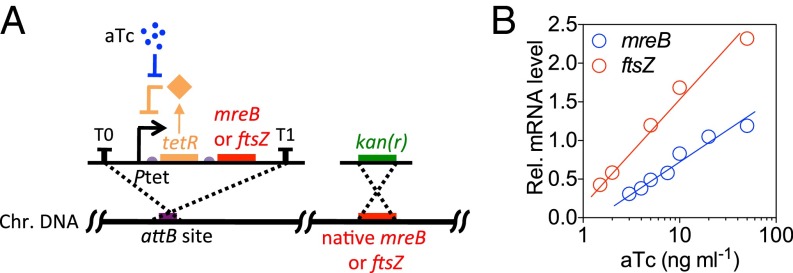
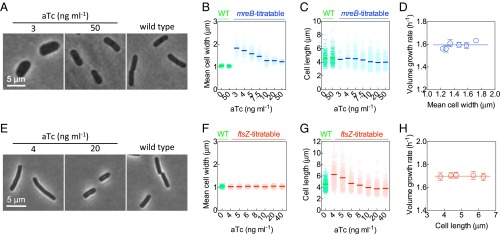
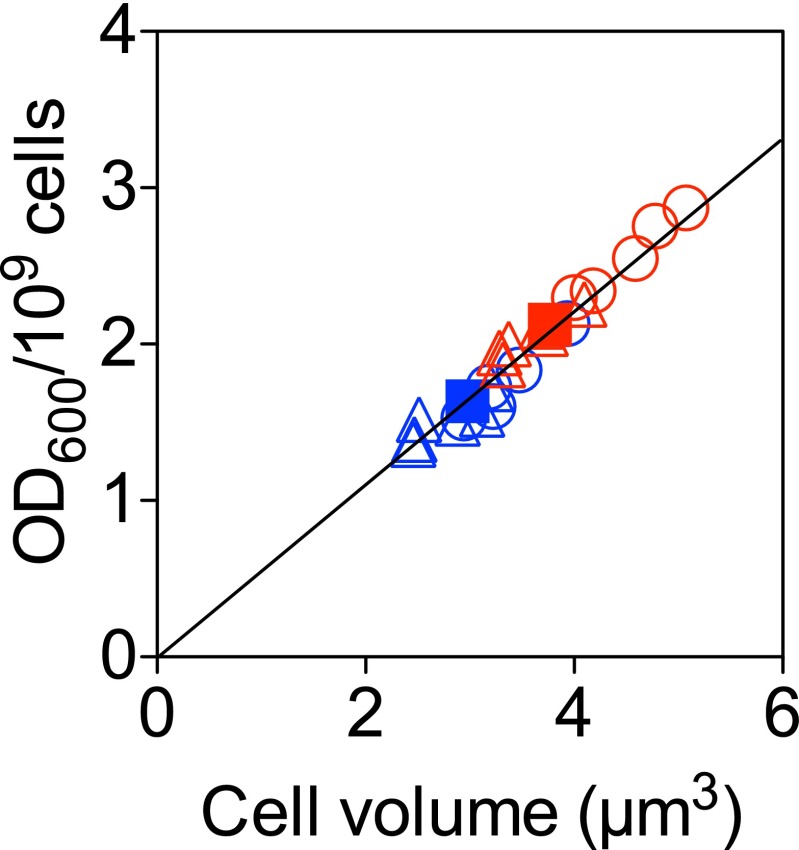
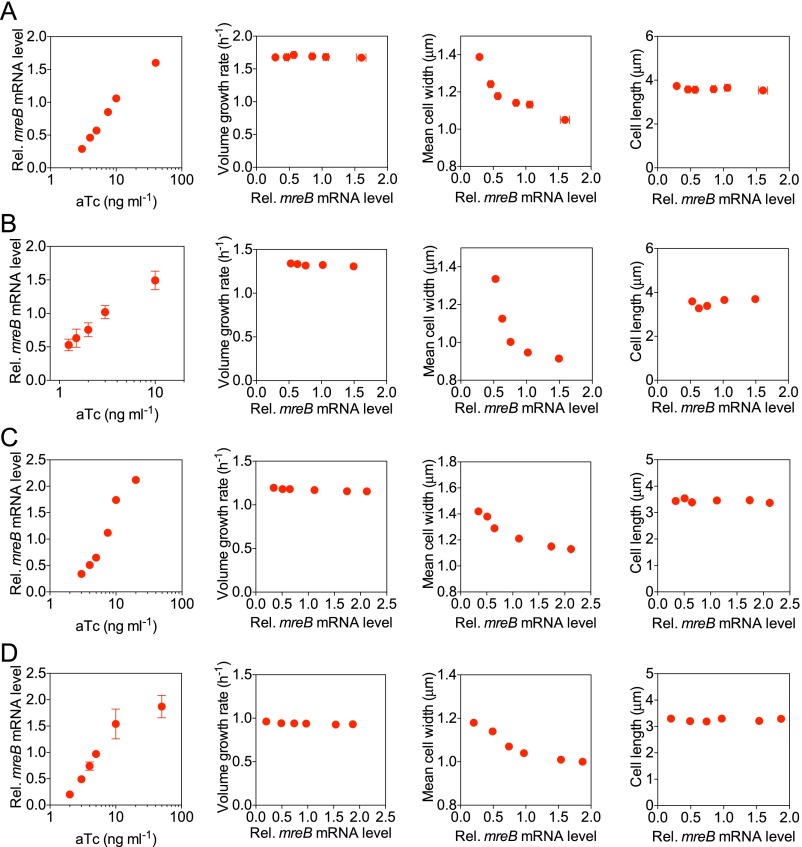
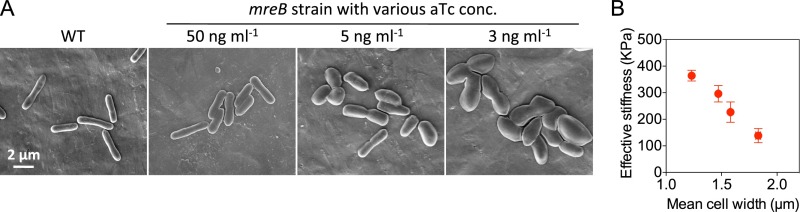
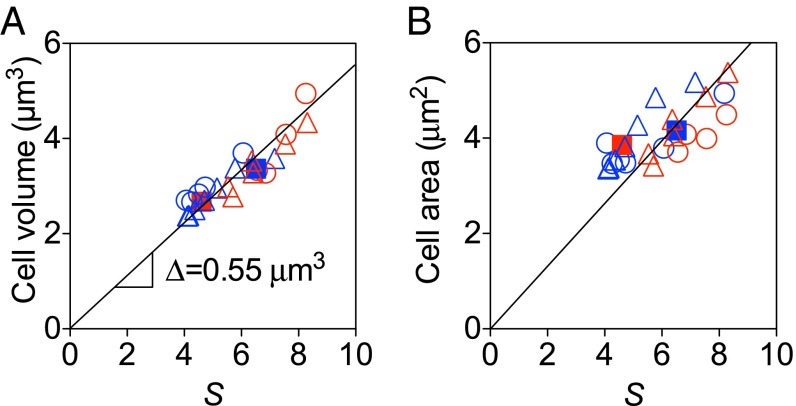
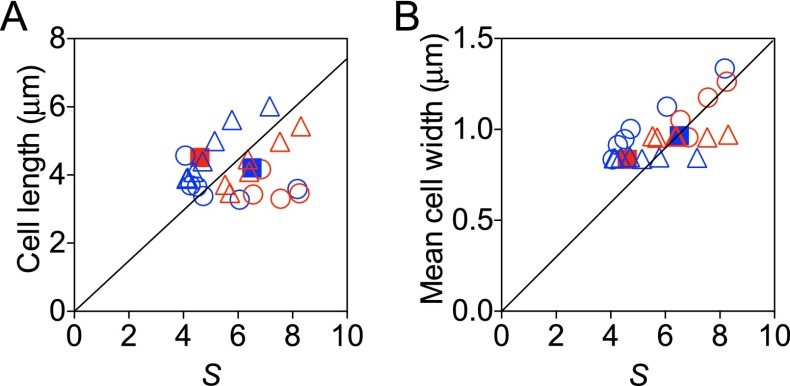
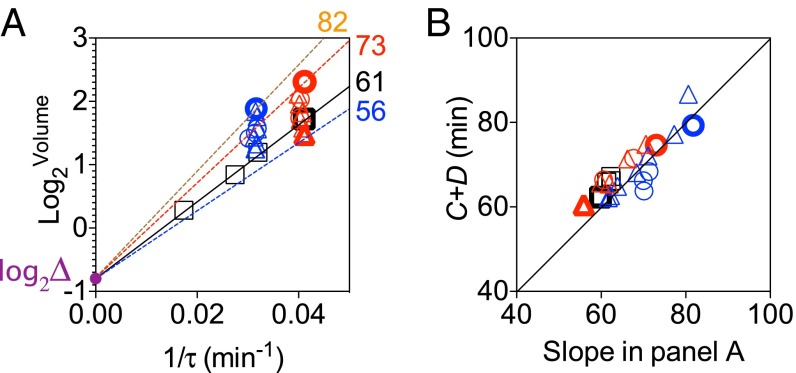
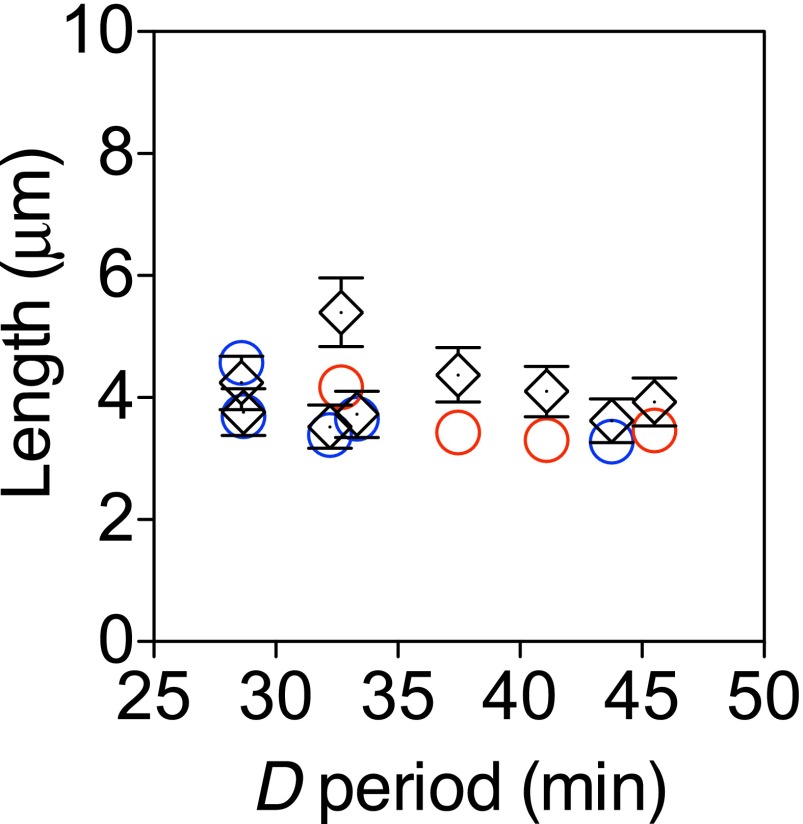
Bacteria tightly regulate and coordinate the various events in their cell cycles to duplicate themselves accurately and to control their cell sizes. Growth of Escherichia coli, in particular, follows a relation known as Schaechter's growth law. This law says that the average cell volume scales exponentially with growth rate, with a scaling exponent equal to the time from initiation of a round of DNA replication to the cell division at which the corresponding sister chromosomes segregate. Here, we sought to test the robustness of the growth law to systematic perturbations in cell dimensions achieved by varying the expression levels of mreB and ftsZ We found that decreasing the mreB level resulted in increased cell width, with little change in cell length, whereas decreasing the ftsZ level resulted in increased cell length. Furthermore, the time from replication termination to cell division increased with the perturbed dimension in both cases. Moreover, the growth law remained valid over a range of growth conditions and dimension perturbations. The growth law can be quantitatively interpreted as a consequence of a tight coupling of cell division to replication initiation. Thus, its robustness to perturbations in cell dimensions strongly supports models in which the timing of replication initiation governs that of cell division, and cell volume is the key phenomenological variable governing the timing of replication initiation. These conclusions are discussed in the context of our recently proposed "adder-per-origin" model, in which cells add a constant volume per origin between initiations and divide a constant time after initiation.

Keywords: DNA replication; E. coli; cell cycle; cell dimension; cell growth.


Conflict of interest statement

The authors declare no conflict of interest.

Figures

Fig. 1.
Fig. 1.
(A) Schematic illustration of the experiment. MreB and FtsZ are involved in cell wall synthesis and septum formation, respectively. Using mreB- or ftsZ-titratable strains, we are able to tune their expression levels continuously and perturb cell dimensions. In both experiments, the D period increased with cell width and length. The C period and doubling time τ remained constant. (B) Schematic illustration of our model. The perturbed D period sets the average number of origins per cell, which is equal to the scaling factor S because replication initiation triggers cell division. The average number of origins per cell then sets the average cell volume, following the growth law. For titrated mreB levels, cell volume changes manifested mostly as cell width changes. For titrated ftsZ levels, cell length changed instead, because FtsZ did not affect cell width.
Fig. 2.
Fig. 2.
Titratable mreB or ftsZ expression. (A) The genetic circuit of the mreB- or ftsZ-titratable strains. The expression of mreB or ftsZ is under the control of a Ptet-tetR feedback loop and the native mreB or ftsZ was seamlessly replaced with a kanamycin resistance gene. (B) Relative mreB and ftsZ mRNA level in the titratable strains in bulk culture containing various concentrations of aTc (3–50 ngmL−1).
Fig. 3.
Fig. 3.
Titratable mreB or ftsZ expression to systematically perturb cell width or cell length, respectively, without affecting the volume growth rates. (A) Representative phase contrast images of the mreB-titratable and wild-type strains. (B and C) Scatter plot presents the average, mean cell width (averaged along the long axis of a cell) (B) or average cell length (C) of the individual wild-type (WT) or mreB-titratable cells. (D) Volume growth rates in bulk culture vs. mean cell width for mreB-titratable cells. (E–H) The same as (A–D) but for the ftsZ-titratable strain. Error bars represent the SEM of three replicates.
Fig. S1.
Fig. S1.
The cell volume measured based on the phase-contrast microscope photographs correlates well with OD600/109 cells. The circle, triangle, and square indicate mreB-titratable, ftsZ-titratable, and WT strains, respectively. Different colors denote growth media: Red is RDM + glucose, and blue is RDM + glycerol. Error bars represent the SEM from three independent experiments.
Fig. S2.
Fig. S2.
Decreased mreB expression level results in increased cell width without affecting the volume doubling rate and cell length in various growth media. (A–D) The relative mreB mRNA level, volume doubling rate, mean cell width, and cell length of the mreB-titratable strain were characterized in RDM + glucose (A), RDM + glycerol (B), M9 + glucose + CAA (C), and M9 + glycerol + CAA (D), respectively. Error bars represent the SEM from three independent experiments.
Fig. S3.
Fig. S3.
The cell width is maintained by the cell wall stiffness. (A) Representative SEM photographs of the mreB-titratable and WT strains. (B) The cell width is negatively related with the effective cellular stiffness. Error bars represent the SEM from three independent experiments.
Fig. 4.
Fig. 4.
Changes in the cell cycle parameters as cell dimensions are perturbed. (A) The D period increased monotonically with cell width in mreB-titratable strains. The line is the best linear fit. (B) The C period remained approximately constant as cell width changed in response to titrated mreB expression levels. The line is the mean value of C averaged over mreB expression levels. (C) The D period increased monotonically with cell length in ftsZ-titratable strains. (D) The C period remained approximately constant as cell length changed in response to titrated ftsZ expression levels. The circle, triangle, and square indicate mreB-titratable, ftsZ-titratable, and WT strains, respectively. Different colors denote growth media: Red is RDM + glucose, and blue is RDM + glycerol. The SEMs of three replicates were smaller than the size of the symbols.
Fig. 5.
Fig. 5.
The growth law holds in the face of perturbation to cell dimensions. (A) The average cell volume is proportional to the scaling factor S=2(C+D)/τ. The black line shows the growth law V=SΔ for the best-fit proportionality constant Δ=0.55±0.04μm3. The plus-or-minus symbol indicates the 95% confidence interval of the fit. The coefficient of determination R2 of the fit is 0.81. (B) The average cell area is not proportional to the scaling factor. The black line shows the best fit with intercept forced to zero. The R2 of the fit is 0.40. The circle, triangle, and square indicate mreB-titratable, ftsZ-titratable, and WT strains, respectively. Different colors denote growth media: Red is RDM + glucose, and blue is RDM + glycerol. The SEMs of three replicates were smaller than the size of the symbols.
Fig. S4.
Fig. S4.
The growth law does not apply for cell length or cell width. The average cell length (A) and average cell width (B) were not proportional to the scaling factor. The black line shows the best fit with intercept forced to zero. The coefficients of determination of the fits are −0.62 and −1.09, respectively. A negative coefficient of determination implies that the mean is a better predictor than the fit. The circle, triangle, and square indicate mreB-titratable, ftsZ-titratable, and WT strains, respectively. Different colors denote growth media: Red is RDM + glucose, and blue is RDM + glycerol. The SEMs of three replicates were smaller than the size of the symbols.
Fig. 6.
Fig. 6.
The average cell volume per origin at initiation is constant in the face of perturbations in cell dimensions. (A) Colored lines connect log2(Δ) to symbols in boldface type as examples. The respective slopes of the lines are computed as the ratio of log2(V/Δ) over 1/τ and shown as numbers (minutes). (B) Measured C+D values are plotted against the ratios calculated in A. The circle, triangle, and square indicate mreB-titratable, ftsZ-titratable, and WT strains, respectively. Different colors denote growth media: Red is RDM + glucose, and blue is RDM + glycerol. The SEMs of three replicates were smaller than the size of the symbols.
Fig. S5.
Fig. S5.
Cell length changes in mreB-titratable strains are small but consistent with the predictions by the growth law. Circles plot the same data as Fig. 4C for mreB-titratable strains. Different colors denote growth media: Red is RDM + glucose, and blue is RDM + glycerol. Black symbols plot predictions of the growth law given cell width and the D period. Error bars represent 10% propagated errors estimated from uncertainties in cell width, the C and D periods, the doubling time τ, and the proportionality constant Δ.

References

    1. Campos M, et al. A constant size extension drives bacterial cell size homeostasis. Cell. 2014;159(6):1433–1446. - PMC - PubMed
    1. Taheri-Araghi S, et al. Cell-size control and homeostasis in bacteria. Curr Biol. 2015;25(3):385–391. - PMC - PubMed
    1. Harris LK, Theriot JA. Relative rates of surface and volume synthesis set bacterial cell size. Cell. 2016;165(6):1479–1492. - PMC - PubMed
    1. Amir A. Cell size regulation in bacteria. Phys Rev Lett. 2014;112(20):208102.
    1. Deforet M, van Ditmarsch D, Xavier JB. Cell-size homeostasis and the incremental rule in a bacterial pathogen. Biophys J. 2015;109(3):521–528. - PMC - PubMed

Publication types