. 2016 Nov 29;2(11):e00204.
doi: 10.1016/j.heliyon.2016.e00204. eCollection 2016 Nov.

RBM5 reduces small cell lung cancer growth, increases cisplatin sensitivity and regulates key transformation-associated pathways

Affiliations

RBM5 reduces small cell lung cancer growth, increases cisplatin sensitivity and regulates key transformation-associated pathways

Julie J Loiselle et al. Heliyon. .

Abstract

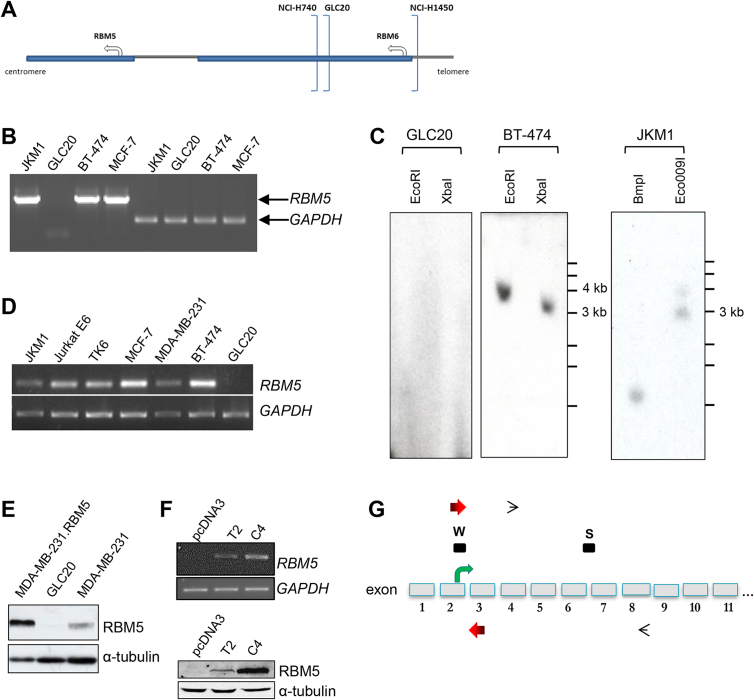
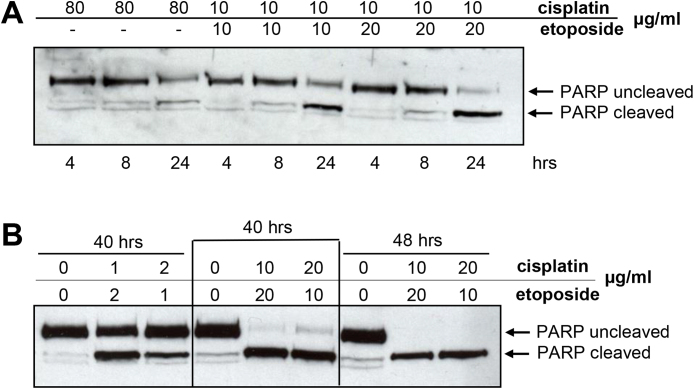
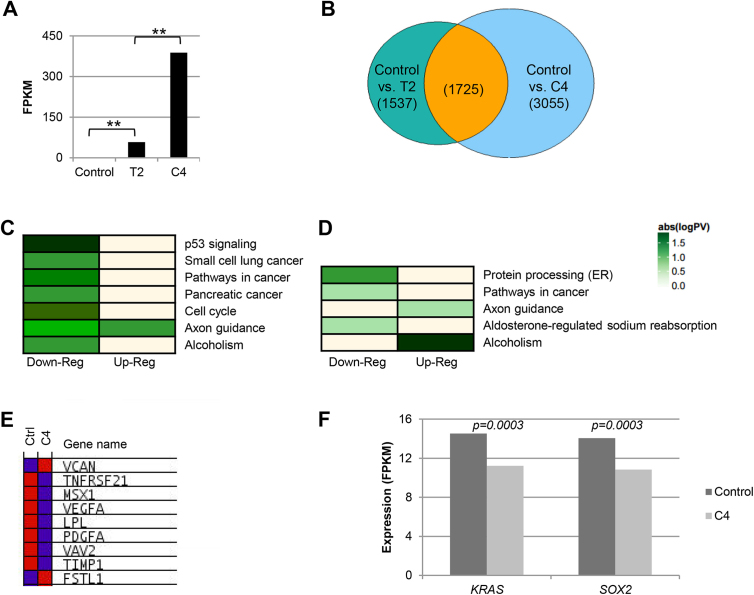
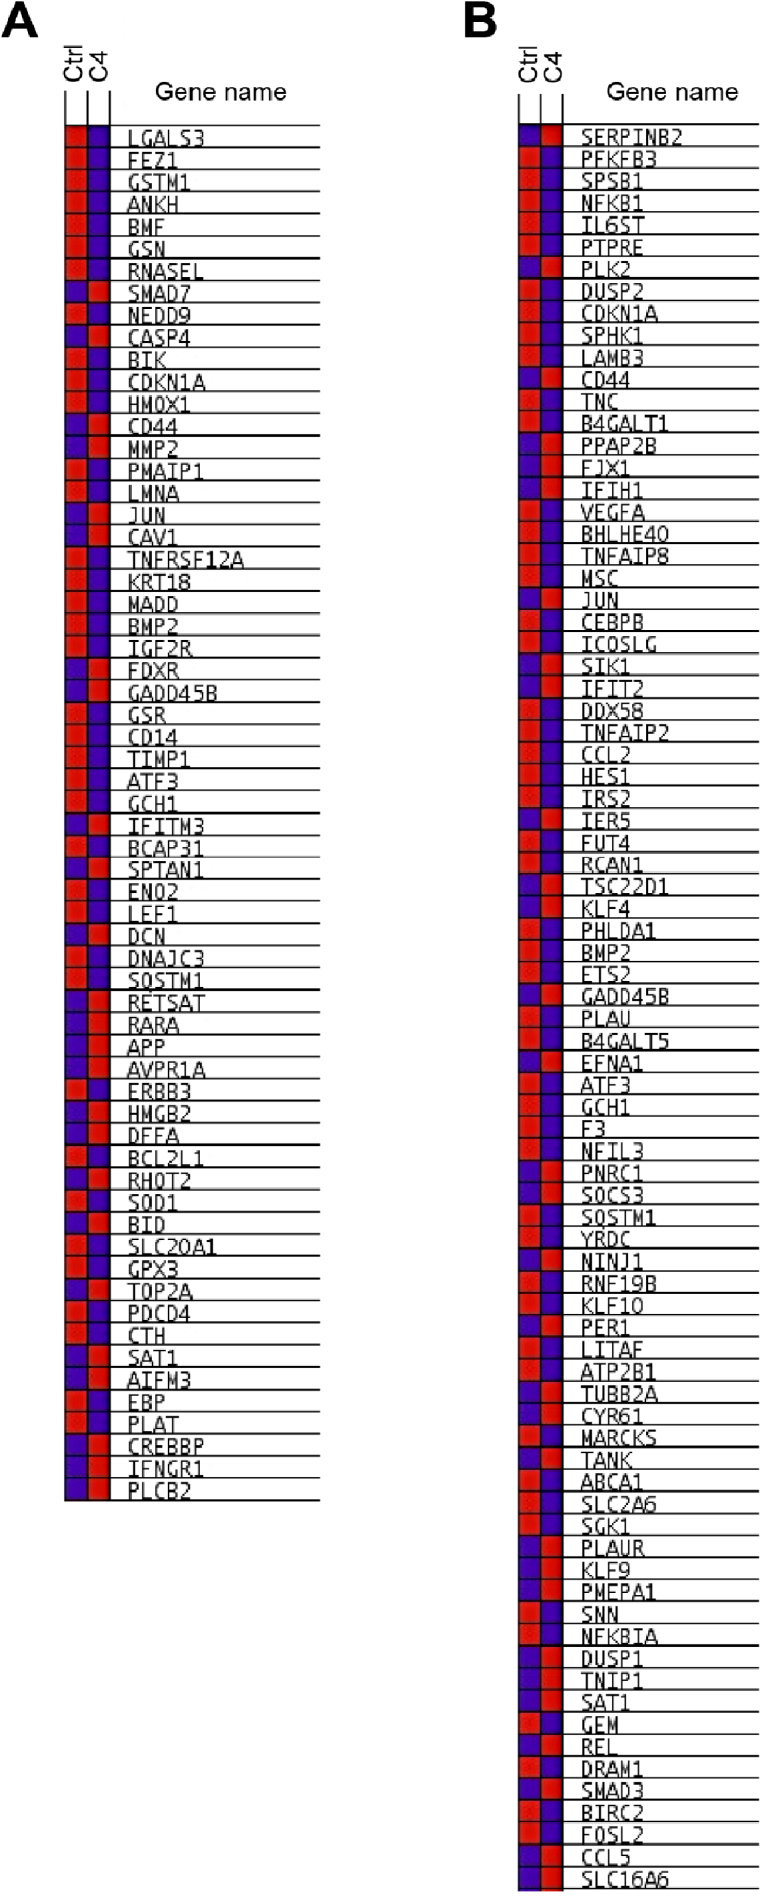
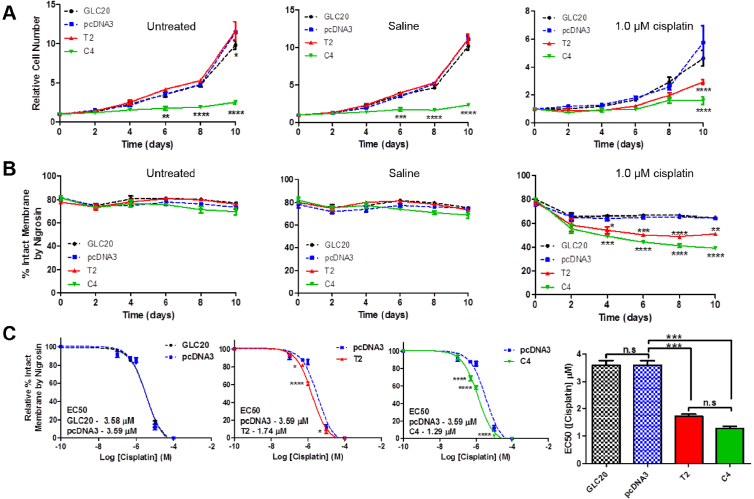
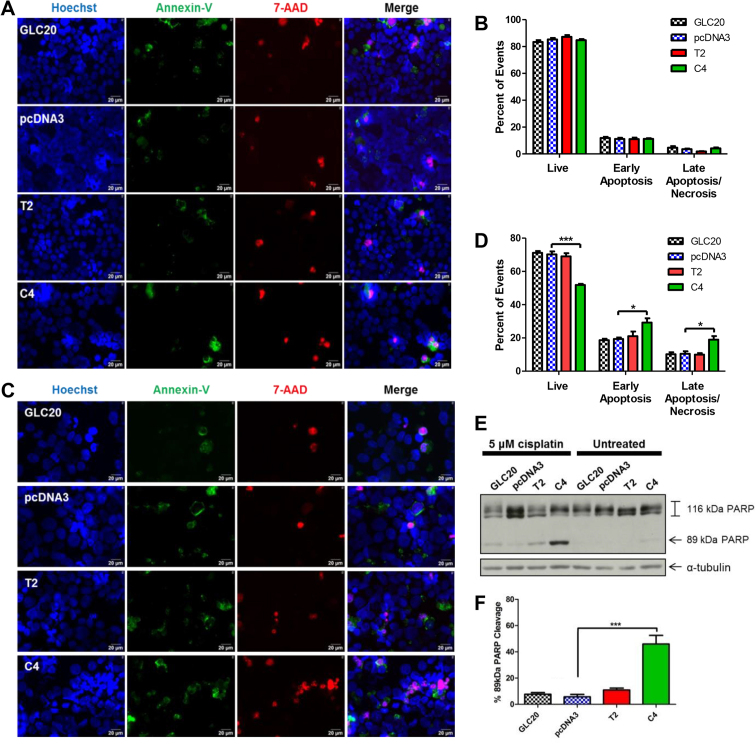
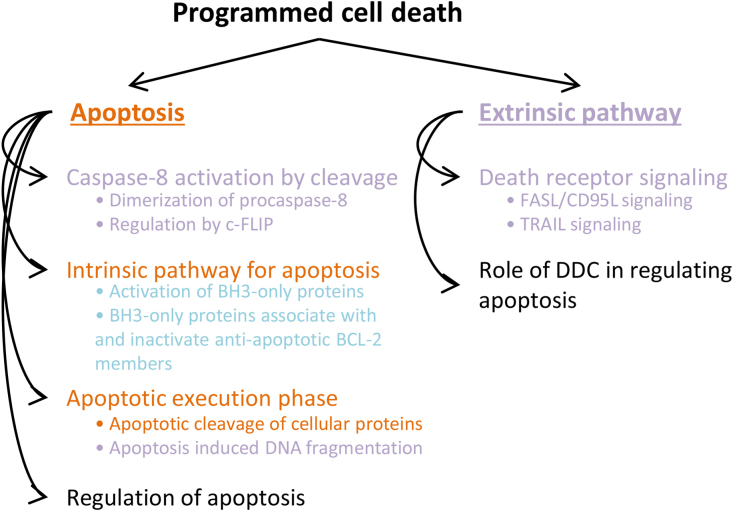
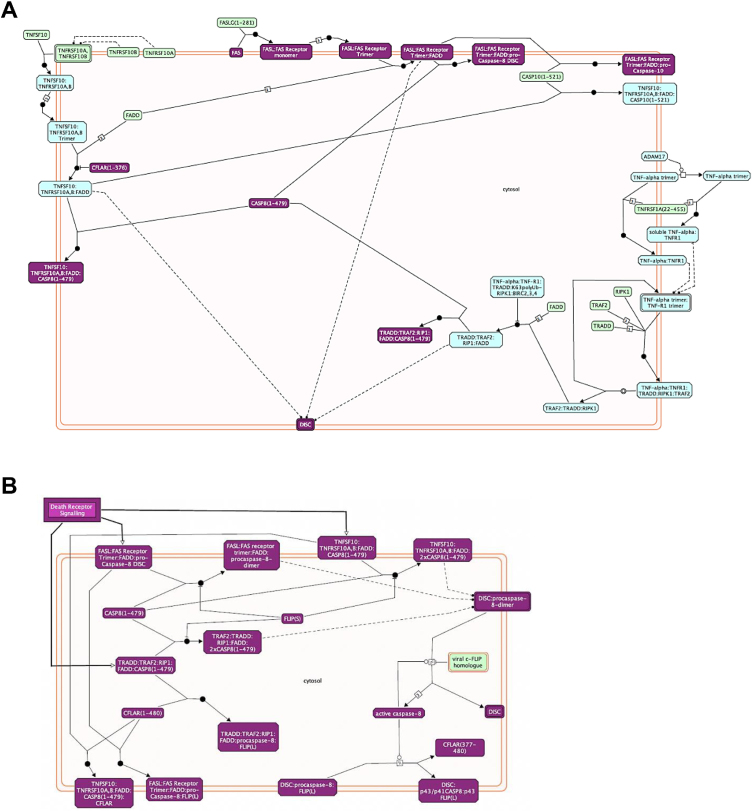
Small cell lung cancer (SCLC) is the most aggressive type of lung cancer, with almost 95% of patients succumbing to the disease. Although RBM5, a tumor suppressor gene, is downregulated in the majority of lung cancers, its role in SCLC is unknown. Using the GLC20 SCLC cell line, which has a homozygous deletion encompassing the RBM5 gene locus, we established stable RBM5 expressing sublines and investigated the effects of RBM5 re-expression. Transcriptome and target identification studies determined that RBM5 directly regulates the cell cycle and apoptosis in SCLC cells, as well as significantly downregulates other important transformation-associated pathways such as angiogenesis and cell adhesion. RNA sequencing of paired non-tumor and tumor SCLC patient specimens showed decreased RBM5 expression in the tumors, and expression alterations in the majority of the same pathways that were altered in the GLC20 cells and sublines. Functional studies confirmed RBM5 expression slows SCLC cell line growth, and increases sensitivity to the chemotherapy drug cisplatin. Overall, our work demonstrates the importance of RBM5 expression to the non-transformed state of lung cells and the consequences of its deletion to SCLC development and progression.

Keywords: Cancer research; Cell biology.


Figures

Fig. 1
Fig. 1
Characterization of wildtype GLC20 cells and RBM5 expressing sublines. (A) Cartoon of location of deletion breakpoints in various lung cell lines. (B) Genomic DNA PCR results from different cell lines. (C) RBM5 Southern Blot. (D) RT-PCR results from different cell lines. (E) Western Blot. (F) RBM5 expression in GLC20 stable transfectants by RT-PCR and Western Blot. (G) Cartoon of 5′ end of RBM5 gene, not drawn to scale, showing approximate locations of various probes. Box marked “W”: Western antibody LUCA-15 UK; box marked “S”: Southern probe; RT-PCR primers LU15(2) and LU15(3) (black thin open arrowheads); genomic PCR primers Gen1E2Fc and Gen2E3I2R (red thick arrows). See Figure S1 for full gel of B, D and F, and full blot of E and F.
Fig. 2
Fig. 2
Apoptosis induction by various apoptogenic stimuli. GLC20 cells were treated with cisplatin with or without etoposide, for the various times indicated. Details in Materials & methods. See Figure S2 for full blots.
Fig. 3
Fig. 3
Transcriptome analysis of GLC20 sublines. (A) RBM5 expression in control, T2 and C4 samples as determined by RNA-Seq. **p < 0.01. (B) Venn diagram demonstrating significantly differentially expressed genes between T2 and C4 compared to control, respectively, as determined by RNA-Seq. Number of genes in each group indicated in parenthesis. (C and D) FIDEA pathway analysis results for altered KEGG pathways in control vs T2 (C) and C4 (D) samples, respectively, from RNA-Seq transcriptome data. (E) GSAASeqSP blue-pink o’gram representing the expression levels of core enriched genes within the MSigDB Angiogensis Hallmark gene set in control and C4 (RNA-Seq data). Blue indicates low expression, whereas red indicates high expression levels. Genes listed in order of Rank Metric Score. (F) KRAS and SOX2 expression in control and C4 samples as determined by RNA-Seq.
Fig. 4
Fig. 4
Expression changes of core enriched genes in RBM5-altered gene sets. GSAASeqSP blue-pink o’gram representing the expression changes of core enriched genes from the MSigDB Hallmark Apoptosis (A) and TNFα signaling via NFκB (B) gene sets in control vs. C4 samples (RNA-Seq data). Blue indicates low expression, whereas red indicates high expression. Genes listed in order of Rank Metric Score.
Fig. 5
Fig. 5
RBM5 antibody testing. The same whole cell lysate from either GLC20 cells (wt) or GLC20.C4 RBM5 containing cells (C4) was loaded in alternate lanes and probed with the antibodies indicated. The LUCA-15-UK blot was probed with a 1:1000 antibody dilution, overnight at 4 °C, and exposed for 2 min. The upper Origene blot was probed with a 1:3000 antibody dilution, for 3 h at RT, and exposed for 60 min. The lower Origene blot was reprobed with a 1:500 antibody dilution, overnight at 4 °C, and exposed for 60 min. The upper Abnova blot was probed with a 1:500 antibody dilution, for 3 h at RT, and exposed for 60 min. The lower Abnova blot was reprobed with a 1:350 antibody dilution, overnight at 4 °C, and exposed for 60 min. The Abcam blot was probed with a 1:2500 antibody dilution, overnight at 4 °C, and exposed for 5 min. The Sp1 and Sp2 blots were probed with a 1:5000 antibody dilution, for 3 h at RT, and exposed for 1 min. All commercially available antibodies (therefore excluding Sp1 and Sp2 – a gift from Juan Valcárcel − and LUCA-15-UK) interacted with product around the same molecular weight as RBM5 even in GLC20 cells, making them unsuitable for use in RIP-Seq experiments. See Figure S3 full blots of loading controls.
Fig. 6
Fig. 6
RBM5 RIP-Seq optimization and quality control. (A) Raw Western Blot data demonstrating successful immunoprecipitation of RBM5. (B) Scatterplot representing expression of genes with FPKM < 5000 in control and RBM5 RIP samples, respectively. All Western Blot ladder sizes are in kilodaltons (kDa).
Fig. 7
Fig. 7
RBM5 targets in the EGFR Signaling pathway. Network analysis results of RBM5 targets (identified by RIP-Seq) in a portion of the EGFR Signaling pathway. Purple indicates that the gene was identified as an RBM5 target.
Fig. 8
Fig. 8
RBM5 targets in the Apoptotic Execution Phase pathway. Pathway analysis results of RBM5 targets (identified by RIP-Seq) in a portion of the Reactome Apoptotic Execution Phase pathway. Purple indicates that the gene was identified as an RBM5 target.
Fig. 9
Fig. 9
Effect of RBM5 expression +/− cisplatin on cell proliferation and membrane integrity. (A and B) GLC20 sublines were left untreated, or exposed to either a saline control or 1.0 μM cisplatin and cell numbers (A) or membrane integrity (B) monitored every other day by cell counting using a hemocytometer. Average of three biological replicates carried out in technical triplicate with standard error is displayed. A two-way ANOVA was performed between pcDNA3 and the other sublines, with Bonferroni post-hoc analysis. (C) GLC20 subline membrane integrity was monitored after eight days of exposure to various concentrations of cisplatin. Results represent the average of three biological replicates performed in technical triplicate with standard error using the calculated average EC50 (calculated from Graphpad Prism 5, ‘non-linear fit − log(inhibitor) vs response (3 parameters)’). Graph represents the average EC50 of three biological replicates. One-way ANOVA was performed with Tukey post-hoc analysis, between sublines, with *p < 0.05, **p < 0.01, ***p < 0.001 and ****p < 0.0001.
Fig. 10
Fig. 10
Effect of RBM5 expression +/− cisplatin on apoptosis. GLC20 sublines were left untreated (A, B) or treated with 5 μM cisplatin (C, D, E, F) and collected after four days for fluorescence microscopy (A, C) or PARP cleavage analysis (E, F). Average number of Live (only Hoechst/blue), Early Apoptosis (condensed Hoechst/blue and/or Annexin-V/green) and Late Apoptosis/Necrosis (7-AAD/Red) fluorescence microscopy events from three biological replicates, each with 10 different fields of view, with standard error, for the untreated cells (B) and 5 μM cisplatin (D). (E) A representative Western blot for PARP cleavage, in the cisplatin-treated samples, with (F) densitometric analysis of ‘percent 89kDa PARP cleavage product’ [(89kDa cleaved PARP/total PARP)x100], with standard error, from three biological replicates, using the AlphaEase FC, ‘1D-Multi’ analysis tool. One-way ANOVA was performed with Tukey post-hoc analysis, between sublines, with *p < 0.05 and ***p < 0.001. See Figure S4 for full blots of E.
Fig. 11
Fig. 11
Expression of apoptosis-related genes in cisplatin treated samples. Adapted GSAASeqSP blue-pink o’gram representing the expression changes of core enriched genes from the MSigDB Hallmark Apoptosis gene set in cisplatin treated control vs. T2 and control vs. C4. Blue indicates decreased expression compared to control, whereas red indicates increased expression compared to control. Genes listed in alphabetical order.
Fig. 12
Fig. 12
Enriched ‘Programmed cell death’ pathways in cisplatin treated samples. Diagram illustrating the Reactome ‘Programmed cell death’ pathways enriched with an FDR below 10% in cisplatin-treated control vs. T2 (purple), control vs. C4 (blue) or control vs. T2 and C4 (orange).
Fig. 13
Fig. 13
Gene enrichment for apoptosis-related pathways in cisplatin-treated T2 samples. Reactome diagram for ‘Death receptor signaling’ (A) and ‘Caspase-8 activation by cleavage’ (B). Differentially expressed genes between cisplatin treated control vs. T2 are presented in purple.
Fig. 14
Fig. 14
‘Apoptotic execution phase’ gene enrichment in cisplatin-treated samples. Differentially expressed genes between cisplatin treated control vs. T2 (A) or control vs. C4 (B) are presented in purple in a portion of the Reactome ‘Apoptotic execution phase’ pathway.

References

    1. Abreu A.P., Dauber A., Macedo D.B., Noel S.D., Brito V.N., Gill J.C., Cukier P., Thompson I.R., Navarro V.M., Gagliardi P.C. Central precocious puberty caused by mutations in the imprinted gene MKRN3. N. Engl. J. Med. 2013;368:2467–2475. - PMC - PubMed
    1. Angeloni D. Molecular analysis of deletions in human chromosome 3p21 and the role of resident cancer genes in disease. Brief. Funct. Genomic. Proteomic. 2007 - PubMed
    1. Bechara E.G., Sebestyen E., Bernardis I., Eyras E., Valcarcel J. RBM5, 6, and 10 Differentially Regulate NUMB Alternative Splicing to Control Cancer Cell Proliferation. Mol. Cell. 2013;52:720–733. - PubMed
    1. Brennan D., Hu Y., Joubeh S., Choi Y.W., Whitaker-Menezes D., O'Brien T., Uitto J., Rodeck U., Mahoney M.G. Suprabasal Dsg2 expression in transgenic mouse skin confers a hyperproliferative and apoptosis-resistant phenotype to keratinocytes. J. Cell. Sci. 2007;120:758–771. - PubMed
    1. Brennan D., Mahoney M.G. Increased expression of Dsg2 in malignant skin carcinomas: A tissue-microarray based study. Cell Adh. Migr. 2009;3:148–154. - PMC - PubMed

LinkOut - more resources