. 2017 Apr;45(4):1133-1147.
doi: 10.1007/s10439-016-1765-5. Epub 2016 Dec 12.

Fundamental Principles of Tremor Propagation in the Upper Limb

Affiliations

Fundamental Principles of Tremor Propagation in the Upper Limb

Andrew D Davidson et al. Ann Biomed Eng. 2017 Apr.

Abstract

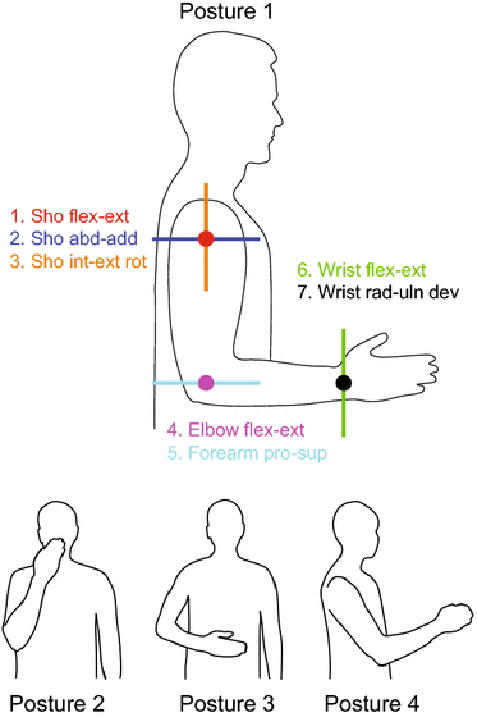
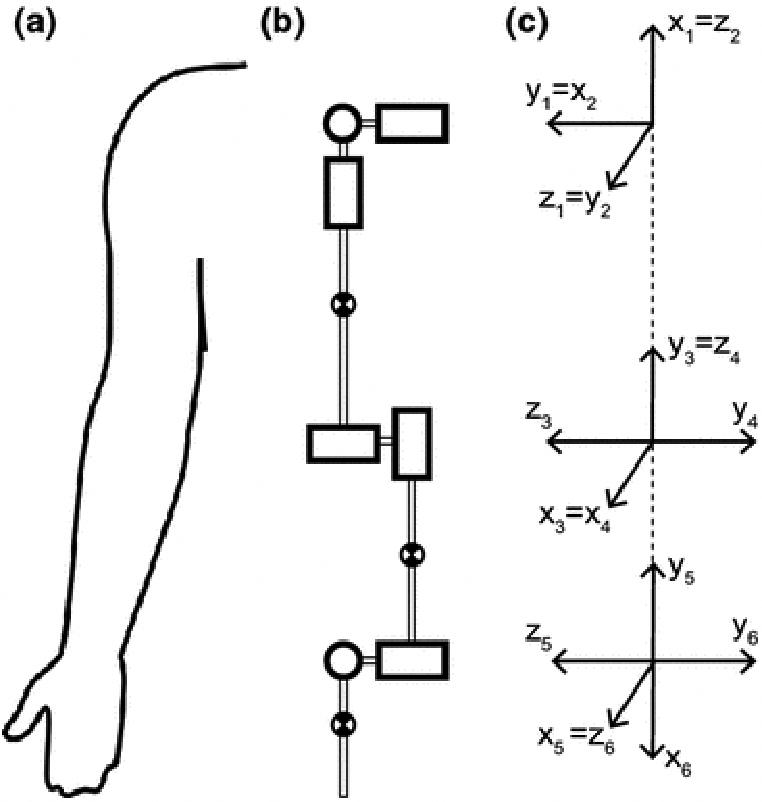
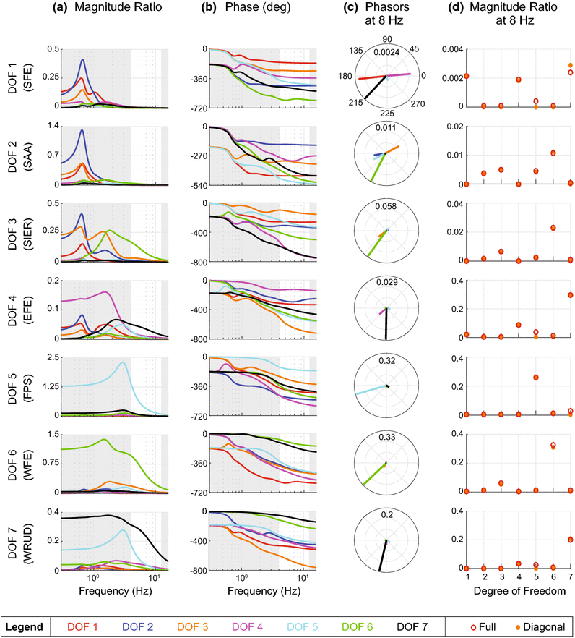
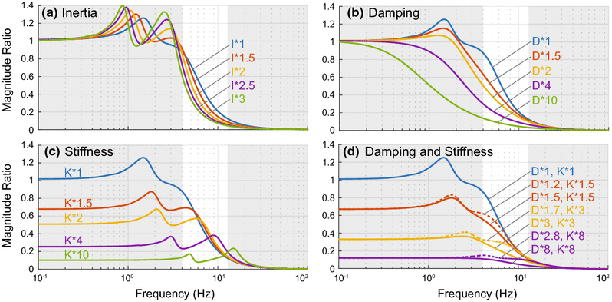
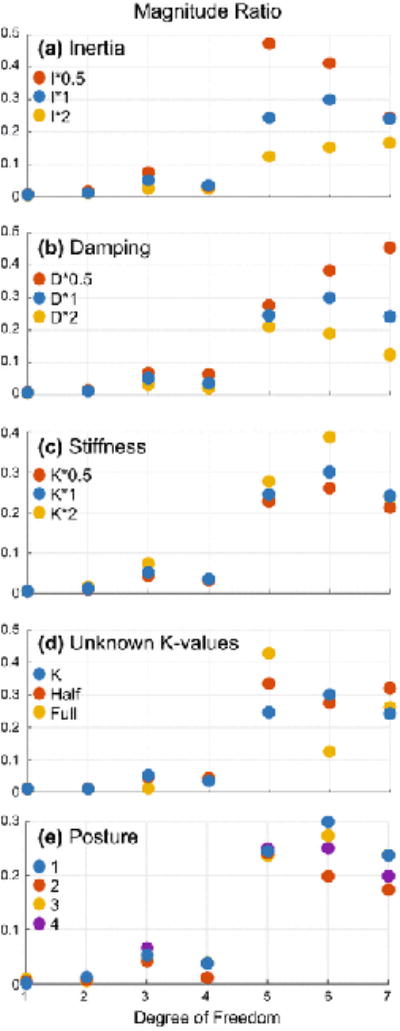
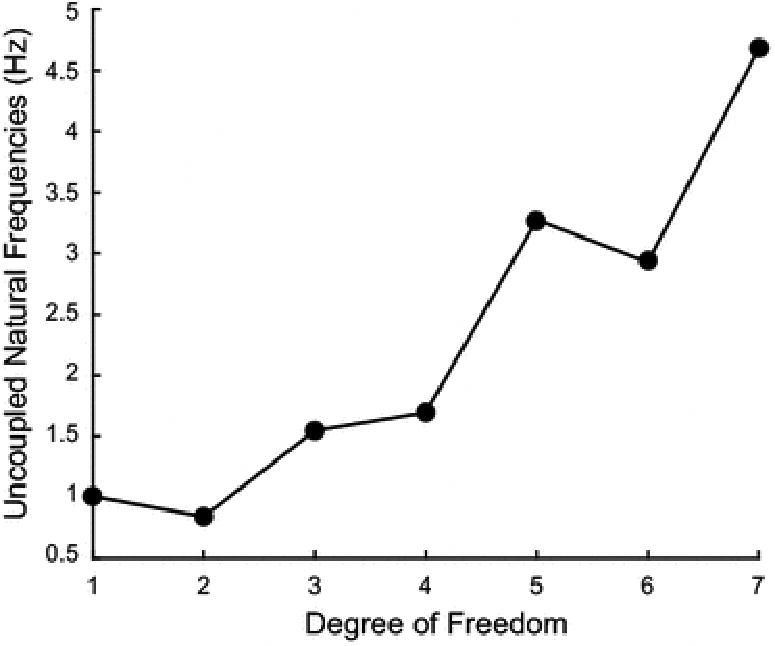
Although tremor is the most common movement disorder, there exist few effective tremor-suppressing devices, in part because the characteristics of tremor throughout the upper limb are unknown. To clarify, optimally suppressing tremor requires a knowledge of the mechanical origin, propagation, and distribution of tremor throughout the upper limb. Here we present the first systematic investigation of how tremor propagates between the shoulder, elbow, forearm, and wrist. We simulated tremor propagation using a linear, time-invariant, lumped-parameter model relating joint torques and the resulting joint displacements. The model focused on the seven main degrees of freedom from the shoulder to the wrist and included coupled joint inertia, damping, and stiffness. We deliberately implemented a simple model to focus first on the most basic effects. Simulating tremorogenic joint torque as a sinusoidal input, we used the model to establish fundamental principles describing how input parameters (torque location and frequency) and joint impedance (inertia, damping, and stiffness) affect tremor propagation. We expect that the methods and principles presented here will serve as the groundwork for future refining studies to understand the origin, propagation, and distribution of tremor throughout the upper limb in order to enable the future development of optimal tremor-suppressing devices.

Keywords: Essential tremor; Frequency response; Impedance; Parkinson’s disease; System dynamics; Tremor suppression.


Conflict of interest statement

Potential Conflict Of Interest: SK Charles is a scientific advisor to, and holds stock in, Vykon Technologies LLC. This company has licensed technology invented by SK Charles to develop markerless monitoring of movement disorders, including tremor.

Figures

Figure 1
Figure 1
Degrees of freedom (DOF) and postures included in our study. Our model of the upper limb included seven DOF, designated by their like-colored axes of rotation: Shoulder flexion-extension, shoulder abduction-adduction, shoulder internal-external rotation, elbow flexion-extension, forearm pronation-supination, wrist flexion-extension, and wrist radial-ulnar deviation. Posture 1 is the default posture, and postures 2-4 were used to test the effect of changing posture on tremor propagation. Posture 2 places the hand in front of the mouth and represents feeding and grooming activities. In Posture 3 the hand is in the workspace in front of the abdomen and represents many activities of daily living requiring fine manipulation. Posture 4 represents reaching tasks. Joint angles for each posture are given in Table 2.
Figure 2
Figure 2
Kinematic description of the upper limb using the Denavit-Hartenberg (DH) convention. To calculate the full, coupled inertia matrix, we modeled the seven main degrees of freedom of the shoulder, elbow, forearm, and wrist as revolute joints (A-B) and converted the model to DH parameters (Table 2) using the intermediate coordinate frames defined in C. Adapted from .
Figure 3
Figure 3
Frequency response of all input-output relationships. Row presents the frequency response for an input in DOF i (row label) and output in DOF k (color—see legend). Because the transfer function matrix is symmetric, row i also presents the frequency response for an input in DOF k (color) and output in DOF i (row label). A. Magnitude ratio, i.e. the ratio of the output (tremor) over the input (torque). The tremor band (4-12 Hz) is emphasized in white. B. Phase shift of the output relative to the input. C. Phasor plots for an input frequency of 8 Hz. The magnitude and phase of each phasor is the same as the magnitude ratio and phase shift of the like-colored lines (on the same row), evaluated at 8 Hz. D. Magnitude ratio at 8 Hz vs. DOF. Each plot shows the magnitude ratios for an input in DOF i (row label) and output in DOF k (x-axis), which is the same as the magnitude ratios for an input in DOF k (x-axis) and output in DOF i (row label). Red and orange circles were calculated using the full (coupled) and diagonal (uncoupled) stiffness and damping matrices, respectively.
Figure 4
Figure 4
Effect of inertial and viscoelastic loading on the magnitude ratio, shown here for input and output in DOF 6. The effect of inertial and viscoelastic loading is similar across other input-output relationships. In each plot, the default (no loading) is shown in blue. A. Increasing inertia usually decreases the magnitude ratio in the tremor band, though it can sometimes increase the magnitude ratio, especially at the lower bound of the tremor band. B. Increasing damping alone always decreases the magnitude ratio. C. Increasing stiffness alone can decrease or increase the magnitude ratio depending on the increase in stiffness and the input frequency. D. Increasing stiffness and damping by the same factor (solid lines), or stiffness more than damping (damping by the square root of the factor, dashed lines), usually decreases the magnitude ratio, but can increase the magnitude ratio for some factors and input frequencies.
Figure 5
Figure 5
Sensitivity analysis results shown for the full multi-input–multi-output case (magnitude ratio of the total output in each DOF for equal inputs in all DOF). Although changing inertia, damping, stiffness, or posture affects the sizes of the magnitude ratios, the principles presented in the Discussion remain valid. Magnitude ratios were evaluated at 8 Hz. The blue magnitude ratios in each plot were calculated using the default inertia, damping, and stiffness matrices. A-C. Effect of multiplying inertia, damping, or stiffness by factors of 0.5 and 2 on the magnitude ratio. D. Effect of replacing the unknown off-diagonal values in the stiffness matrix (initially assumed zero) by half or the full average of the two corresponding diagonal values. E. Effect of posture. Changing posture tends to switch which DOF are coupled to each other (not shown), but the total amount of coupling in each DOF remains relatively unaffected (assuming inputs in all DOF).
Figure 6
Figure 6
Uncoupled natural frequency at each DOF. These natural frequencies are proportional to the square root of stiffness over inertia. The proximal-distal increase in natural frequency demonstrates that the proximal-distal decrease in inertia is greater than the decrease in stiffness.

References

    1. Aisen ML, Arnold A, Baiges I, Maxwell S, Rosen M. The effect of mechanical damping loads on disabling action tremor. Neurol. 1993;43 - PubMed
    1. Anouti A, Koller WC. Tremor disorders. Diagnosis and management. Western journal of medicine. 1995;162:510. - PMC - PubMed
    1. Charles SK, Hogan N. Dynamics of wrist rotations. Journal of Biomechanics. 2011;44:614–621. - PubMed
    1. Charles SK, Hogan N. Stiffness, not inertial coupling, determines path curvature of wrist motions. Journal of Neurophysiology. 2012;107:1230–1240. - PubMed
    1. Colacino FM, Rustighi E, Mace BR. Subject-specific musculoskeletal parameters of wrist flexors and extensors estimated by an EMG-driven musculoskeletal model. Medical Engineering & Physics. 2012;34:531–540. - PubMed

Publication types

LinkOut - more resources