Dynamic PET evaluation of elevated FLT level after sorafenib treatment in mice bearing human renal cell carcinoma xenograft
- PMID: 27957722
- PMCID: PMC5153393
- DOI: 10.1186/s13550-016-0246-z
Dynamic PET evaluation of elevated FLT level after sorafenib treatment in mice bearing human renal cell carcinoma xenograft
Abstract
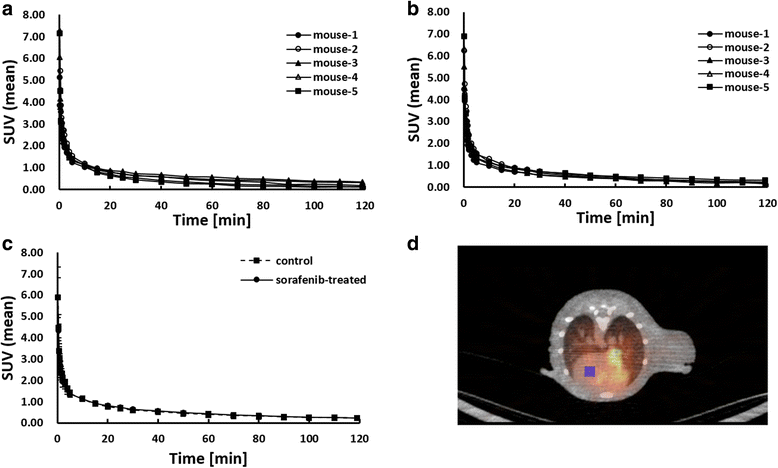
Background: Sorafenib, an oral multikinase inhibitor, has anti-proliferative and anti-angiogenic activities and is therapeutically effective against renal cell carcinoma (RCC). Recently, we have evaluated the tumor responses to sorafenib treatment in a RCC xenograft using [Methyl-3H(N)]-3'-fluoro-3'-deoxythythymidine ([3H]FLT). Contrary to our expectation, the FLT level in the tumor significantly increased after the treatment. In this study, to clarify the reason for the elevated FLT level, dynamic 3'-[18F]fluoro-3'-deoxythymidine ([18F]FLT) positron emission tomography (PET) and kinetic studies were performed in mice bearing a RCC xenograft (A498). The A498 xenograft was established in nude mice, and the mice were assigned to the control (n = 5) and treatment (n = 5) groups. The mice in the treatment group were orally given sorafenib (20 mg/kg/day p.o.) once daily for 3 days. Twenty-four hours after the treatment, dynamic [18F]FLT PET was performed by small-animal PET. Three-dimensional regions of interest (ROIs) were manually defined for the tumors. A three-compartment model fitting was carried out to estimate four rate constants using the time activity curve (TAC) in the tumor and the blood clearance rate of [18F]FLT.
Results: The dynamic pattern of [18F]FLT levels in the tumor significantly changed after the treatment. The rate constant of [18F]FLT phosphorylation (k3) was significantly higher in the treatment group (0.111 ± 0.027 [1/min]) than in the control group (0.082 ± 0.009 [1/min]). No significant changes were observed in the distribution volume, the ratio of [18F]FLT forward transport (K1) to reverse transport (k2), between the two groups (0.556 ± 0.073 and 0.641 ± 0.052 [mL/g] in the control group).
Conclusions: Our dynamic PET studies indicated that the increase in FLT level may be caused by the phosphorylation of FLT in the tumor after the sorafenib treatment in the mice bearing a RCC xenograft. Dynamic PET studies with kinetic modeling could provide improved understanding of the biochemical processes involved in tumor responses to therapy.
Keywords: 3′-[18F]fluoro-3′-deoxythymidine ([18F]FLT); Dynamic PET; Renal cell carcinoma xenograft; Sorafenib; Tumor proliferation.
Figures


References
-
- Buck AK, Schirrmeister H, Hetzel M, et al. 3-deoxy-3-[(18)F] fluorothymidine-positron emission tomography for noninvasive assessment of proliferation in pulmonary nodules. Cancer Res. 2002;62:3331–3334. - PubMed
-
- Barthel H, Cleij MC, Collingridge DR, et al. 3'-deoxy-3'-[18F] fluorothymidine as a new marker for monitoring tumor response to antiproliferative therapy in vivo with positron emission tomography. Cancer Res. 2003;63:3791–3798. - PubMed
LinkOut - more resources
Full Text Sources
Other Literature Sources

