Observational Study
. 2017 Feb;112(2):346-355.
doi: 10.1038/ajg.2016.538. Epub 2016 Dec 13.

Distinct Abnormalities of Small Bowel and Regional Colonic Volumes in Subtypes of Irritable Bowel Syndrome Revealed by MRI

Affiliations
Observational Study

Distinct Abnormalities of Small Bowel and Regional Colonic Volumes in Subtypes of Irritable Bowel Syndrome Revealed by MRI

Ching Lam et al. Am J Gastroenterol. 2017 Feb.

Abstract

Objectives: Non-invasive biomarkers which identify different mechanisms of disease in subgroups of irritable bowel syndrome (IBS) could be valuable. Our aim was to seek useful magnetic resonance imaging (MRI) parameters that could distinguish each IBS subtypes.

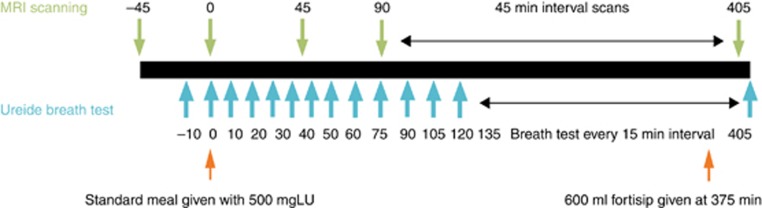
Methods: 34 healthy volunteers (HV), 30 IBS with diarrhea (IBS-D), 16 IBS with constipation (IBS-C), and 11 IBS with mixed bowel habit (IBS-M) underwent whole-gut transit and small and large bowel volumes assessment with MRI scans from t=0 to t=360 min. Since the bowel frequency for IBS-M were similar to IBS-D, IBS-M and IBS-D were grouped together and labeled as IBS non-constipation group (IBS-nonC).

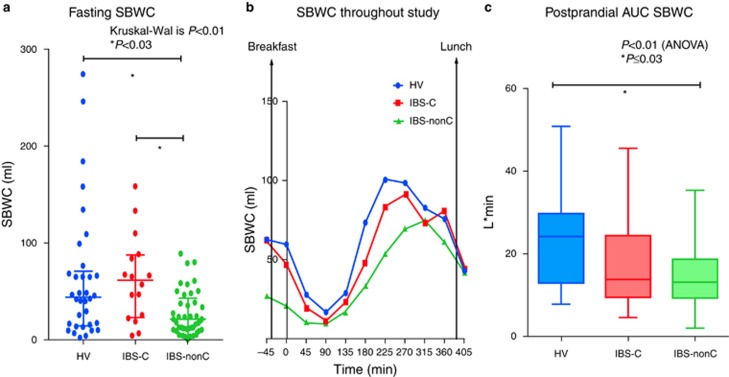
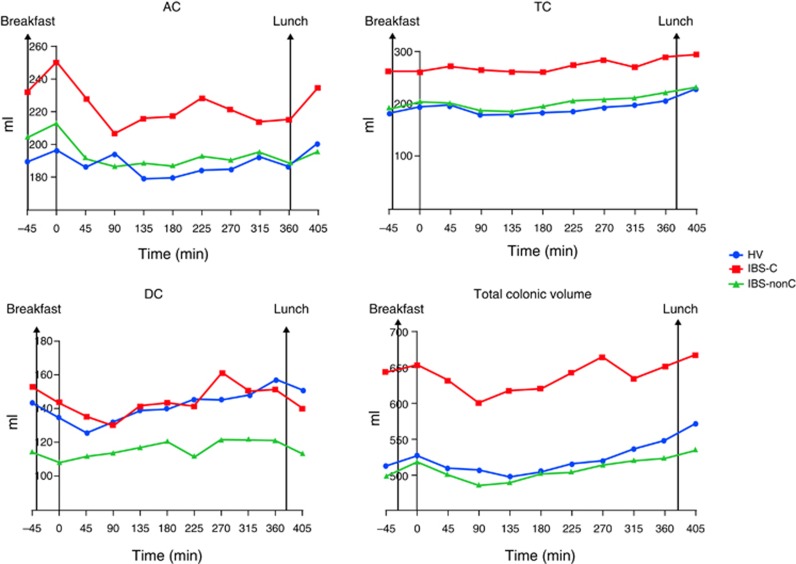
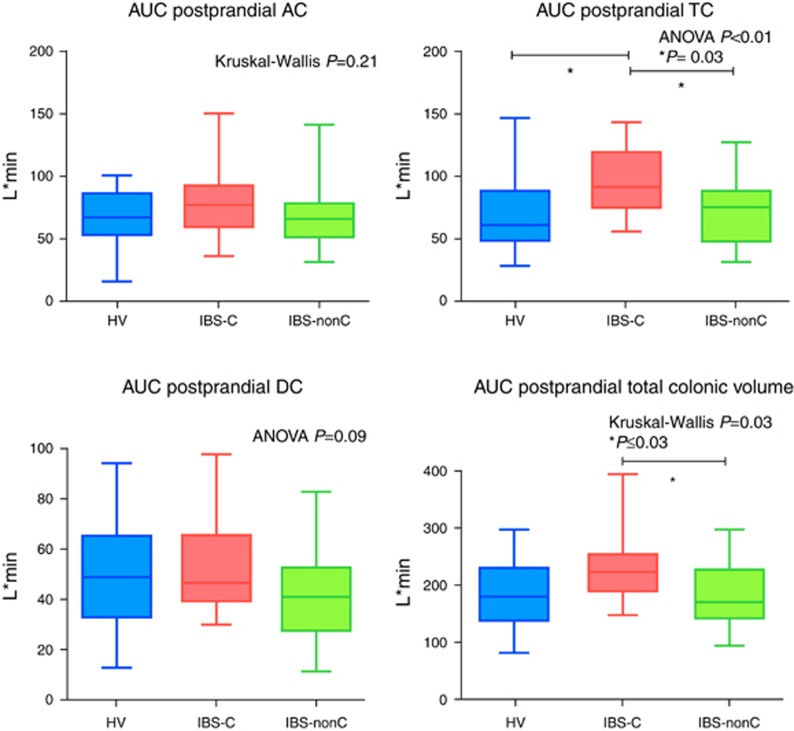
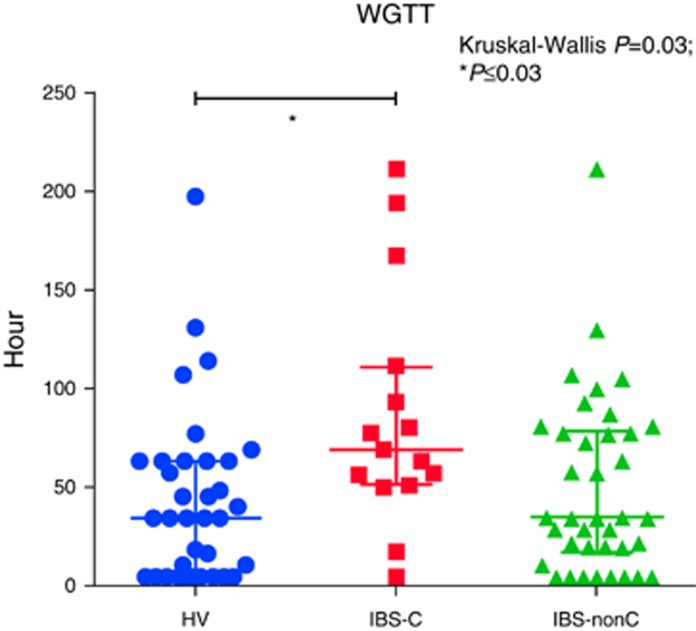
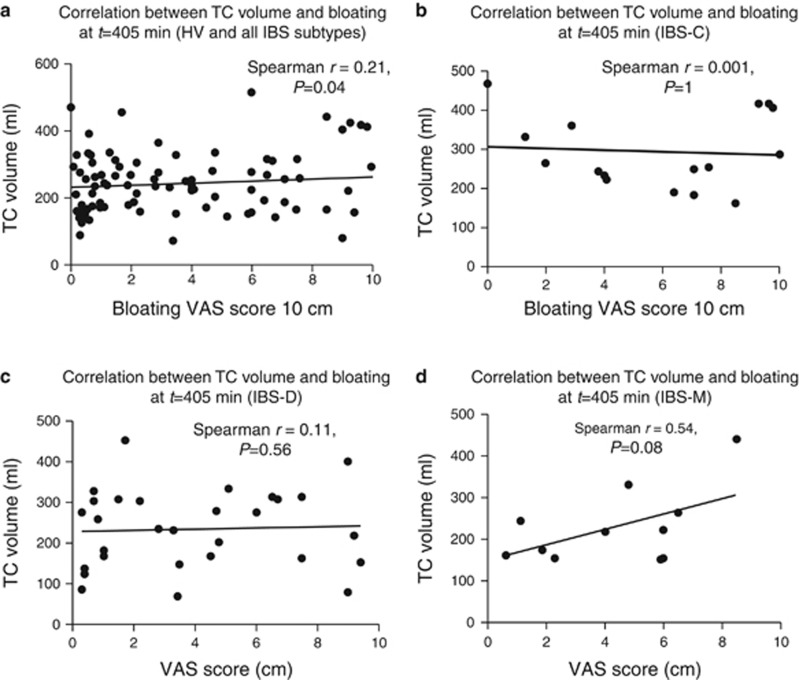
Results: Median (interquartile range): fasting small bowel water content in IBS-nonC was 21 (10-42), significantly less than HV at 44 ml (15-70), P<0.01 as was the postprandial area under the curve (AUC) P<0.01. The fasting transverse colon volumes in IBS-C were significantly larger at 253 (200-329) compared with HV, IBS-nonC whose values were 165 (117-255) and 198 (106-270) ml, respectively, P=0.02. Whole-gut transit time for IBS-C was prolonged at 69 (51-111), compared with HV at 34 (4-63) and IBS-D at 34 (17-78) h, P=0.03. Bloating score (VAS 0-10 cm) correlated with transverse colon volume at t=405 min, Spearman r=0.21, P=0.04.

Conclusions: The constricted small bowel in IBS-nonC and the dilated transverse colon in IBS-C point to significant differences in underlying mechanisms of disease.


Conflict of interest statement

Guarantor of the article: Robin Spiller, MSc, MD, FRCP.

Specific author contributions: Recruitment of participants into study, study concept and design, analysis and interpretation of data, statistical analysis, administrative and material support, study supervision: Ching Lam; recruitment of participants into study, study supervision, acquisition and analysis of data: Gemma Chaddock; study supervision, study concept and design, statistical analysis and technical support: Luca Marciani Laurea; technical support: Carolyn Costigan; technical support: Eleanor Cox; study concept and design, technical support, analysis of data: Caroline Hoad; technical support and analysis of data: Susan Pritchard; obtained funding, study concept and design, interpretation of data: Susan Pritchard; obtained funding, study concept and design, interpretation of data, study supervision, recruitment: Robin Spiller. All authors assisted in drafting of the manuscript.

Financial support: This is a summary of independent research funded by the Medical Research Council and the National Institute for Health Research Biomedical Research Unit. The views expressed are those of the author(s) and not necessarily those of the NHS, the NIHR or the Department of Health.

Potential competing interests: Robin Spiller has received research funding from Lesaffre and Ironwood and free drug for clinical trial from Norgine. He has also acted on Advisory Boards for Almirall, Astellas, Ibsen and Danone. The remaining authors declare no conflict of interest.

Figures

Figure 1
Figure 1
Summary of study day. A full color version of this figure is available at the American College of Gastroenterology journal online.
Figure 2
Figure 2
Showing significant differences in small bowel water (SBWC) between irritable bowel syndrome (IBS) subtypes and healthy volunteers (HV). (a) Fasting small bowel water showing IBS-nonC had significantly lower value. (b) SBWC throughout the whole study for IBS subtypes and HV confirming that the lower values in IBS-nonC persist throughout the postprandial period. (c) Area under the curve (AUC) for post-prandial small bowel water content (times between time t=0 to t=360 min) showing IBS-nonC have signficantly lower SBWC. A full color version of this figure is available at the American College of Gastroenterology journal online.
Figure 3
Figure 3
Segmented colonic volumes and total colonic volumes throughout whole study for irritable bowel syndrome (IBS) subtypes and healthy volunteers (HV) showing significantly greater total colonic volumes in IBS with constipation (IBS-C) mainly due to the significantly greater transverse colon (TC). A full color version of this figure is available at the American College of Gastroenterology journal online.
Figure 4
Figure 4
Area under the curve (AUC) of colonic volumes postprandially (times between t=0 to t=360 min) showing the significant increase in irritable bowel syndrome with constipation (IBS-C) largely due to the increased transverse colon (TC). A full color version of this figure is available at the American College of Gastroenterology journal online.
Figure 5
Figure 5
Whole-gut transit time between irritable bowel syndrome (IBS) subtypes and healthy volunteers (HV). A full color version of this figure is available at the American College of Gastroenterology journal online.
Figure 6
Figure 6
(a) Correlation between transverse colon (TC) volume and VAS bloating score at t=405 min for all subjects. (b) Correlation between TC volume and VAS bloating score at t=405 min for irritable bowel syndrome with constipation (IBS-C). (c) Correlation between TC volume and VAS bloating score at t=405 min for IBS with diarrhea (IBS-D). (d) Correlation between TC volume and VAS bloating score at t=405 min for IBS with mixed bowel habit (IBS-M).

Comment in

  • Enigma of Intestinal Gas in Irritable Bowel Syndrome.
    Uno Y. Uno Y. Am J Gastroenterol. 2017 Jul;112(7):1166-1167. doi: 10.1038/ajg.2017.75. Am J Gastroenterol. 2017. PMID: 28725060 No abstract available.
  • Response to Uno.
    Lam C, Chaddock G, Laurea LM, Costigan C, Cox E, Hoad C, Pritchard S, Gowland P, Spiller R. Lam C, et al. Am J Gastroenterol. 2017 Jul;112(7):1167. doi: 10.1038/ajg.2017.144. Am J Gastroenterol. 2017. PMID: 28725068 No abstract available.

Comment on

References

    1. Palsson OS, Baggish JS, Turner MJ et al. IBS patients show frequent fluctuations between loose/watery and hard/lumpy stools: implications for treatment. Am J Gastroenterol 2012;107:286–295. - PMC - PubMed
    1. Marciani L, Cox EF, Hoad CL et al. Postprandial changes in small bowel water content in healthy subjects and patients with irritable bowel syndrome. Gastroenterology 2010;138:469–477 477.e1. - PubMed
    1. Pritchard SE, Marciani L, Garsed KC et al. Fasting and postprandial volumes of the undisturbed colon: normal values and changes in diarrhea-predominant irritable bowel syndrome measured using serial MRI. Neurogastroenterol Motil 2014;26:124–130. - PMC - PubMed
    1. Lam C, Chaddock G, Marciani L et al. Colonic response to laxative ingestion as assessed by MRI differs in constipated irritable bowel syndrome compared to functional constipation. Neurogastroenterol Motil 2016;28:861–870. - PMC - PubMed
    1. Chaddock G, Lam C, Hoad CL et al. Novel MRI tests of orocecal transit time and whole gut transit time: studies in normal subjects. Neurogastroenterol Motil 2014;26:205–214. - PMC - PubMed

MeSH terms