

General calibration of microbial growth in microplate readers
- PMID: 27958314
- PMCID: PMC5153849
- DOI: 10.1038/srep38828
General calibration of microbial growth in microplate readers
Abstract
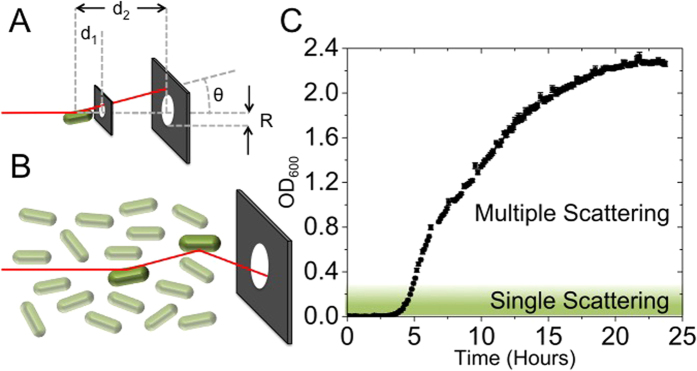
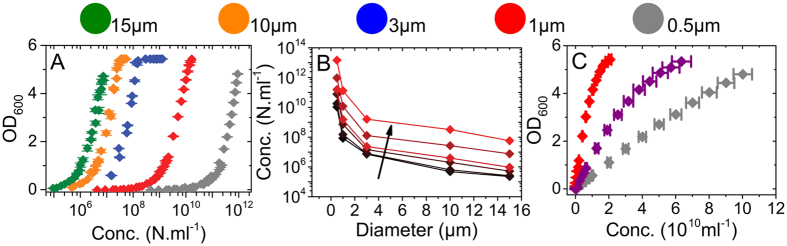
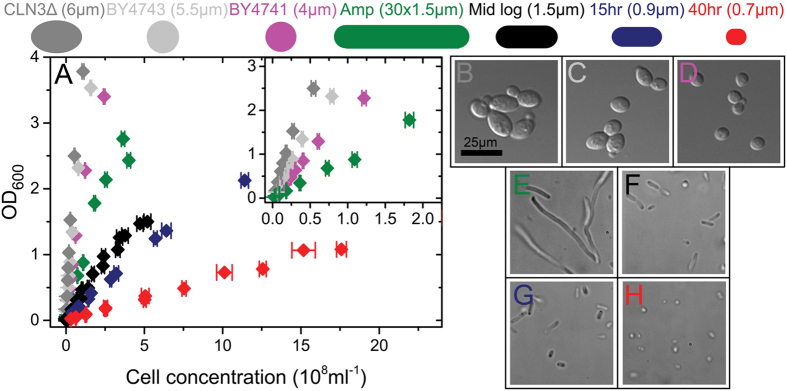
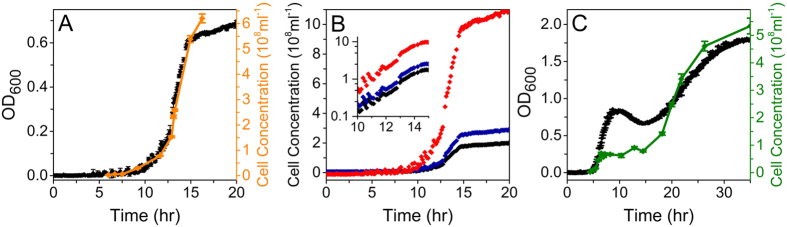
Optical density (OD) measurements of microbial growth are one of the most common techniques used in microbiology, with applications ranging from studies of antibiotic efficacy to investigations of growth under different nutritional or stress environments, to characterization of different mutant strains, including those harbouring synthetic circuits. OD measurements are performed under the assumption that the OD value obtained is proportional to the cell number, i.e. the concentration of the sample. However, the assumption holds true in a limited range of conditions, and calibration techniques that determine that range are currently missing. Here we present a set of calibration procedures and considerations that are necessary to successfully estimate the cell concentration from OD measurements.
Figures
Similar articles
-
Rapid growth rate of Enterobacter sp. SM3 determined using several methods.BMC Microbiol. 2024 Oct 10;24(1):403. doi: 10.1186/s12866-024-03547-3. BMC Microbiol. 2024. PMID: 39390418 Free PMC article.
-
Environmental factors influencing the relationship between optical density and cell count for Listeria monocytogenes.J Appl Microbiol. 2005;99(6):1503-15. doi: 10.1111/j.1365-2672.2005.02727.x. J Appl Microbiol. 2005. PMID: 16313423
-
Revisiting with a relative-density calibration approach the determination of growth rates of microorganisms by use of optical density data from liquid cultures.Appl Environ Microbiol. 2010 Mar;76(5):1683-5. doi: 10.1128/AEM.00824-09. Epub 2010 Jan 15. Appl Environ Microbiol. 2010. PMID: 20081003 Free PMC article.
-
Growth curve prediction from optical density data.Int J Food Microbiol. 2012 Mar 15;154(3):169-76. doi: 10.1016/j.ijfoodmicro.2011.12.035. Epub 2012 Jan 4. Int J Food Microbiol. 2012. PMID: 22280888
-
Comparison of microbiological and physicochemical methods for enumeration of microorganisms.Postepy Hig Med Dosw (Online). 2014 Jan 2;68:1392-6. doi: 10.5604/17322693.1130086. Postepy Hig Med Dosw (Online). 2014. PMID: 25531702 Review.
Cited by
-
Absolute protein quantification using fluorescence measurements with FPCountR.Nat Commun. 2022 Nov 3;13(1):6600. doi: 10.1038/s41467-022-34232-6. Nat Commun. 2022. PMID: 36329019 Free PMC article.
-
Decomposing biophotovoltaic current density profiles using the Hilbert-Huang transform reveals influences of circadian clock on cyanobacteria exoelectrogenesis.Sci Rep. 2022 Jun 29;12(1):10962. doi: 10.1038/s41598-022-15111-y. Sci Rep. 2022. PMID: 35768500 Free PMC article.
-
Calibration of an Upconverting Phosphor-Based Quantitative Immunochromatographic Assay for Detecting Yersinia pestis, Brucella spp., and Bacillus anthracis Spores.Front Cell Infect Microbiol. 2020 Apr 24;10:147. doi: 10.3389/fcimb.2020.00147. eCollection 2020. Front Cell Infect Microbiol. 2020. PMID: 32391285 Free PMC article.
-
Deciphering microbial interactions in synthetic human gut microbiome communities.Mol Syst Biol. 2018 Jun 21;14(6):e8157. doi: 10.15252/msb.20178157. Mol Syst Biol. 2018. PMID: 29930200 Free PMC article.
-
XTT assay for detection of bacterial metabolic activity in water-based polyester polyurethane.PLoS One. 2024 Jun 6;19(6):e0303210. doi: 10.1371/journal.pone.0303210. eCollection 2024. PLoS One. 2024. PMID: 38843174 Free PMC article.
References
-
- Neidhardt F. C. Escherichia coli and Salmonella: Cellular and Molecular Biology (ASM, 1996).
-
- Scott M., Gunderson C. W., Mateescu E. M., Zhang Z. & Hwa T. Interdependence of Cell Growth and Gene Expression: Origins and Consequences. Science 330, 1099–1102 (2010). - PubMed
-
- Andrews J. M. Determination of minimum inhibitory concentrations. J Antimicrob Chemoth 48, 5–16 (2001). - PubMed
Publication types
MeSH terms
Grants and funding
LinkOut - more resources
Full Text Sources
Other Literature Sources
Molecular Biology Databases
