. 2016 Dec 13:6:38863.
doi: 10.1038/srep38863.

Genetically targeted 3D visualisation of Drosophila neurons under Electron Microscopy and X-Ray Microscopy using miniSOG

Affiliations

Genetically targeted 3D visualisation of Drosophila neurons under Electron Microscopy and X-Ray Microscopy using miniSOG

Julian Ng et al. Sci Rep. .

Abstract

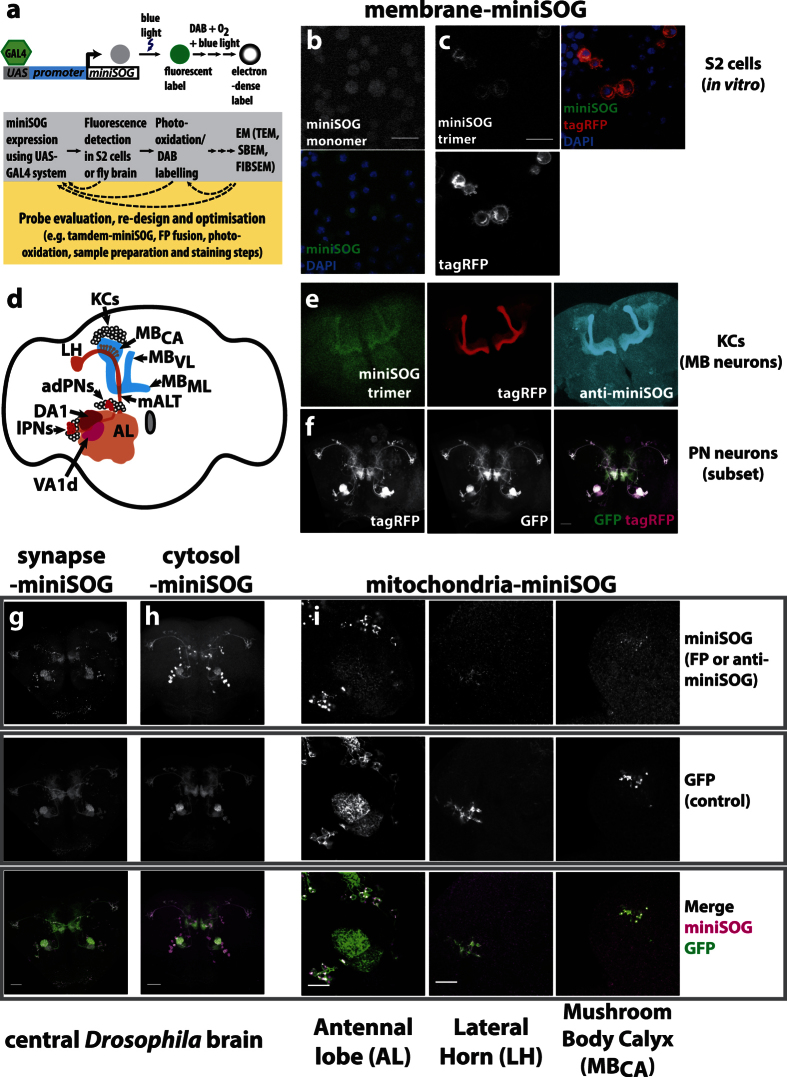
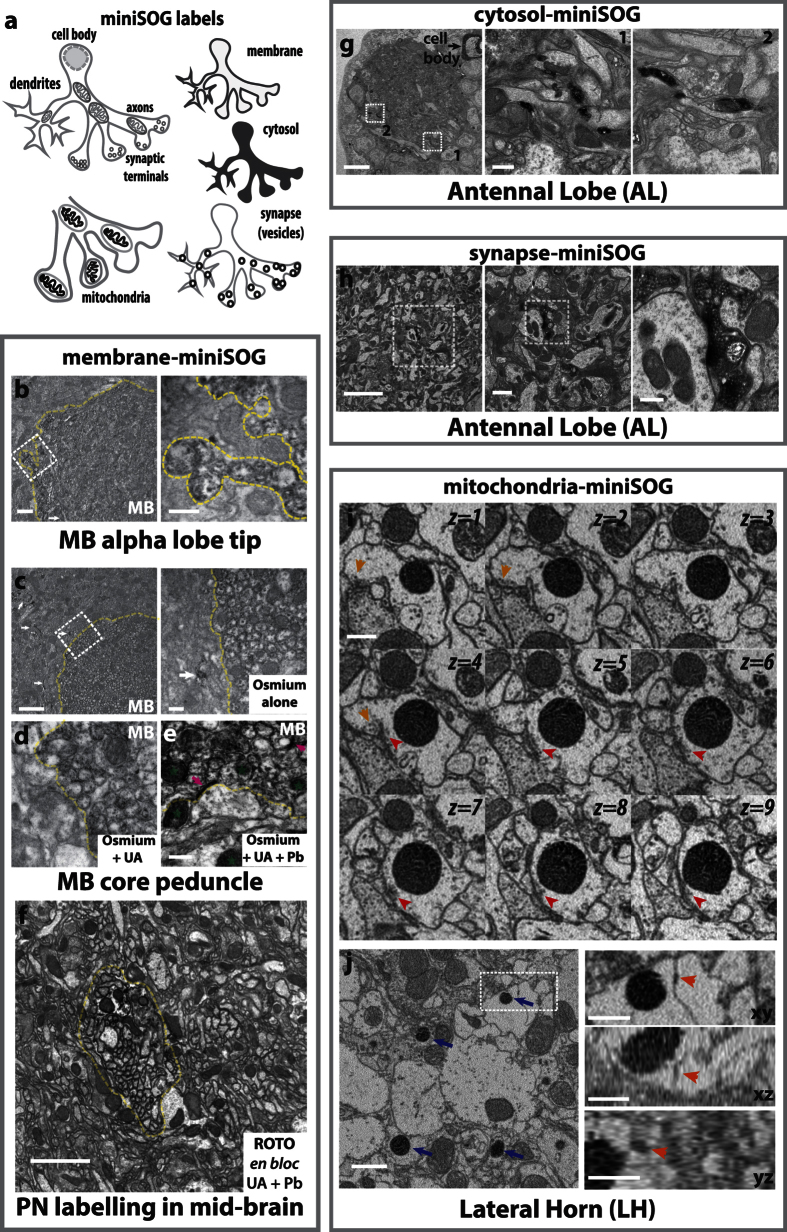
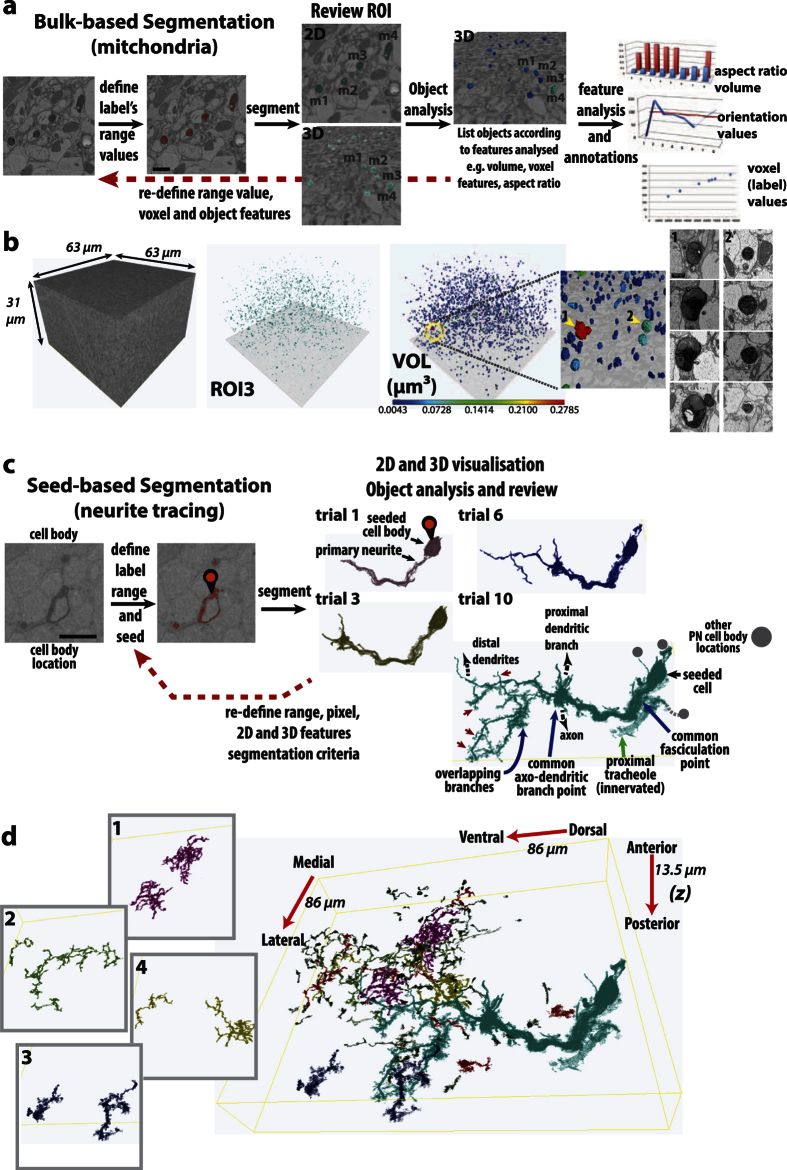
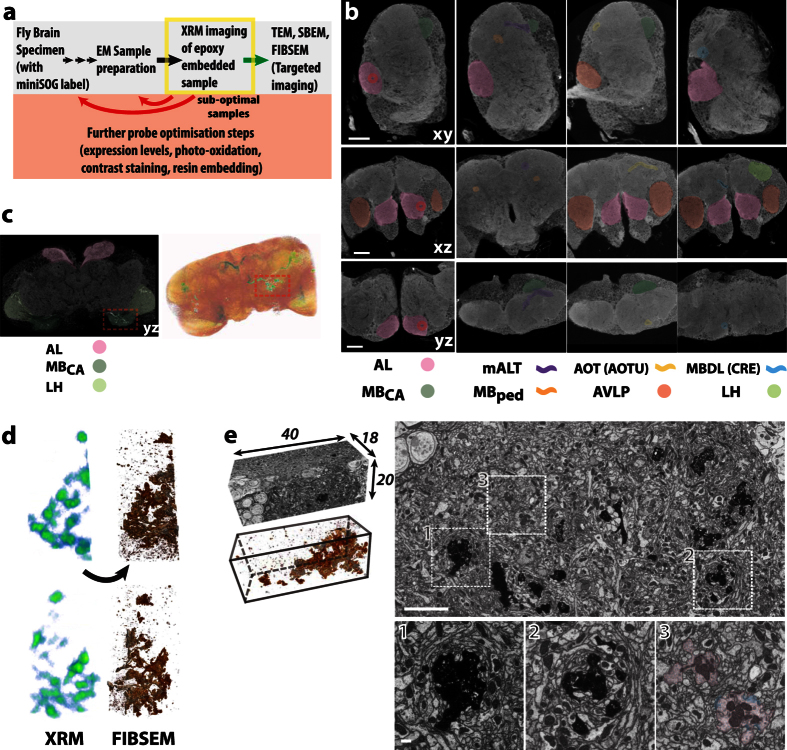
Large dimension, high-resolution imaging is important for neural circuit visualisation as neurons have both long- and short-range patterns: from axons and dendrites to the numerous synapses at terminal endings. Electron Microscopy (EM) is the favoured approach for synaptic resolution imaging but how such structures can be segmented from high-density images within large volume datasets remains challenging. Fluorescent probes are widely used to localise synapses, identify cell-types and in tracing studies. The equivalent EM approach would benefit visualising such labelled structures from within sub-cellular, cellular, tissue and neuroanatomical contexts. Here we developed genetically-encoded, electron-dense markers using miniSOG. We demonstrate their ability in 1) labelling cellular sub-compartments of genetically-targeted neurons, 2) generating contrast under different EM modalities, and 3) segmenting labelled structures from EM volumes using computer-assisted strategies. We also tested non-destructive X-ray imaging on whole Drosophila brains to evaluate contrast staining. This enabled us to target specific regions for EM volume acquisition.


Conflict of interest statement

The authors declare no competing financial interests.

Figures

Figure 1
Figure 1. Design, expression and detection of miniSOG under fluorescence microscopy.
(a) A design summary using miniSOG for EM-based labelling in Drosophila. Membrane-targeted miniSOG (membrane-miniSOG) probes were expressed either as a monomer (b), or trimer (c) in S2 cells. Fluorescence images to miniSOG, RFP or nuclear DAPI are shown. miniSOG fluorescence imaging resulted in higher backgrounds. Due to photobleaching, it was not possible to gather enough signals to detect monomeric miniSOG. Scale bars: 20 µm. (d) Schematic of MB neurons (also known as Kenyon cells or KCs) and a subset of projection neurons (PNs) in the Drosophila adult brain. From anterior dorsal (ad) or lateral (l) cell body locations, most PNs dendrites densely innervate single glomerular locations. Projecting posteriorly along the medial AL Tract (mALT) to dorsolateral locations, PN axons have long-range projections that terminate at the mushroom body calyx (MBCA) and lateral horn (LH). At the MBCA, PN axon terminals connect with KC dendrites. From dorsal-posterior locations, KCs extend axon anteriorly and bifurcate to form the vertical lobe (MBVL) and medial lobe (MBML). The UAS-GAL4 system was used to express miniSOG products in these neurons. The OK107-GAL4 labels KCs. Mz19-GAL4 expression labels PN subsets, which innervated glomeruli DA1, VA1d, DC3 within the AL. DC3 is not visible from the AL surface. Although these are bilaterally specified, only the left hemisphere is illustrated. (e) Membrane-miniSOG expression in KCs, visualised by miniSOG or tagRFP fluorescence, or by immunostaining. Despite high, non-specific background, immunolabels correlated well with miniSOG and RFP. (f) Membrane-miniSOG expression in PN subsets, using Mz-GAL4. As a control, a membrane-GFP reporter was co-expressed to determine the extent of overlapping projection patterns with miniSOG. Synapse (g), cytosol (h) and mitochondria (i) targeted miniSOG expression in PN cells, verified by fluorescence microscopy. miniSOG patterns were visualised by miniSOG immunostaining, (h,i) or through the fluorescent mKate2 fusion protein (g). This choice depended on the designed probe and expression levels detected. To compare overlapping expression patterns, these brains also co-expressed UAS membrane-bound GFP. Images were acquired from the brain region indicated. Scale bars: 40 µm.
Figure 2
Figure 2. miniSOG targeting and EM contrast detection.
(a) Summary of miniSOG probes used to label neuronal sub-compartments. (b,c) TEM micrographs of membrane-miniSOG labelled KCs. Higher magnifications are shown on the right. miniSOG labelling is evident on membranes and proximal cytoplasm. Dashed yellow lines: MB neuropil border. Using OK107-GAL4, some non-KC neurons also evidently miniSOG+ (arrowhead). Scale bars: 1, 2 µm (b and c, respectively) or 300 nm (insets). (d,e) On-section staining using uranyl acetate (UA) and lead citrate (Pb). Adjacent thin sections from the same specimen used in c were used. Note the enhanced contrast on DAB-labelled and non-DAB regions: membranes, synaptic densities (magenta arrows) and mitochondria (green stars) and cytosol. Scale bars: 300 nm (d,e). (f) TEM micrographs from a sample treated using ROTO, with en bloc UA and Pb. Highly contrasted membranes on labelled PN (using GH146-GAL4) is evident. Yellow dashed lines: PN neuropil boundary. Scale bar: 2 µm. TEM micrographs showing cytosol (g) or synapse (h) targeted miniSOG in PN dendrites (using Mz19-GAL4). Left, labelled cell body corresponds to a single adPN. Synapse labelling was achieved using Synatotagmin-miniSOG, contrasting the pre-synapse and synaptic vesicles. The presence pre-synaptic components in PN dendrites are consistent with previous observations made under light microscopy and EM. The specimens were treated with ROTO (g,h), with en bloc UA and Pb (h). Scale bars: 5 µm and for insets: 500 nm (for g), 1 µm or 300 nm (mid and right insets for h, respectively). (I,j) SBEM micrographs of a specimen containing mitochondria-targeted miniSOG in PN axons. (i) xy sections of a single labelled mitochondrion are shown. Each z-section is spaced 50 nm apart. Synaptic features (orange and red arrowheads) are in close proximity. (j) Several labelled mitochondria are visible (blue arrows). Highlighted on the right are multi-planar views of a putative gap junction (orange arrowheads) next to a labelled mitochondrion. Specimen was treated with ROTO with en bloc UA and Pb. TEM and SBEM images were obtained from brain neuropil regions indicated (transverse sections). Scale bars: 500 nm (i) and insets in j, or 1 µm (j).
Figure 3
Figure 3. EM volume acquisition and computer-assisted segmentation of labelled volumes.
(a) Bulk segmentation was applied to the mitochondria-miniSOG labelled volume. Selected range values, corresponding to miniSOG contrast (red), correlated with the labeled mitochondria. Following initial segmentation, further filtering steps were applied (see Methods). The segmented subset (ROI3) can be examined in 2D and 3D. An Object Analysis procedure produces a mesh and lists the objects identified, with their analysed features. The volume feature for a subset of mitochondria (m1–4) is displayed. The graphs on the right are for illustration purposes only. Scale bar: 1 µm. (b) Summary of the mitochondria-miniSOG found within the acquired volume. The desired subset (ROI3, cyan-green) can be visualized in 3D and feature-displayed according to volume (VOL); colour-indexed blue–red, from the smallest (0.0043 μm3) to largest (0.2785 μm3), respectively. The ultrastructure of the largest mitochondrion (1) can be inspected further and compared against another (2). (c) Seed-based segmentation used to trace cytosol-miniSOG labeled neurites. Following range value selection, a seeding point (pin icon) was placed at the cell body, initiating the 3D segmentation process. Several trials were performed, whereby successively lower pixel intensities were sampled (trial/ROI 1–12). Trial/ROI1 traced primary neurites of the seeded cell body. Subsequent trials incorporated increasingly distal structures that included thin protrusions from dendrite segments (red arrowheads). Other traces represent overlapping segments. These ‘crossovers’ occur when several PNs are labeled; having common cell body locations, branching points or overlapping branch segments. Given its proximity and elevated contrast, a PN-innervated trachiole (green arrow) also becomes incorporated when low range values were used. Scale bar: 500 nm. Thus, two distinct events take place as increasingly lower values are sampled. Distal branches and terminal structures are included to the primary seed. However, non-related, overlapping neurites, cell bodies and contrasted structures can also become incorporated. (d) By seed segmentation, additional traces were also performed within the sub-volume, based on range values in Trial10. A subset of these neurites (1–4) is highlighted, and a composite (with the labeled PN cell) is shown on the right. The different colour highlights are used to aid visualization.
Figure 4
Figure 4. Whole fly brain miniSOG detection with correlative XRM-FIBSEM imaging.
(a) Schematic XRM-EM workflow used to screen fly brain samples optimized for heavy metal contrast and for targeted volume acquisition. (b) XRM tomograms were viewed from 3 virtual plane sections: xy, xz and yz. Many notable neuropil regions were discernable, highlighting the AL, MBCA, and anterior ventrolateral protocerebrum (AVLP). Visible tracts included the MBped, mALT the Anterior Optic tract (AOT) and the Median Bundle (MDBL). These were previously seen under light microscopy. Each vertical set of 3 sections focuses on one particular region of the brain (AL, mALT, Anterior Optic Tubercle (AOTU) and Crepine (CRE),, respectively). Their slice coordinates are 603, 745, 560 and 1041 for XY; 413, 708, 470 and 434 for XZ; 903, 305, 317 and 611 for XZ. The inter-slice distance is 200 nm. Total volume dimension of the tomogram is 378 × 390 × 380 µm. Scale bars: 50 µm. (c) Left, A single virtual XRM section image of a fly brain specimen with cytosol-miniSOG labeled PNs. The AL, MBCA and LH locations are highlighted. Right, 3D volume rendered image of the entire specimen. When threshold is applied, the miniSOG contrast is recognisable, appearing in green and red, based on a blue-red color ramp for low-high signals. Note the uneven PN labeling on the left side of the brain. As such, the right MBCA, boxed in red, was selected for FIBSEM volume acquisition. (d) Left, Correlated threshold images from XRM (green-red) and FIBSEM (as copper-silver for low-high signal intensities) tomograms, shown from two perspectives. (e) Left: FIBSEM volume of MBCA (dimensions indicated in µm; voxel size: 10 nm isotropic). Below, thresholding reveals the miniSOG label. Right: Single xy section, with higher magnification from the inset regions, below. The high contrast, appearing as black, corresponds to miniSOG labeled PN terminals. A single non-miniSOG labelled PN terminal is highlighted, in pink, for comparison. Due to technical difficulties, it was not possible to obtain higher resolution of synapses from this specimen. However, some synaptic densities and vesicles are discernable, some of which are outlined in blue. This specimen was treated using ROTO only. Scale bars: 5 µm, 500 nm for inset.

References

    1. Lichtman J. W. & Denk W. The big and the small: challenges of imaging the brain’s circuits. Science 334, 618–623, doi: 10.1126/science.1209168 (2011). - DOI - PubMed
    1. Helmstaedter M. Cellular-resolution connectomics: challenges of dense neural circuit reconstruction. Nat Methods 10, 501–507, doi: 10.1038/nmeth.2476 (2013). - DOI - PubMed
    1. Briggman K. L. & Bock D. D. Volume electron microscopy for neuronal circuit reconstruction. Curr Opin Neurobiol 22, 154–161, doi: 10.1016/j.conb.2011.10.022 (2012). - DOI - PubMed
    1. Kuwajima M., Mendenhall J. M., Lindsey L. F. & Harris K. M. Automated transmission-mode scanning electron microscopy (tSEM) for large volume analysis at nanoscale resolution. PLoS One 8, e59573, doi: 10.1371/journal.pone.0059573 (2013). - DOI - PMC - PubMed
    1. Peddie C. J. & Collinson L. M. Exploring the third dimension: volume electron microscopy comes of age. Micron 61, 9–19, doi: 10.1016/j.micron.2014.01.009 (2014). - DOI - PubMed

Publication types

LinkOut - more resources