

Diabetes and Cause-Specific Mortality in Mexico City
- PMID: 27959614
- PMCID: PMC5215048
- DOI: 10.1056/NEJMoa1605368
Diabetes and Cause-Specific Mortality in Mexico City
Abstract
Background: Most large, prospective studies of the effects of diabetes on mortality have focused on high-income countries where patients have access to reasonably good medical care and can receive treatments to establish and maintain good glycemic control. In those countries, diabetes less than doubles the rate of death from any cause. Few large, prospective studies have been conducted in middle-income countries where obesity and diabetes have become common and glycemic control may be poor.
Methods: From 1998 through 2004, we recruited approximately 50,000 men and 100,000 women 35 years of age or older into a prospective study in Mexico City, Mexico. We recorded the presence or absence of previously diagnosed diabetes, obtained and stored blood samples, and tracked 12-year disease-specific deaths through January 1, 2014. We accepted diabetes as the underlying cause of death only for deaths that were due to acute diabetic crises. We estimated rate ratios for death among participants who had diabetes at recruitment versus those who did not have diabetes at recruitment; data from participants who had chronic diseases other than diabetes were excluded from the main analysis.
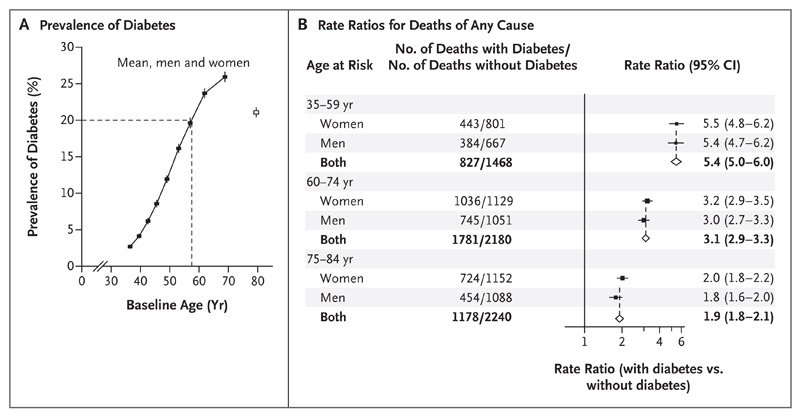
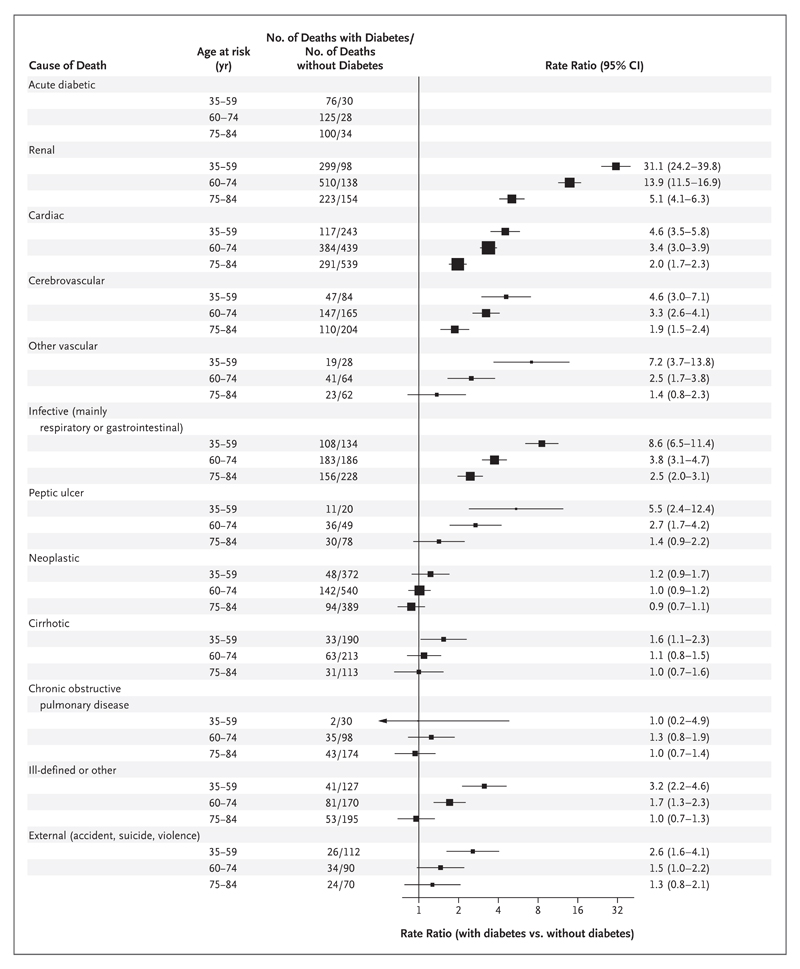
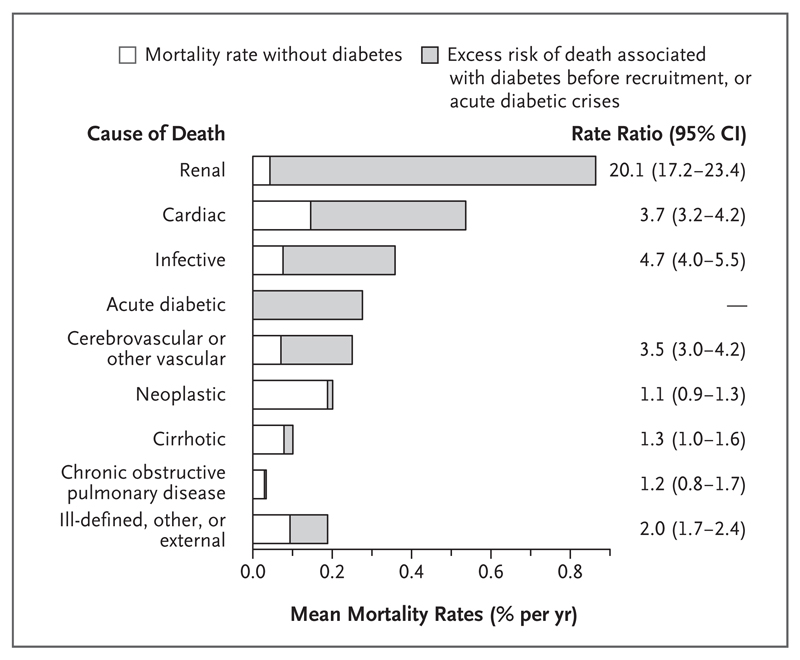
Results: At the time of recruitment, obesity was common and the prevalence of diabetes rose steeply with age (3% at 35 to 39 years of age and >20% by 60 years of age). Participants who had diabetes had poor glycemic control (mean [±SD] glycated hemoglobin level, 9.0±2.4%), and the rates of use of other vasoprotective medications were low (e.g., 30% of participants with diabetes were receiving antihypertensive medication at recruitment and 1% were receiving lipid-lowering medication). Previously diagnosed diabetes was associated with rate ratios for death from any cause of 5.4 (95% confidence interval [CI], 5.0 to 6.0) at 35 to 59 years of age, 3.1 (95% CI, 2.9 to 3.3) at 60 to 74 years of age, and 1.9 (95% CI, 1.8 to 2.1) at 75 to 84 years of age. Between 35 and 74 years of age, the excess mortality associated with previously diagnosed diabetes accounted for one third of all deaths; the largest absolute excess risks of death were from renal disease (rate ratio, 20.1; 95% CI, 17.2 to 23.4), cardiac disease (rate ratio, 3.7; 95% CI, 3.2 to 4.2), infection (rate ratio, 4.7; 95% CI, 4.0 to 5.5), acute diabetic crises (8% of all deaths among participants who had previously diagnosed diabetes), and other vascular disease (mainly stroke). Little association was observed between diabetes and mortality from cirrhosis, cancer, or chronic obstructive pulmonary disease.
Conclusions: In this study in Mexico, a middle-income country with high levels of obesity, diabetes was common, glycemic control was poor, and diabetes was associated with a far worse prognosis than that seen in high-income countries; it accounted for at least one third of all deaths between 35 and 74 years of age. (Funded by the Wellcome Trust and others.).
Conflict of interest statement
No other potential conflict of interest relevant to this article was reported.
Figures
Comment in
-
Diabetes: High diabetes-mellitus-linked mortality in Mexico.Nat Rev Endocrinol. 2017 Feb;13(2):66. doi: 10.1038/nrendo.2016.204. Epub 2016 Dec 2. Nat Rev Endocrinol. 2017. PMID: 27910880 No abstract available.
References
-
- International Diabetes Federation diabetes atlas. 7th edition. Brussels: International Diabetes Federation; 2015. http://www.diabetesatlas.org/
-
- Danaei G, Finucane MM, Lu Y, et al. National, regional, and global trends in fasting plasma glucose and diabetes prevalence since 1980: systematic analysis of health examination surveys and epidemiological studies with 370 country-years and 2.7 million participants. Lancet. 2011;378:31–40. - PubMed
-
- Yusuf S, Islam S, Chow CK, et al. Use of secondary prevention drugs for cardiovascular disease in the community in high-income, middle-income, and low-income countries (the PURE study): a prospective epidemiological survey. Lancet. 2011;378:1231–43. - PubMed
Publication types
MeSH terms
Substances
Grants and funding
LinkOut - more resources
Full Text Sources
Other Literature Sources
Medical