. 2016 Dec 13;11(12):e0167850.
doi: 10.1371/journal.pone.0167850. eCollection 2016.

Sound-Induced Intracellular Ca2+ Dynamics in the Adult Hearing Cochlea

Affiliations

Sound-Induced Intracellular Ca2+ Dynamics in the Adult Hearing Cochlea

Dylan K Chan et al. PLoS One. .

Abstract

Ca2+ signaling has been implicated in the initial pathophysiologic mechanisms underlying the cochlea's response to acoustic overstimulation. Intracellular Ca2+ signaling (ICS) waves, which occur in glia and retinal cells in response to injury to activate cell regulatory pathways, have been proposed as an early event in cochlear injury. Disruption of ICS activity is thought to underlie Connexin 26-associated hearing loss, the most common genetic form of deafness, and downstream sequelae of ICS wave activity, such as MAP kinase pathway activation, have been implicated in noise-induced hearing loss. However, ICS waves have only been observed in neonatal cochlear cultures and are thought to be quiescent after the onset of hearing. In this study, we employ an acute explant model of an adult, hearing cochlea that retains many in vivo physiologic features to investigate Ca2+ changes in response to sound. We find that both slow monotonic changes in intracellular Ca2+ concentration as well as discrete ICS waves occur with acoustic overstimulation. The ICS waves share many intrinsic features with their better-described neonatal counterparts, including ATP and gap-junction dependence, and propagation velocity and distance. This identification of ICS wave activity in the adult, hearing cochlea thus confirms and characterizes an important early detection mechanism for cochlear trauma and provides a target for interventions for noise-induced and Connexin 26-associated hearing loss.


Conflict of interest statement

The authors have declared that no competing interests exist.

Figures
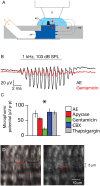
Fig 1
Fig 1. Explant preparation of the adult gerbil middle cochlear turn.
A. Schematic diagram of the cochlear explant (black) mounted on a plastic cover slip (dark gray) in a two-chamber recording apparatus (light gray). Delivery of sound pressure with an attached earphone (orange) is transmitted through artificial perilymph (AP, dark blue) to the basilar membrane (red), whose apical surface is immersed in artificial endolymph (AE). Epifluorescence and transmitted-light stroboscopic microscopy are performed with a 60x water-immersion objective (O). Transepithelial potential is provided, and microphonic potential recorded, using paired Ag/AgCl stimulation and receiver electrodes (SE, RE, respectively). B. Microphonic potential. Transepithelial microphonic field potential was recorded in response to 1 kHz, 103 dB SPL sound stimulus (gray line) in artificial endolymph (AE, black) or AE + 1 mM gentamicin (red). C. Effect of drugs on microphonic potential. The microphonic potential was measured in response to 1 kHz, 103 dB SPL sound stimulus in the presence of artificial endolymph (AE, white), or artificial endolymph containing 40 U/l apyrase (red), 1 mM gentamicin (green), 100 μM CBX (blue), or 1 μM thapsigargin (gray). N = 5 explants for each. Bars indicate means, and lines indicate standard errors of the mean; asterisks indicate p < 0.05 in unpaired t-test between gentamicin and AE. D. Videostroboscopy of sound-stimulated explant organ of Corti. Stroboscopic still images from an explant preparation undergoing 1 kHz, 103 dB SPL sound stimulation are shown at maximal positive and negative deflection. Radial motion of the IHC hair bundle was used to calibrate the sound-pressure level delivered to the organ of Corti.
Fig 2
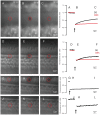
Fig 2. Fluorescence recovery after photobleaching (FRAP).
FRAP was performed on supporting cells of the outer sulcus of P3 neonatal cochlear cultures (A-C, top row), as well as on pillar cells (D-F, second row from top), IHCs (G-I, third row from top), and OHCs (J-L, bottom row) from adult cochlear explants. Cells were loaded with calcein dye. After baseline imaging (A, D, G, J), a 5-μm spot was laser-photobleached (B, E, H, K; vertical arrow) and fluorescence recovery measured (C, F, I, L). Fluorescence timecourses were recorded in dissecting solution (DS, for neonatal cultures, black line) or artificial endolymph (AE, for adult explants, black line) or in DS or AE with 100 μM CBX (red lines).
Fig 3
Fig 3. Noise-induced [Ca2+]i changes in the gerbil cochlea in vitro.
A. Sound-induced [Ca2+]i changes. Sample traces illustrating [Ca2+]i changes in outer hair cells (OHC), inner hair cells (IHC) and pillar cells (PC) in response to application of 1 kHz sound pressure at 103 dB SPL. Black lines: response in artificial endolymph alone. Red lines: response in artificial endolymph containing 40 U/l apyrase. Vertical axis depicts the ratio between fluorescence elicited by 340 nm/387 nm excitation wavelengths, which is proportional to [Ca2+]i B. Change in 340/387 ratioI (delta(340/387)) relative to baseline in OHCs, IHCs, and PCs 80 s (white) and 300 s (gray) after the start of a 103 dB SPL, 1000 Hz sound stimulus in artificial endolymph. Bars indicate means and lines indicate standard errors of the mean from 5 independent explants; asterisks indicate p < 0.05 in paired t-test between 80s and 300s values. C. Change in 340/387 ratio 80 s after sound initiation was measured in the presence of 40 U/l apyrase (red), 1 mM gentamicin (green), 100 μM CBX (blue), or 1 μM thapsigargin (white). Bars represent means, and lines 95% CI of the difference in delta(340/387) compared to that measured in artificial endolymph (Fig 3b). For thapsigargin, delta(340/387) at 300 s is additionally shown (gray bars), and was compared to the value at 300 s in artificial endolymph alone (N = 5). Asterisks indicate p < 0.05 relative to no difference between drug and artificial endolymph.
Fig 4
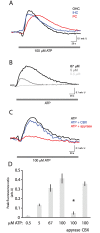
Fig 4. ATP-induced [Ca2+]i changes in the gerbil cochlea in vitro.
A. ATP-induced Ca2+ influx into cochlear cells. Bath application of 100 μM ATP in artificial endolymph (gray bar) to a single cochlear explant induces a large increase in fluorescence ratio (340/387) (proportional to [Ca2+]i) in OHCs, IHCs, and pillar cells (PC). B. Dose-response of Ca2+ influx to repeated applications of three different concentrations of ATP in a single explant. C. Pharmacologic response. Ca2+ increase in response to 100 μM ATP in a single explant is sensitive to 40 U/l apyrase, but not to 100 μM CBX. D. Peak fluorescence ratio upon treatment with different concentrations of ATP, or upon co-treatment with 40 U/l apyrase or 100 μM CBX, is shown in aggregate (N = 3 explants for each measurement). Asterisk indicates significant attenuation (p < 0.01) of the response to 100 μM ATP in the presence of apyrase relative to exposure to 100 μM ATP alone. Bars indicate means; lines indicate standard errors of the mean.
Fig 5
Fig 5. ICS wave activity in neonatal and adult cochleae.
A. Neonatal culture ICS activity. A spontaneously occurring ICS wave in the inner sulcus (IS) region of a P3 neonatal cochlear culture was regularly seen to initiate within the IS and propagate bidirectionally along the longitudinal axis of the cochlea. Outer hair cell (OHC) rows are shown as reference. B. Adult explant ICS activity. A qualitatively similar ICS wave was seen to initiate and propagate within the pillar-cell (PC) row of the adult cochlear explant in response to acoustic overstimulation. C. ICS wave measurement. Graph of individual-cell [Ca2+]i (colored circles) shows a peak propagating in time and space for both neonatal (upper) and adult (lower) cochlear explants. D. ICS wave velocity. Neonatal (light gray line, diamonds) and adult (black line, circles) wave velocities were calculated from the peaks in (C). E. ICS wave properties. Neonatal (light gray) and adult (dark gray) ICS waves exhibited similar velocity (left) and propagation distance (center). Neonatal waves had somewhat increased ICS wave amplitude (right), but this was highly variable. N = 7 waves, each from a unique, independent culture or explant, were examined for each. Bars indicate means; lines indicate standard errors of the mean.
Fig 6
Fig 6. Noise-induced threshold shift in Cx26 cKO mice.
Click ABR thresholds were measured in wild-type (WT, white, N = 7) and Cx26 conditional knockout (Cx26 cKO, gray, N = 8) mice before (baseline) and 1, 3, 7, and 18 days (PED1-18) after exposure to 1 hr of 8–16 kHz octave-band noise at 106 dB SPL. Bars indicate means; lines indicate standard errors of the mean; asterisks indicate p < 0.05 by unpaired t-test.

Similar articles

Cited by

References

    1. Kopke RD, Jackson RL, Coleman JK, Liu J, Bielefeld EC, Balough BJ (2007). NAC for noise:From the bench top to the clinic. Hear Res 226:114–125. 10.1016/j.heares.2006.10.008 - DOI - PubMed
    1. Munoz DJB, Kendrick IS, Rassam M, Thorne PR (2001). Vesicular storage of adenosine triphosphate in the guinea-pig cochlear lateral wall and concentrations of ATP in the endolymph during sound exposure and hypoxia. Acta Otolaryngol 121:10–15. - PubMed
    1. Gale JE, Piazza V, Ciubotaru CD, Mammano F (2004). A Mechanism for sensing noise damage in the inner ear. Curr Biology 14:526–529. - PubMed
    1. Piazza V, Ciubotaru CD, Gale JE, Mammano F (2007). Purinergic signalling and intercellular Ca2+ wave propagation in the organ of Corti. Cell Calcium 41:77–86. 10.1016/j.ceca.2006.05.005 - DOI - PubMed
    1. Ceriani F, Mammano F (2012). Calcium signaling in the cochlea- Molecular mechanisms and physiopathological implications. Cell Communication and Signaling 2012, 10:20–32. - PMC - PubMed

Substances

LinkOut - more resources