. 2016 Dec 13;13(12):e1002197.
doi: 10.1371/journal.pmed.1002197. eCollection 2016 Dec.

Histological Transformation and Progression in Follicular Lymphoma: A Clonal Evolution Study

Affiliations

Histological Transformation and Progression in Follicular Lymphoma: A Clonal Evolution Study

Robert Kridel et al. PLoS Med. .

Abstract

Background: Follicular lymphoma (FL) is an indolent, yet incurable B cell malignancy. A subset of patients experience an increased mortality rate driven by two distinct clinical end points: histological transformation and early progression after immunochemotherapy. The nature of tumor clonal dynamics leading to these clinical end points is poorly understood, and previously determined genetic alterations do not explain the majority of transformed cases or accurately predict early progressive disease. We contend that detailed knowledge of the expansion patterns of specific cell populations plus their associated mutations would provide insight into therapeutic strategies and disease biology over the time course of FL clinical histories.

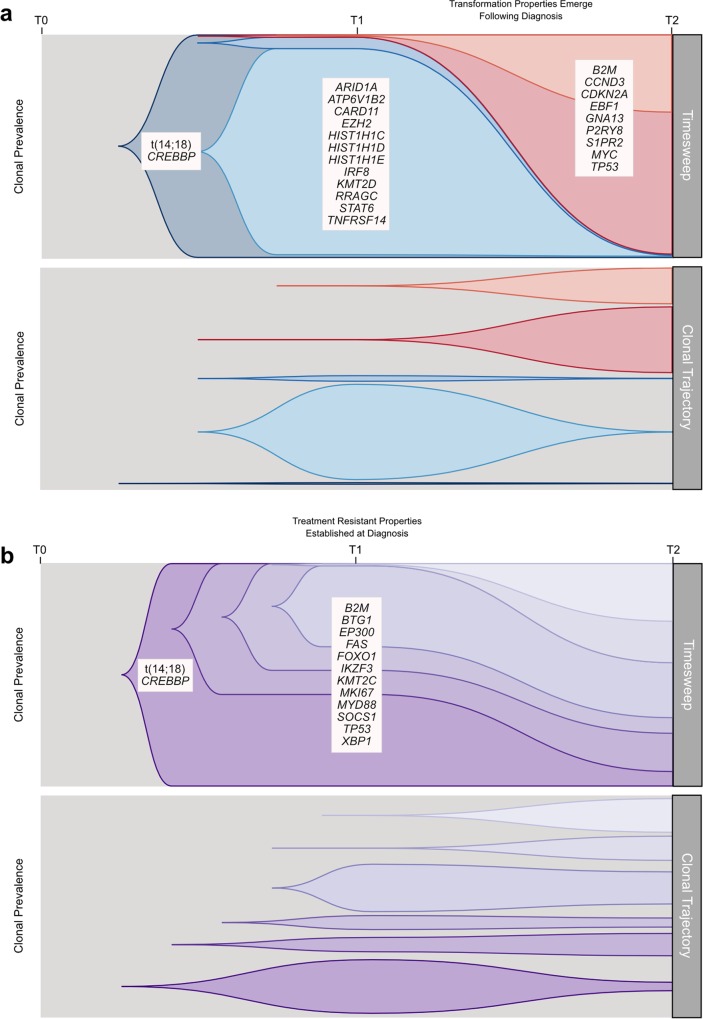
Methods and findings: Using a combination of whole genome sequencing, targeted deep sequencing, and digital droplet PCR on matched diagnostic and relapse specimens, we deciphered the constituent clonal populations in 15 transformation cases and 6 progression cases, and measured the change in clonal population abundance over time. We observed widely divergent patterns of clonal dynamics in transformed cases relative to progressed cases. Transformation specimens were generally composed of clones that were rare or absent in diagnostic specimens, consistent with dramatic clonal expansions that came to dominate the transformation specimens. This pattern was independent of time to transformation and treatment modality. By contrast, early progression specimens were composed of clones that were already present in the diagnostic specimens and exhibited only moderate clonal dynamics, even in the presence of immunochemotherapy. Analysis of somatic mutations impacting 94 genes was undertaken in an extension cohort consisting of 395 samples from 277 patients in order to decipher disrupted biology in the two clinical end points. We found 12 genes that were more commonly mutated in transformed samples than in the preceding FL tumors, including TP53, B2M, CCND3, GNA13, S1PR2, and P2RY8. Moreover, ten genes were more commonly mutated in diagnostic specimens of patients with early progression, including TP53, BTG1, MKI67, and XBP1.

Conclusions: Our results illuminate contrasting modes of evolution shaping the clinical histories of transformation and progression. They have implications for interpretation of evolutionary dynamics in the context of treatment-induced selective pressures, and indicate that transformation and progression will require different clinical management strategies.


Conflict of interest statement

I have read the journal's policy and the authors of this manuscript have the following competing interests: SPS is a founder and shareholder of Contextual Genomics Inc., developer of clinical genomic tests for cancer.

Figures

Fig 1
Fig 1. Study cohort overview.
Whole genome sequencing (top) and capture sequencing (extension) (bottom) cohorts, as well as the repartition of patients and samples into clinical groups. FL, follicular lymphoma; TFL, transformed follicular lymphoma.
Fig 2
Fig 2. High-level WGS analysis overview.
Number of genomic alterations by sample and by clinical group. For the TFL and PFL patients, the T1 and T2 sample are placed beside each other. Each panel represents a different mutation type (sSNV, sIndel, sCNA, structural rearrangement), with the number of mutations on the y-axes. Different colors represent the different categories of mutations within each mutation type. For sCNAs, the fraction of genome altered is plotted and copy number states are mutually exclusive. The somatic LOH class encapsulates all LOH events regardless of their absolute sCNA state (3N, 4N, etc.). Refer to S3 Table for more details on copy number state annotations. ABC, activated B-cell-like; BCLU, B cell lymphoma unclassified; COM, composite lymphoma; DLBC, diffuse large B cell lymphoma; FL, follicular lymphoma; GCB, germinal center B-cell-like; IHC, immunohistochemistry; LOH, loss of heterozygosity; NPFL, non-progressed follicular lymphoma; PFL, progressed follicular lymphoma; sCNA, somatic copy number alteration; sIndel, somatic small insertion or deletion; sSNV, somatic single nucleotide variant; TFL, transformed follicular lymphoma.
Fig 3
Fig 3. Comparative analysis between clinical groups.
(A) Genomic alteration load in T1 versus T2 samples (for TFL and PFL patients). A one-tailed Wilcoxon test was used to assess whether there was a higher mutational burden in T2 samples compared to T1 samples. (B) Number of genetic alterations by time point and by clinical group. A Kruskal-Wallis test was used to assess whether there were differences in mutational burden between the T1 samples of the TFL, PFL, and NPFL clinical groups. A one-tailed Wilcoxon test was used to assess whether there were differences in mutational burden between the T2 samples of the TFL and PFL clinical groups. NPFL, non-progressed follicular lymphoma; PFL, progressed follicular lymphoma; TFL, transformed follicular lymphoma.
Fig 4
Fig 4. Clonal phylogenies of transformed follicular lymphoma samples.
From mutation cellular prevalences to clonal phylogenies and clonal prevalences for TFL patients. For each given patient, the leftmost plot shows the PyClone cellular prevalence of each validated sSNV (i.e., somatic in the T1 and/or T2 sample) at T1 (x-axes) and T2 (y-axes), with each mutation colored by the cluster it belongs to. The next plot to the right represents the cluster cellular prevalence (mean cellular prevalence of all mutations in the cluster), with the size of the circle representing the number of mutations in the cluster. This is followed by a clonal phylogeny and then a stacked bar plot representing the clonal prevalence of each clone in the T1 and T2 sample. The colors of the clusters have no meaning across patients. The n in parentheses beside the cluster color and number represents the number of sSNVs in that cluster. R-CVP, cyclophosphamide, vincristine, and prednisone plus rituximab; sSNV, somatic single nucleotide variant; TFL, transformed follicular lymphoma.
Fig 5
Fig 5. Ultra-sensitive detection of low prevalence clones in T1 samples.
Shown are three mutations (A–C) in three patients (FL1012, FL1019, and FL2001) in which PyClone suggested that the expanded T2-dominant mutation clusters were present at near zero prevalence at T1. No evidence of read support, when compared to background, was found for the T2-associated mutation in the T1 sample for case FL1012, in contrast to cases FL1019 and FL2001 (leftmost plots). Background refers to variant allele frequencies of all possible single nucleotide changes in the vicinity of the mutation of interest (defined as up to 50 base pairs upstream and up to 50 base pairs downstream). The results are confirmed by digital droplet PCR (rightmost plots). Color coding in the digital droplet PCR plots is as follows: grey = empty droplets; blue = single-positive droplets for wild-type allele; purple = double-positive droplets; red = single-positive droplets for mutant allele.
Fig 6
Fig 6. Clonal phylogenies of progressed follicular lymphoma samples.
From mutation cellular prevalences to clonal phylogenies and clonal prevalences for each PFL patient. For each given patient, the leftmost plot shows the PyClone cellular prevalence of each validated sSNV (i.e., somatic in the T1 and/or T2 sample) at T1 (x-axes) and T2 (y-axes), with each mutation colored by the cluster it belongs to. The next plot to the right represents the cluster cellular prevalence (mean cellular prevalence of all mutations in the cluster), with the size of the dot representing the number of mutations in the cluster. This is followed by a clonal phylogeny and then a stacked bar plot representing the clonal prevalence of each clone in the T1 and T2 sample. The colors of the clusters have no meaning across patients. The n in parentheses beside the cluster color and number represents the number of sSNVs in that cluster. R, rituximab; R-CVP, cyclophosphamide, vincristine, and prednisone plus rituximab; sSNV, somatic single nucleotide variant; PFL, progressed follicular lymphoma.
Fig 7
Fig 7. Tumor evolution modeling in transformed and progressed follicular lymphoma patients.
Genetic drift modeling in TFL (A) and PFL (B) patients with an initial variant allele frequency of 1% and 50%, respectively. The far left bar plot indicates the number of simulations that follow a specific genetic drift trajectory (shown on the right). PFL, progressed follicular lymphoma; TFL, transformed follicular lymphoma; VAF, variant allele frequency.
Fig 8
Fig 8. Results from targeted sequencing of 86 genes in samples from 159 transformed follicular lymphoma patients (128 T1 and 149 T2 samples).
(A) Credible intervals from Bayesian proportion test (top). Genes are ranked by group difference and separated based on whether the probability of a given gene to be more commonly mutated in T2 is >0.95 or not. The percentage of samples harboring mutations in given genes is given at the bottom. (B) CD8-positive pixel count by Aperio automated imaging of immunohistochemically stained tissue cores, by time point and B2M mutation status. Only cases with paired information on CD8+ T cell scoring and mutation status are shown. (C) Representative microscopy images taken at 200× or 800× magnification (CD8 and B2M, respectively). (D) Proportion of mutated samples by cell of origin (activated B-cell-like [ABC] or germinal center B-cell-like [GCB]); shown are only genes that are significantly associated with either subtype (Fisher p < 0.05). IHC, immunohistochemistry.
Fig 9
Fig 9. Results from targeted sequencing of 86 genes in 41 patients with early progression and 84 patients with late/never progression.
(A) Credible intervals from Bayesian proportion test (top). Genes are ranked by group difference and separated based on whether the probability of a given gene to be more commonly mutated in patients with early progression is >0.95 or not. The percentage of samples harboring mutations in given genes is given at the bottom. (B) Oncoplot of genes associated with early progression, annotated with FLIPI and m7-FLIPI risk groups. FLIPI, Follicular Lymphoma International Prognostic Index.
Fig 10
Fig 10. Schematic models of evolutionary progression in transformed and progressed follicular lymphoma.
(A) The timesweep facet (top) shows the diagram of a prototypical transformed case in follicular lymphoma, indicating dynamics of clonal composition from germline to diagnostic T1 specimen to histologically transformed T2 specimen. The clonal trajectory facet (bottom) presents an alternative view of the timesweep facet, without the clonal hierarchy, demonstrating the trajectory of the individual clones over time. Listed genes include those found to be predominantly enriched at one time point in our study and/or in the literature. (B) The timesweep facet (top) shows the diagram of a prototypical follicular lymphoma case that progressed on treatment, indicating dynamics of clonal composition from germline to diagnostic T1 specimen to progressed T2 specimen, with the trajectory of each clone presented in the clonal trajectory facet (bottom).

References

    1. A clinical evaluation of the International Lymphoma Study Group classification of non-Hodgkin’s lymphoma. The Non-Hodgkin’s Lymphoma Classification Project. Blood. 1997;89(11):3909–18. - PubMed
    1. Anderson JR, Armitage JO, Weisenburger DD. Epidemiology of the non-Hodgkin’s lymphomas: distributions of the major subtypes differ by geographic locations. Non-Hodgkin’s Lymphoma Classification Project. Ann Oncol. 1998;9(7):717–20. - PubMed
    1. Bachy E, Houot R, Morschhauser F, Sonet A, Brice P, Belhadj K, et al. Long-term follow up of the FL2000 study comparing CHVP-interferon to CHVP-interferon plus rituximab in follicular lymphoma. Haematologica. 2013;98(7):1107–14. 10.3324/haematol.2012.082412 - DOI - PMC - PubMed
    1. Tan D, Horning SJ, Hoppe RT, Levy R, Rosenberg SA, Sigal BM, et al. Improvements in observed and relative survival in follicular grade 1–2 lymphoma during 4 decades: the Stanford University experience. Blood. 2013;122(6):981–7. 10.1182/blood-2013-03-491514 - DOI - PMC - PubMed
    1. Junlen HR, Peterson S, Kimby E, Lockmer S, Linden O, Nilsson-Ehle H, et al. Follicular lymphoma in Sweden: nationwide improved survival in the rituximab era, particularly in elderly women—a Swedish Lymphoma Registry study. Leukemia. 2014;29(3):668–76. 10.1038/leu.2014.251 - DOI - PubMed