

Enhanced Visualization of Subtle Outer Retinal Pathology by En Face Optical Coherence Tomography and Correlation with Multi-Modal Imaging
- PMID: 27959968
- PMCID: PMC5154571
- DOI: 10.1371/journal.pone.0168275
Enhanced Visualization of Subtle Outer Retinal Pathology by En Face Optical Coherence Tomography and Correlation with Multi-Modal Imaging
Abstract
Purpose: To present en face optical coherence tomography (OCT) images generated by graph-search theory algorithm-based custom software and examine correlation with other imaging modalities.
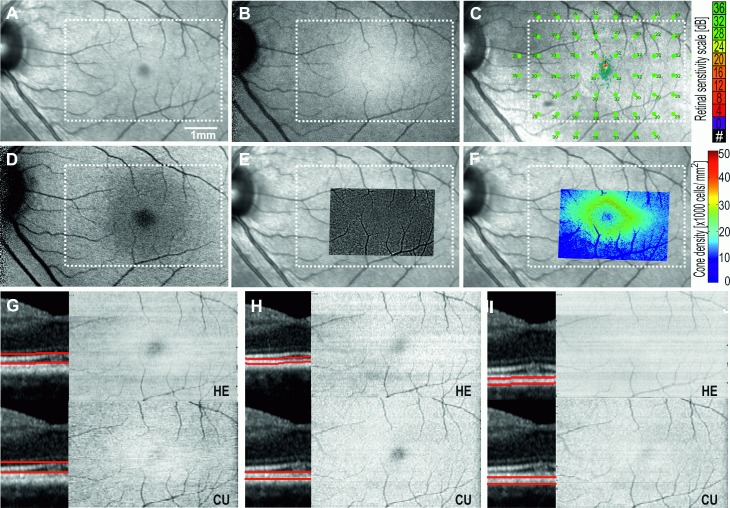
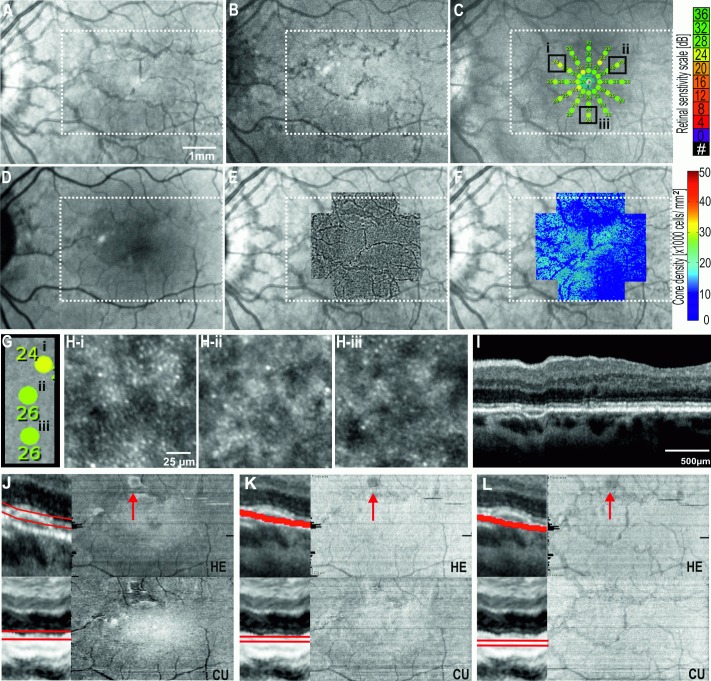
Methods: En face OCT images derived from high density OCT volumetric scans of 3 healthy subjects and 4 patients using a custom algorithm (graph-search theory) and commercial software (Heidelberg Eye Explorer software (Heidelberg Engineering)) were compared and correlated with near infrared reflectance, fundus autofluorescence, adaptive optics flood-illumination ophthalmoscopy (AO-FIO) and microperimetry.
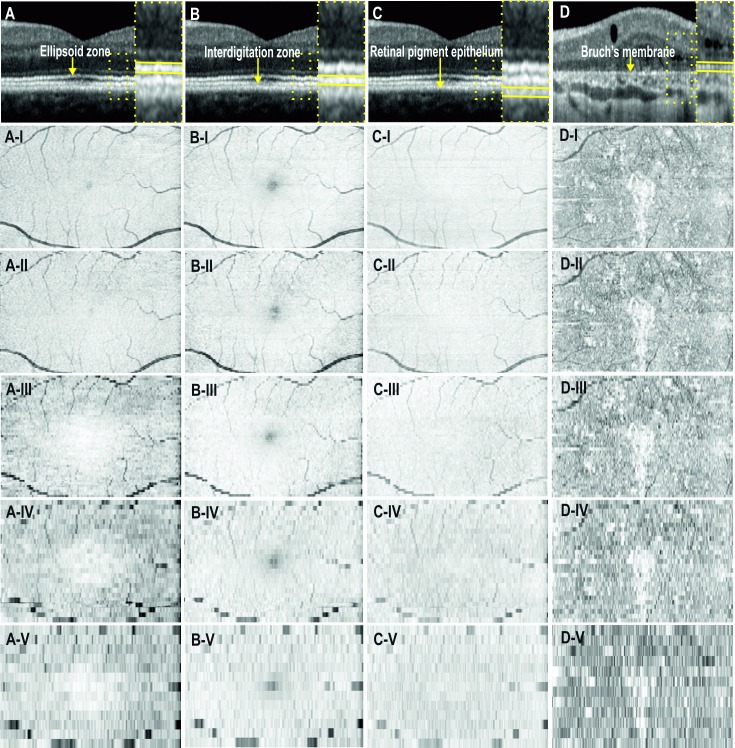
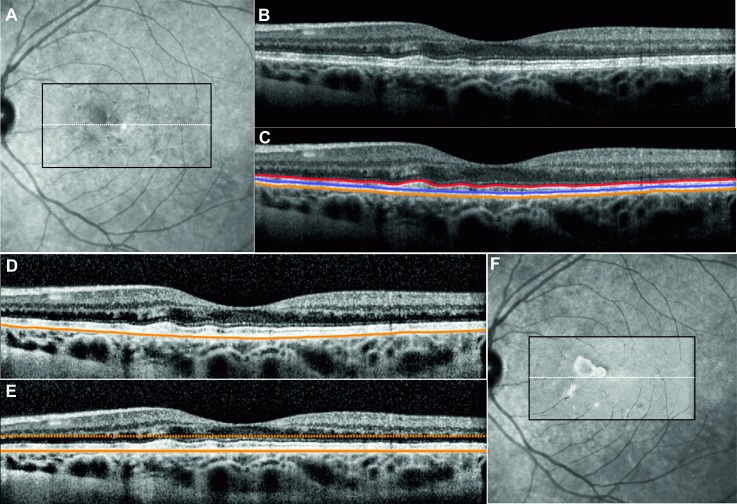
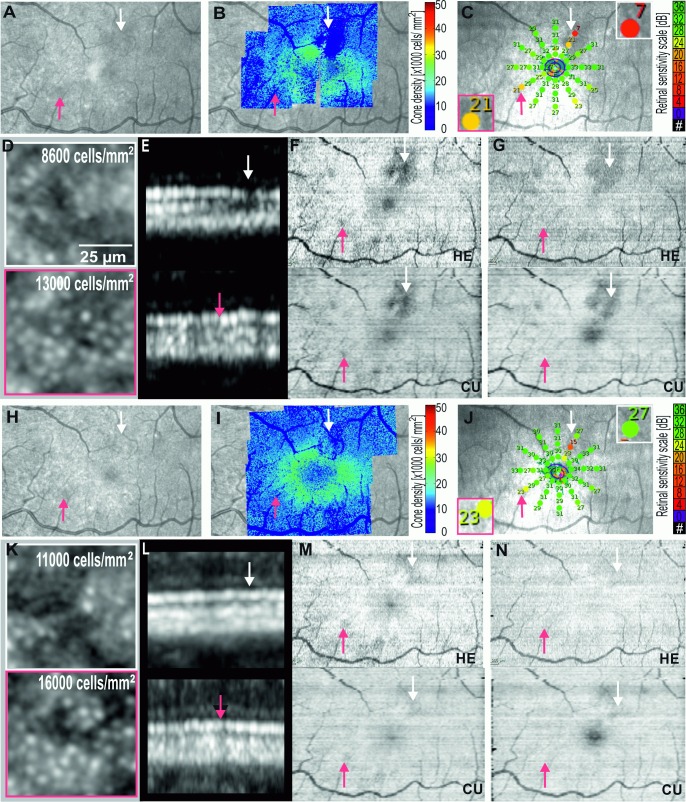
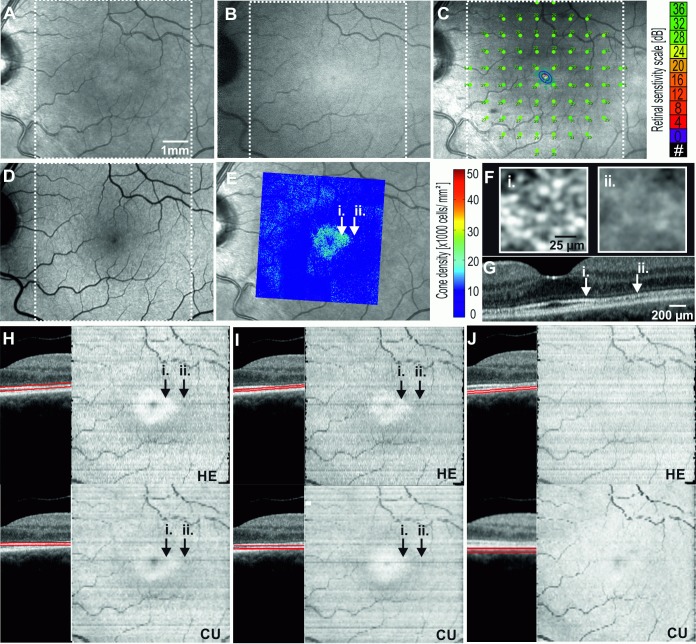
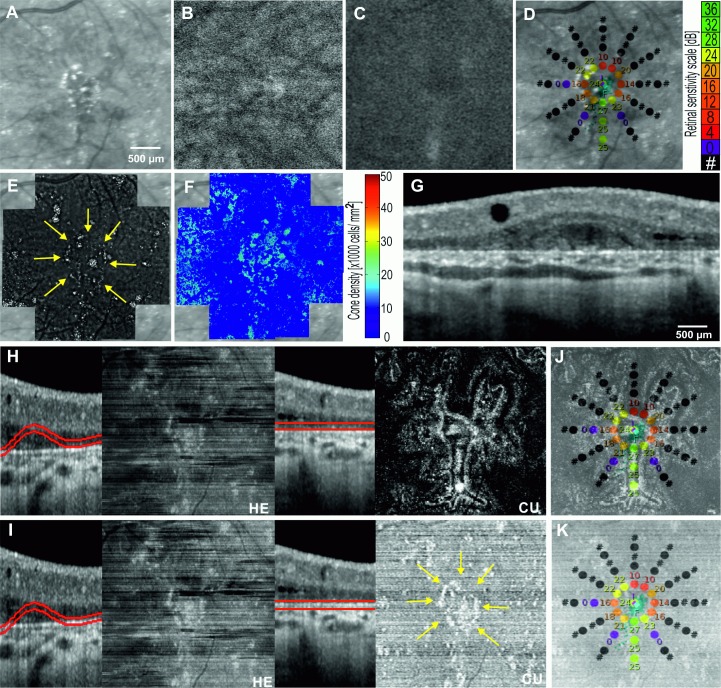
Results: Commercial software was unable to generate accurate en face OCT images in eyes with retinal pigment epithelium (RPE) pathology due to segmentation error at the level of Bruch's membrane (BM). Accurate segmentation of the basal RPE and BM was achieved using custom software. The en face OCT images from eyes with isolated interdigitation or ellipsoid zone pathology were of similar quality between custom software and Heidelberg Eye Explorer software in the absence of any other significant outer retinal pathology. En face OCT images demonstrated angioid streaks, lesions of acute macular neuroretinopathy, hydroxychloroquine toxicity and Bietti crystalline deposits that correlated with other imaging modalities.
Conclusions: Graph-search theory algorithm helps to overcome the limitations of outer retinal segmentation inaccuracies in commercial software. En face OCT images can provide detailed topography of the reflectivity within a specific layer of the retina which correlates with other forms of fundus imaging. Our results highlight the need for standardization of image reflectivity to facilitate quantification of en face OCT images and longitudinal analysis.
Conflict of interest statement
The authors have declared that no competing interests exist.
Figures
Similar articles
-
Multimodal imaging including spectral domain OCT and confocal near infrared reflectance for characterization of outer retinal pathology in pseudoxanthoma elasticum.Invest Ophthalmol Vis Sci. 2009 Dec;50(12):5913-8. doi: 10.1167/iovs.09-3541. Epub 2009 Jun 24. Invest Ophthalmol Vis Sci. 2009. PMID: 19553619
-
Perifoveal interdigitation zone loss in hydroxychloroquine toxicity leads to subclinical bull's eye lesion appearance on near-infrared reflectance imaging.Doc Ophthalmol. 2018 Feb;136(1):57-68. doi: 10.1007/s10633-017-9615-9. Epub 2017 Nov 9. Doc Ophthalmol. 2018. PMID: 29124422 Free PMC article.
-
The In Vivo Correlation between Retinal Pigment Epithelium Thickness and Quantitative Fundus Autofluorescence in a White Population.Ophthalmol Retina. 2021 Apr;5(4):365-373. doi: 10.1016/j.oret.2020.07.029. Epub 2020 Aug 5. Ophthalmol Retina. 2021. PMID: 32763425
-
[Pathophysiology of macular diseases--morphology and function].Nippon Ganka Gakkai Zasshi. 2011 Mar;115(3):238-74; discussion 275. Nippon Ganka Gakkai Zasshi. 2011. PMID: 21476310 Review. Japanese.
-
ZEISS Angioplex™ Spectral Domain Optical Coherence Tomography Angiography: Technical Aspects.Dev Ophthalmol. 2016;56:18-29. doi: 10.1159/000442773. Epub 2016 Mar 15. Dev Ophthalmol. 2016. PMID: 27023249 Review.
Cited by
-
Clinical and multimodal imaging features of acute macular neuroretinopathy lesions following recent SARS-CoV-2 infection.Int J Ophthalmol. 2023 May 18;16(5):755-761. doi: 10.18240/ijo.2023.05.13. eCollection 2023. Int J Ophthalmol. 2023. PMID: 37206184 Free PMC article.
-
Automated detection of photoreceptor disruption in mild diabetic retinopathy on volumetric optical coherence tomography.Biomed Opt Express. 2017 Nov 7;8(12):5384-5398. doi: 10.1364/BOE.8.005384. eCollection 2017 Dec 1. Biomed Opt Express. 2017. PMID: 29296475 Free PMC article.
-
FREQUENT SUBCLINICAL MACULAR CHANGES IN COMBINED BRAF/MEK INHIBITION WITH HIGH-DOSE HYDROXYCHLOROQUINE AS TREATMENT FOR ADVANCED METASTATIC BRAF MUTANT MELANOMA: Preliminary Results From a Phase I/II Clinical Treatment Trial.Retina. 2019 Mar;39(3):502-513. doi: 10.1097/IAE.0000000000002027. Retina. 2019. PMID: 29324592 Free PMC article. Clinical Trial.
-
Predicting visual acuity in Bietti crystalline dystrophy: evaluation of image parameters.BMC Ophthalmol. 2021 Feb 4;21(1):68. doi: 10.1186/s12886-021-01811-y. BMC Ophthalmol. 2021. PMID: 33541298 Free PMC article.
-
Optical Attenuation Coefficient-Based En Face Optical Coherence Tomography Imaging for the Reliable Assessment of the Ellipsoid Zone.J Clin Med. 2024 Nov 25;13(23):7140. doi: 10.3390/jcm13237140. J Clin Med. 2024. PMID: 39685597 Free PMC article.
References
-
- Girkin C. Principles of confocal scanning laser ophthalmoscopy for the clinician. The Essential HRT Primer. 2005;1–9.
-
- Wojtkowski M. High-speed optical coherence tomography: basics and applications. Appl Opt. 2010;49(16): 30–61. - PubMed
MeSH terms
LinkOut - more resources
Full Text Sources
Other Literature Sources
Research Materials
