. 2016 Mar;12(1):39-48.
doi: 10.1227/NEU.0000000000001033. Epub 2015 Sep 25.

Magnetic Resonance Thermometry-Guided Stereotactic Laser Ablation of Cavernous Malformations in Drug-Resistant Epilepsy: Imaging and Clinical Results

Affiliations

Magnetic Resonance Thermometry-Guided Stereotactic Laser Ablation of Cavernous Malformations in Drug-Resistant Epilepsy: Imaging and Clinical Results

D Jay McCracken et al. Oper Neurosurg. 2016 Mar.

Abstract

Background: Surgery is indicated for cerebral cavernous malformations (CCM) that cause medically refractory epilepsy. Real-time magnetic resonance thermography (MRT)-guided stereotactic laser ablation (SLA) is a minimally invasive approach to treating focal brain lesions. SLA of CCM has not previously been described.

Objective: To describe MRT-guided SLA, a novel approach to treating CCM-related epilepsy, with respect to feasibility, safety, imaging, and seizure control in 5 consecutive patients.

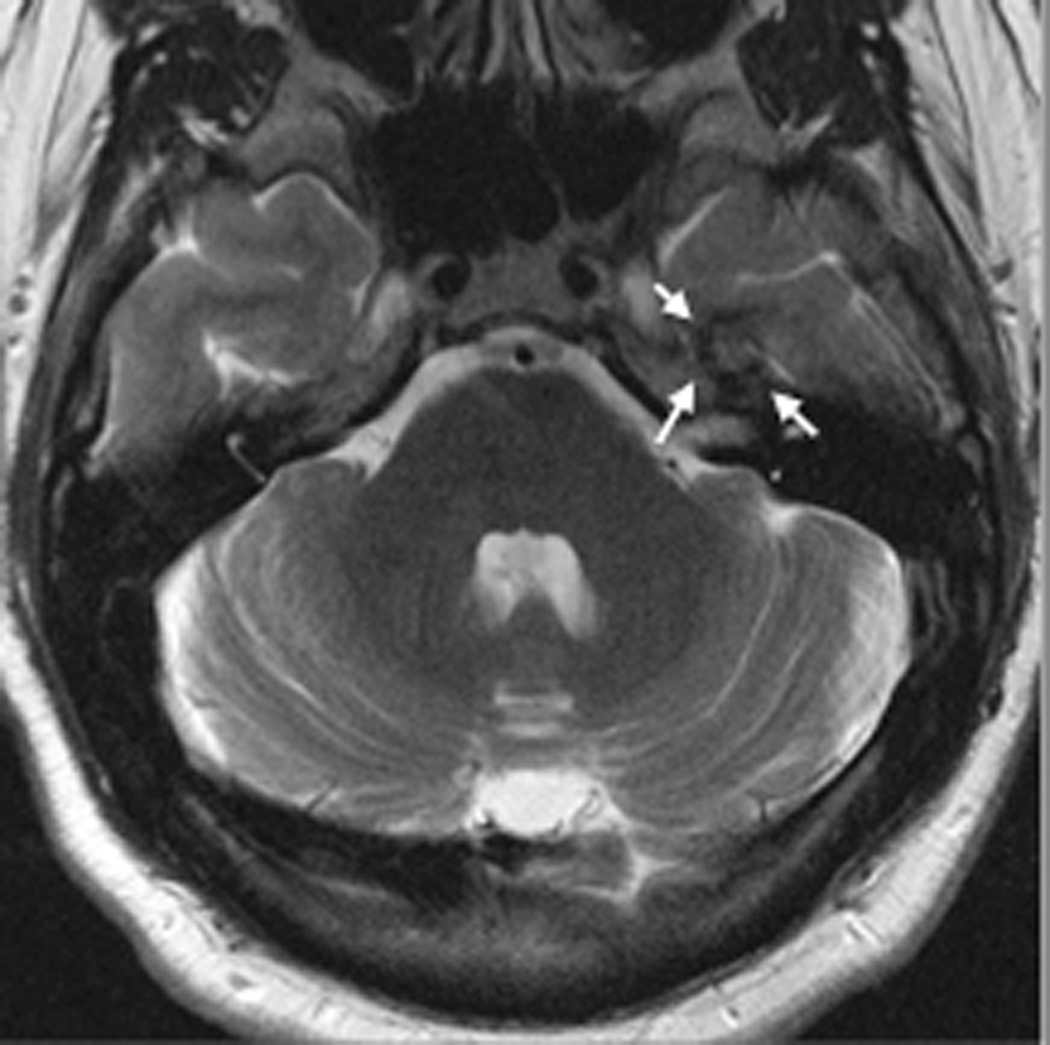
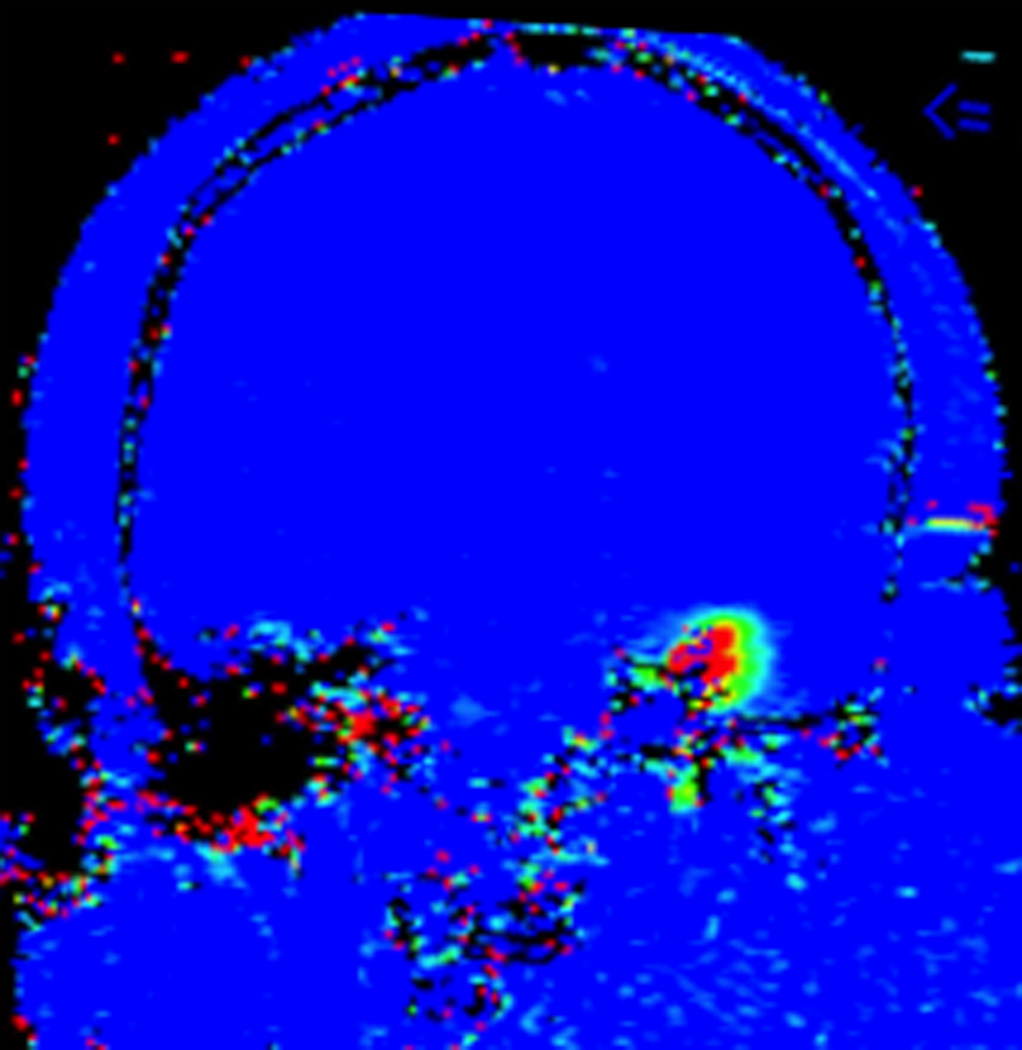
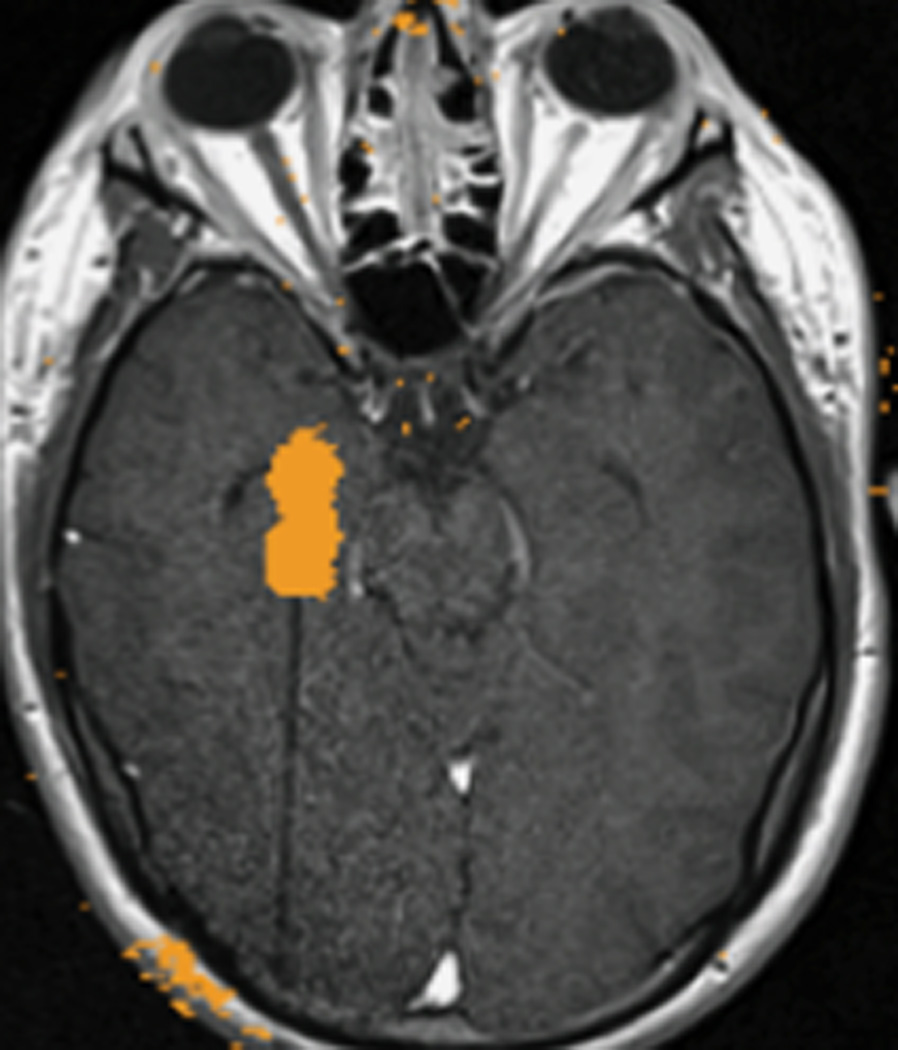
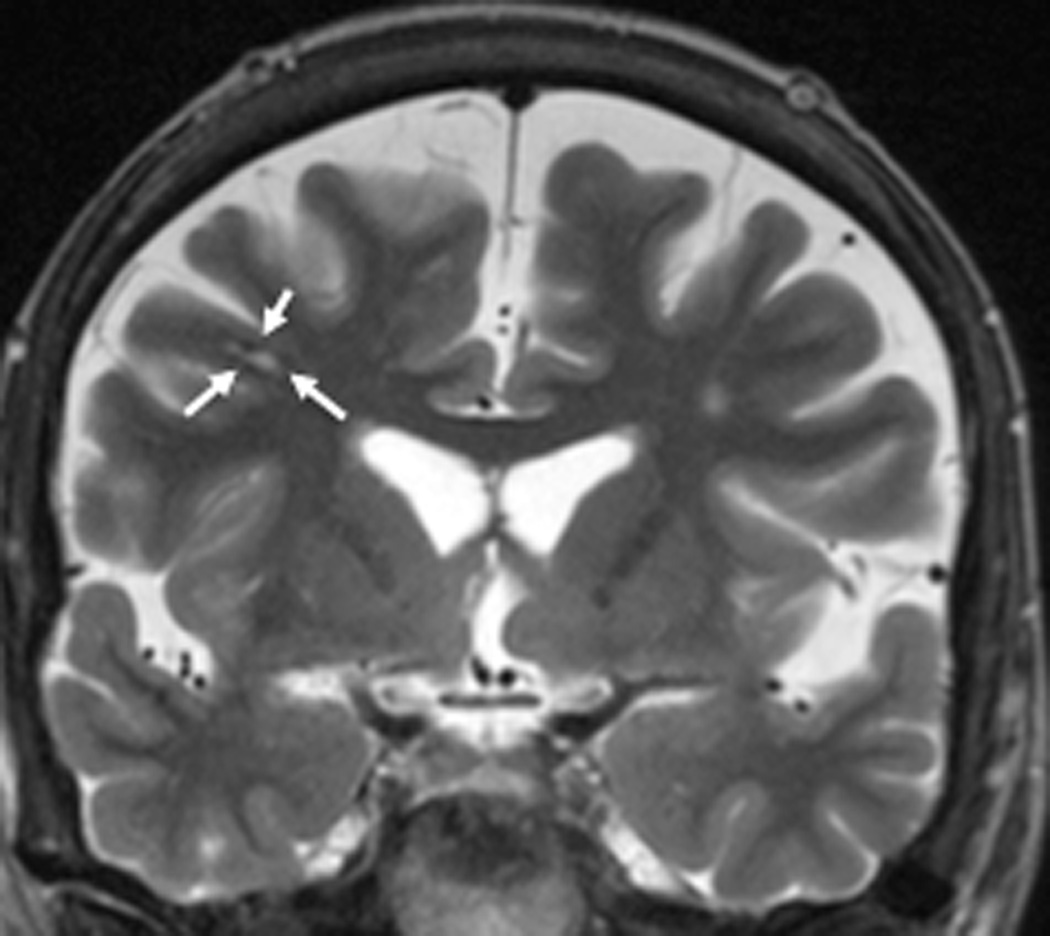
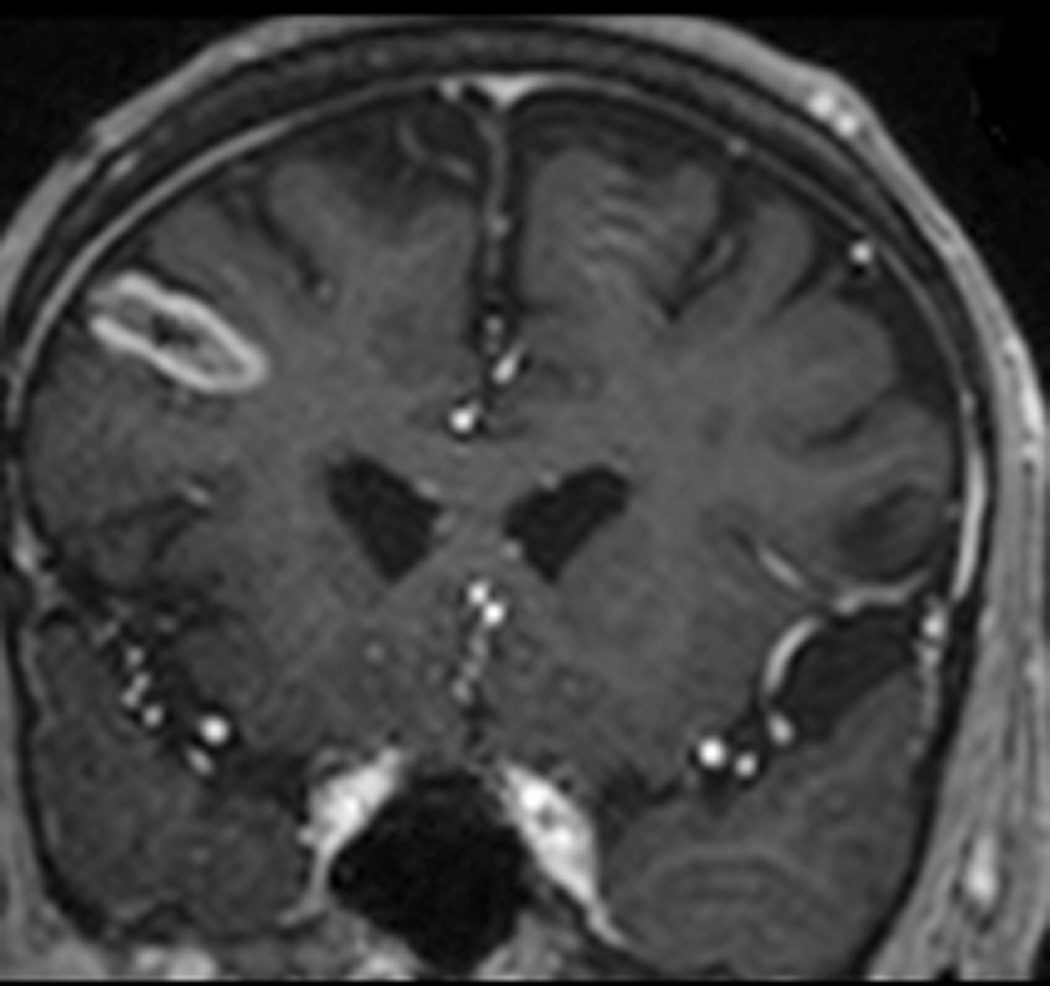
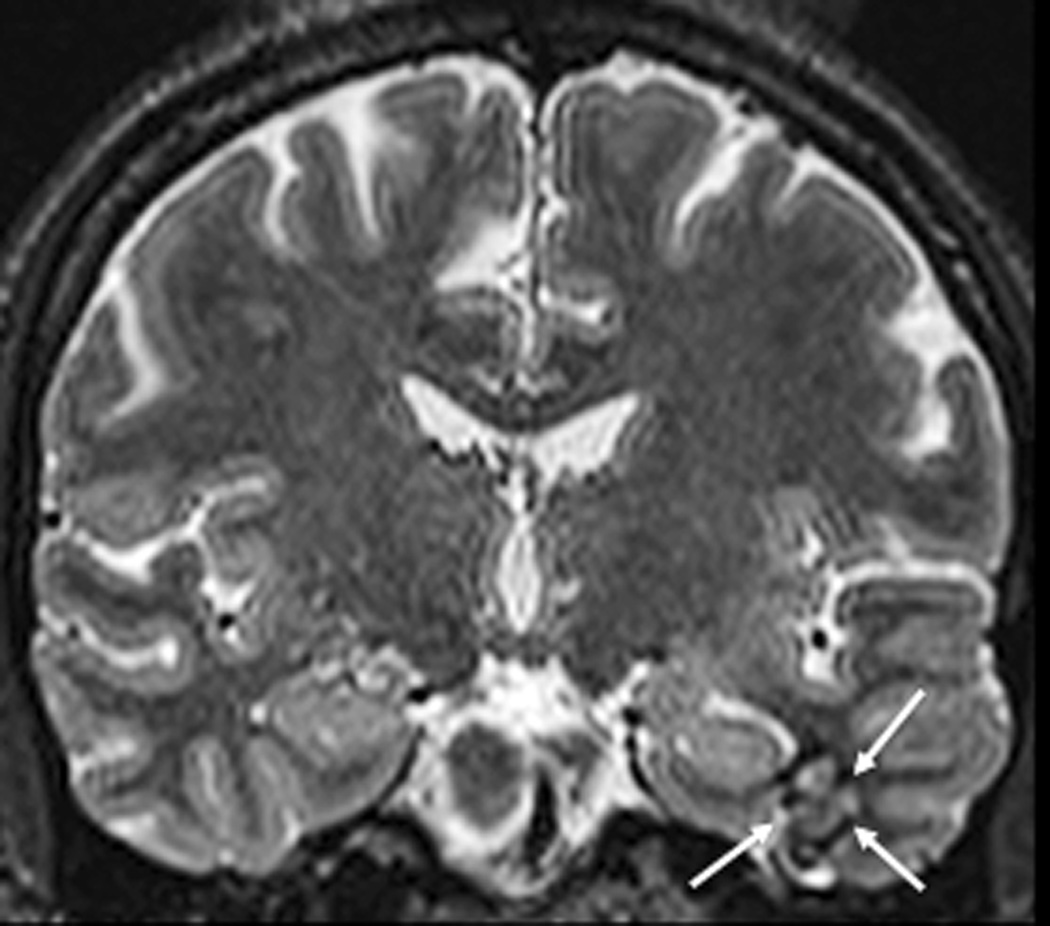
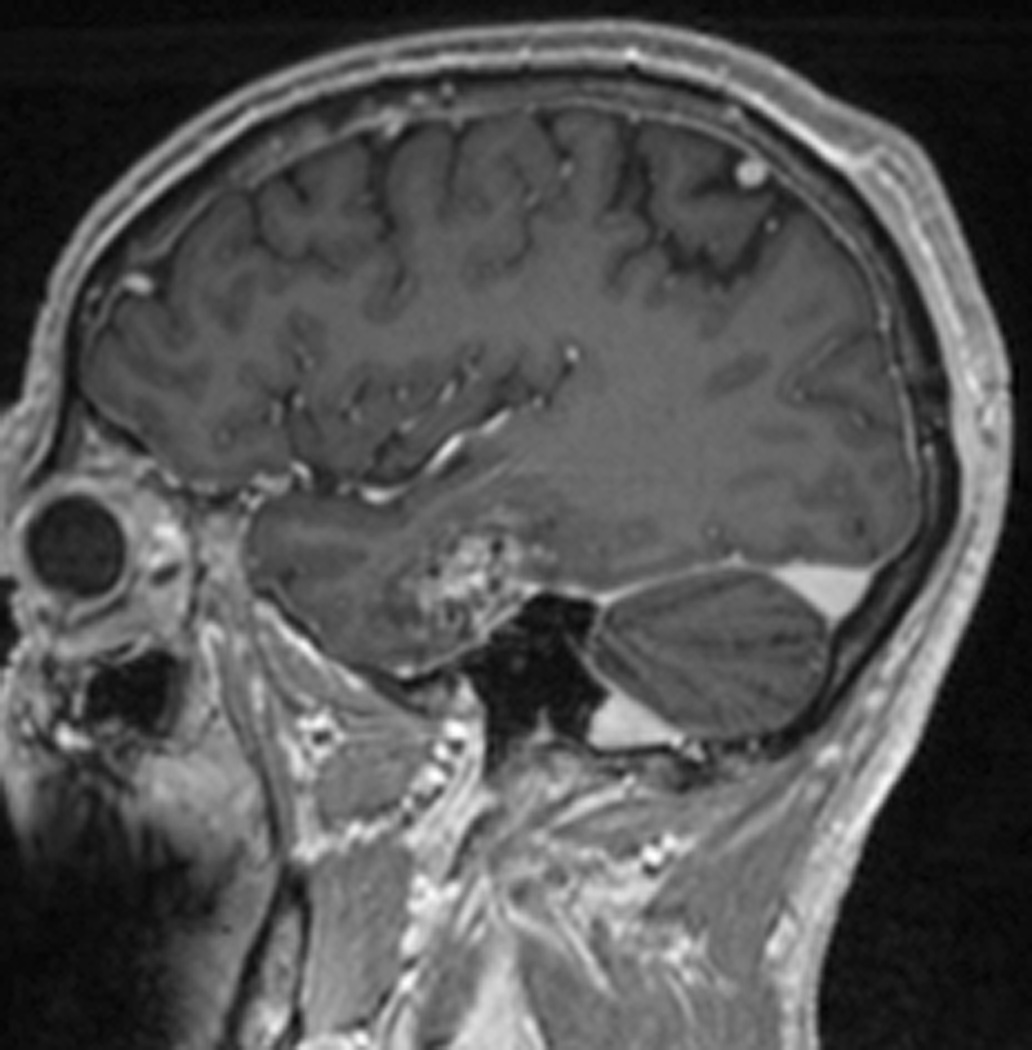
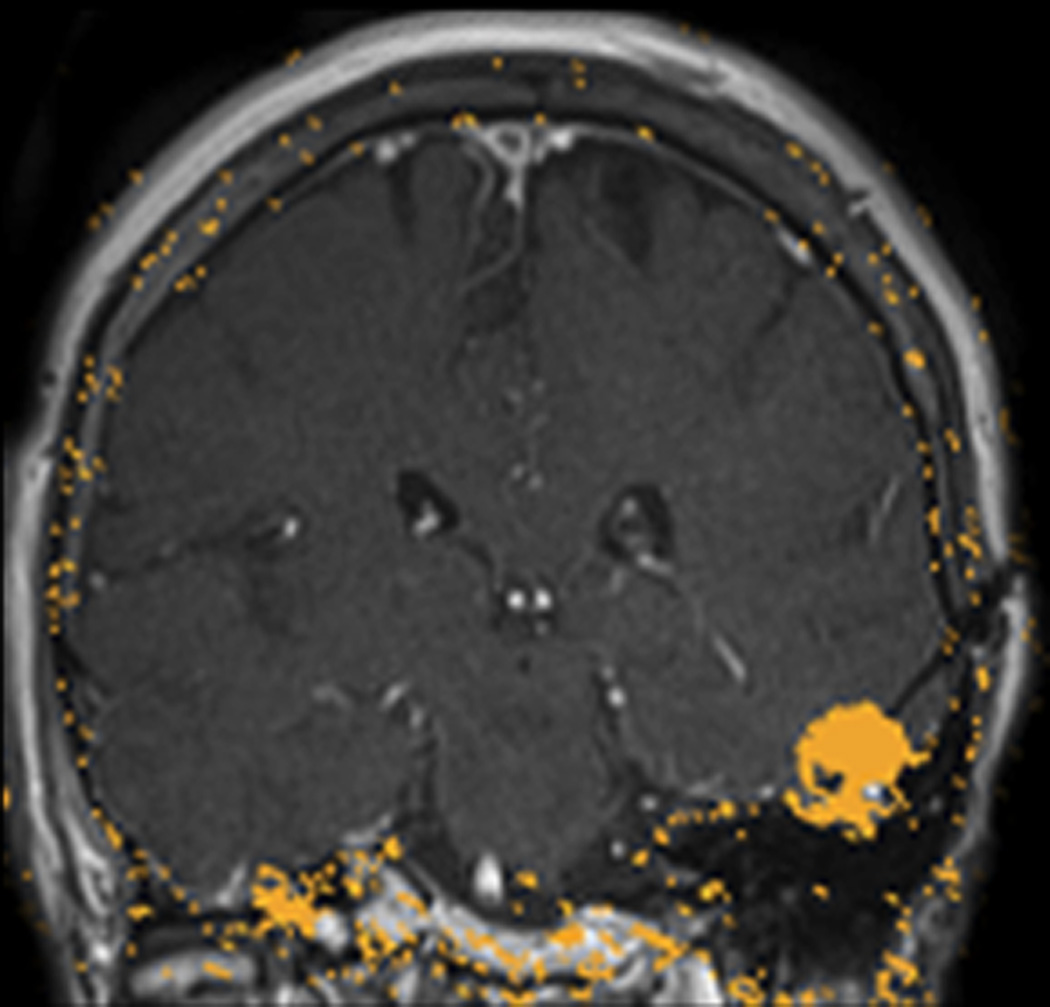
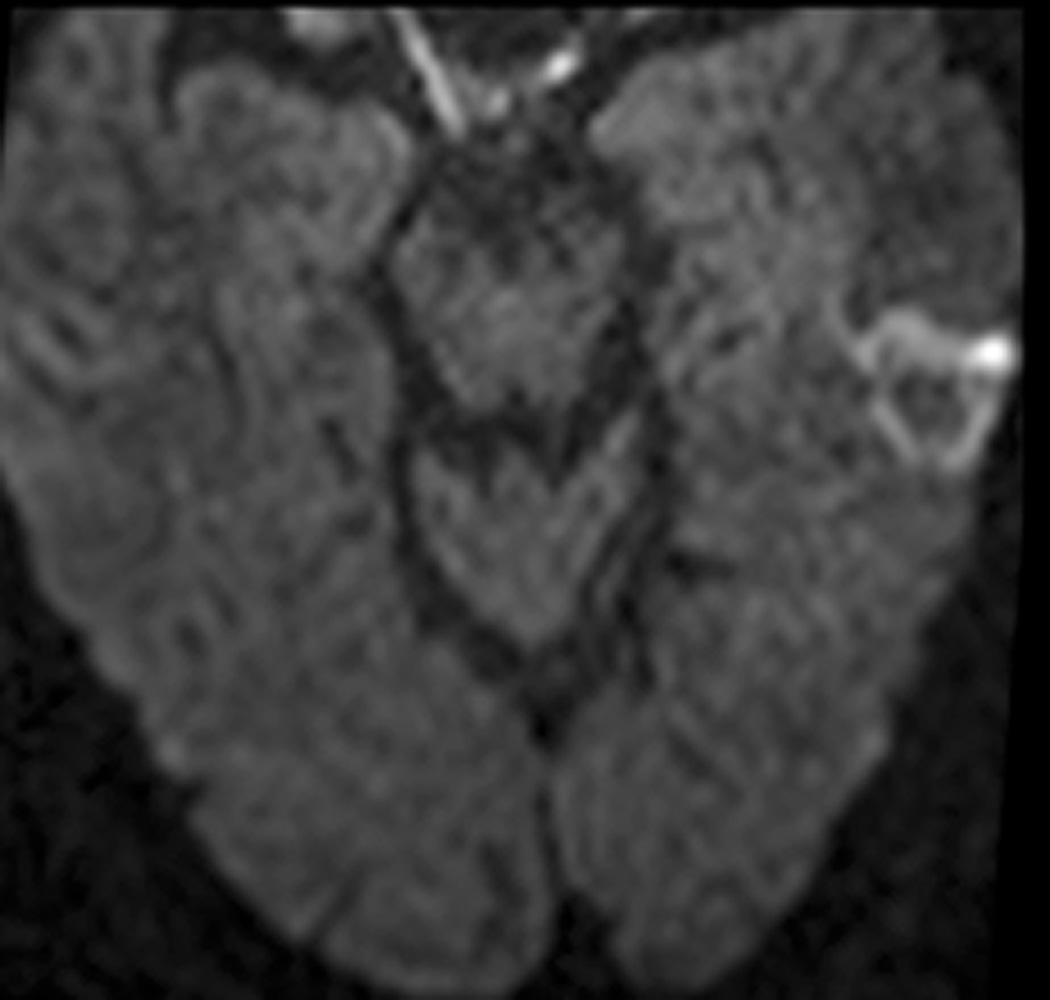
Methods: Five patients with medically refractory epilepsy undergoing standard presurgical evaluation were found to have corresponding lesions fulfilling imaging characteristics of CCM and were prospectively enrolled. Each underwent stereotactic placement of a saline-cooled cannula containing an optical fiber to deliver 980-nm diode laser energy via twist drill craniostomy. MR anatomic imaging was used to evaluate targeting prior to ablation. MR imaging provided evaluation of targeting and near real-time feedback regarding extent of tissue thermocoagulation. Patients maintained seizure diaries, and remote imaging (6-21 months post-ablation) was obtained in all patients.

Results: Imaging revealed no evidence of acute hemorrhage following fiber placement within presumed CCM. MRT during treatment and immediate post-procedure imaging confirmed desired extent of ablation. We identified no adverse events or neurological deficits. Four of 5 (80%) patients achieved freedom from disabling seizures after SLA alone (Engel class 1 outcome), with follow-up ranging 12-28 months. Reimaging of all subjects (6-21 months) indicated lesion diminution with surrounding liquefactive necrosis, consistent with the surgical goal of extended lesionotomy.

Conclusion: Minimally invasive MRT-guided SLA of epileptogenic CCM is a potentially safe and effective alternative to open resection. Additional experience and longer follow-up are needed.

Keywords: Epilepsy; cavernous malformation; laser therapy; magnetic resonance imaging; minimally invasive surgical procedures; stereotactic techniques; thermometry.


Conflict of interest statement

The terms of this arrangement have been reviewed and approved by Emory University in accordance with its conflict of interest policies.

Figures

FIGURE 1
FIGURE 1. Magnetic resonance thermometry-guided stereotactic laser thermal ablation of a putative cerebral cavernous malformation (CCM) associated with epilepsy in subject 1
Preoperative axial T2-weighted fast spin echo (A), T2*-weighted gradient recalled echo (GRE) (B), and gadolinium-enhanced T1-weighted (C) MR images demonstrate a lesion consistent with CCM (arrows) in the superficial fusiform gyrus near the skull base. Intraoperative coronal MR images (D–G): D, T1-weighted image demonstrates stereotactic placement of cannula and optical fiber into the CCM without evidence of acute hemorrhage or mass effect. Dotted white line delineates margin of skull base for reference. E, Thermal imaging (blue 37–46°C, green 57–66°C, yellow 67–76°C, red >76°C) as shown on the laser workstation during laser interstitial thermal therapy. Note small areas of signal dropout (blue contiguous with red) within the ablation core, presumably due to proximity to the skull base or the effects of intrinsic blood products associated with CCM upon GRE-based thermal imaging. F, Estimate of the total zone of irreversible laser ablation as shown on the laser workstation during therapy. G, Immediate post-procedure coronal post-contrast T1-weighted image demonstrating increased enhancement (ablation zone) at the location of the CCM. Repeat axial imaging obtained at 6 months post-procedure exemplified by T2-weighted (H) and T2*-GRE (I) images demonstrate changes in the CCM and surrounding cortex relative to corresponding preoperative images (A and B, respectively). At 6 months, the CCM appeared slightly smaller on T2 and GRE images, and there was more T2 hypointensity centrally within the ablated CCM, corresponding to blood products (methemoglobin). Post-contrast T1-weighted images (not shown) showed slightly increased enhancement within the center of the ablated CCM. Around the region of the CCM itself there had been interval development of a surrounding area of marked T1 hypointensity, which corresponded to extremely high T2 signal (H), compatible with fluid signal intensity from liquefaction. Additional T2-weighted imaging at 21 months post-procedure (J) demonstrates a stable area of encephalomalacia (compared to H) but with further reduction of the central hypointense methemoglobin and hemosiderin (circumferential arrows), demonstrating further diminution of the CCM over a prolonged period.
FIGURE 2
FIGURE 2. MRT-guided SLA of putative CCM associated with epilepsy in subjects 2 – 4
A–E, subject 2; F–J, subject 3; K–O), subject 4. Preoperative coronal T2-weighted MR images (A, F, K) demonstrate lesions consistent with CCM (arrows) for each subject. Preoperative T2*-GRE weighted MR images (B, G, L) demonstrate susceptibility consistent with focal hemosiderin for each subject. Axial (C), coronal (H), and sagittal (M) brain tissue damage estimates (yellow pixilated regions of interest) generated by the laser workstation during ablation for each subject, with some evidence of GRE-based thermal signal dropout (lack of yellow pixels) impacting confluence of damage estimates. Note placement of stereotactic laser optical fibers in each case. Some thermal imaging artifacts (scattered yellow pixels) are also apparent near bone in some images. Immediate post-procedure contrast-enhanced T1-weighted MR images in axial (D), coronal (I), and sagittal (N) orientations illustrate comparability of final acute ablation zones to previous tissue damage estimates. Remote post-ablation T2- weighted images in subject 2 at 12 months (E), subject 3 at 6 months (J) and subject 4 at 11 months (O), show ablated regions (arrows) to have small central regions of T2 hypointensity consistent with methemoglobin and localized surrounding hyperintensity consistent with liquefactive necrosis. These images suggest diminution of each CCM with surrounding encephalomalacia.
FIGURE 3
FIGURE 3. MRT-guided SLA in subject 5 ablates CCM while sparing an associated vein
A, Pre-operative coronal T2-weighted image exhibiting cavernous malformation (blue arrow) and adjacent vein of Labbé (red arrow). B, Intraoperative coronal T1-weighted image (residual contrast apparent) with fiber in place and lesion lacking contrast enhancement. C, Intraoperative coronal thermal imaging (with red=heat and blue=cold) as shown on the laser workstation during laser interstitial thermal therapy. Note absence of heating in the focal region of the vein of Labbé, as well as a small area of signal dropout inferomedially within the ablation zone corresponding to an area of increased methemoglobin imaged preoperatively. D, Intraoperative coronal estimate of the total zone of irreversible laser ablation as shown on the laser workstation during therapy. E, Immediate post-procedure coronal post-contrast T1-weighted image confirming the ablation zone (area of enhancement). F, Preoperative axial T2-weighted image with cavernous malformation (blue arrow) and vein of Labbé (red arrow). G, Immediate post-procedure axial post-contrast T1-weighted image confirming the ablation zone (area of enhancement) and vein of Labbé. H, Immediate postprocedure diffusion weighted image confirming the ablation zone (area of diffusion restriction). I, Preoperative 3D reconstructions of the vein of Labbé (red) from preoperative post-contrast T1-weighted images in relation to the CCM (blue) from T2-weighted images. J, Immediate postprocedure 3D reconstructions of vein of Labbé (red) and ablation zone (yellow) from post-contrast T1-weighted images with superimposed preoperative CCM volume (blue). Note near complete overlap of ablation zone and CCM as well as lack of appreciable difference in diameter of the vein. K, 6-month post-procedure 3D reconstructions of the vein of Labbé (red) from post-contrast T1-weighted images, and residual CCM volume (magenta) from T2-weighted images, demonstrating diminution in size relative to the superimposed preoperative CCM volume (blue). L, 6-month postprocedure coronal T2-weighted image with outlined residual CCM (mangenta) and superimposed CCM outline (blue) from preoperative T2-weighted image illustrating lesion diminution.

References

    1. Raychaudhuri R, Batjer HH, Awad IA. Intracranial cavernous angioma: a practical review of clinical and biological aspects. Surgical neurology. 2005 Apr;63(4):319–328. discussion 328. - PubMed
    1. Baumann CR, Schuknecht B, Lo Russo G, et al. Seizure outcome after resection of cavernous malformations is better when surrounding hemosiderin-stained brain also is removed. Epilepsia. 2006 Mar;47(3):563–566. - PubMed
    1. Brelie Cvd, von Lehe M, Raabe A, et al. Surgical Resection Can Be Successful in a Large Fraction of Patients With Drug-Resistant Epilepsy Associated With Multiple Cerebral Cavernous Malformations. Neurosurgery. 2014;74(2):147–153. - PubMed
    1. Kim W, Stramotas S, Choy W, Dye J, Nagasawa D, Yang I. Prognostic factors for post-operative seizure outcomes after cavernous malformation treatment. Journal of clinical neuroscience : official journal of the Neurosurgical Society of Australasia. 2011 Jul;18(7):877–880. - PubMed
    1. Kim M, Rowed DW, Cheung G, Ang LC. Cavernous malformation presenting as an extra-axial cerebellopontine angle mass: case report. Neurosurgery. 1997 Jan;40(1):187–190. - PubMed